Full Length Research Paper
ABSTRACT
This study sought to assess the contribution of coffee agroforestry systems (CAFS) in conserving tree diversity and carbon stocks in the western region of Cameroon. Inventory was carried out in 52 plots laid out in CAFS and in adjacent secondary forest. Above-ground biomass was estimated using allometric method. A total of 30 species belonging to 19 families were identified in CAFS and 30 species belonging to 15 families in the forest. The Jaccard similarity index between CAFS and forest was 43%. In the CAFS, the average value of Shanon diversity index was 1.61, reflecting a low diversity. The average tree density was 133 stems/ha in CAFS and 345 stems/ha in the forest. The CAFS stored an amount of carbon of 24.28 tC/ha, representing only 10.30% of the average amount of carbon stored by the forest (235.88 tC/ha). In the CAFS, Elaeis guineensis was the most dominant species with an important value index of 169.96%. The most efficient species for carbon sequestration were Triplochiton scleroxylon with 2.38 tC/tree. These results indicate the need to integrate CAFS as a biodiversity conservation and carbon sequestration land-use system due to the many socio-economic and ecological benefits they provide both in climate change adaptation and mitigation.
Key words: Coffee agroforestry system, diversity, ecosystem services, climate change mitigation, carbon stock.
INTRODUCTION
Global forest cover has drastically decreased from 4128 million ha in 1990 to 3999 million ha in 2015 (FAO, 2016). In tropical regions, extensive conversion of forests and agricultural intensification are typically identified among the most prominent drivers of land-use change and biodiversity loss (Geist and Lambin, 2002). This land-use change is one of the major causes of global climate change (IPCC, 2014). As the impact of climate change is being felt more and more over the years, especially with the perception of small farmers who report lower and / or increased rainfall and shifts in rainy and dry seasons (Ogouwalé, 2006), there is increasing interest to combine adaptation and mitigation measures (Locatelli et al., 2008; Lasco et al., 2014). Strategies for offsetting greenhouse gas emissions include the implementation of better agricultural practices such as agroforestry (FAO, 2010). Agroforestry systems have received increased attention as potentially cost-effective options for climate change mitigation due to their potential to reduce carbon dioxide (CO2) concentrations in the atmosphere by increasing carbon stocks in agricultural lands (FAO, 2010; Hergoualc’h et al., 2012; IPCC, 2014). Albrecht and Kandji (2003) estimated that the potential of carbon storage of tropical agroforestry systems range from 12 to 228tC/ha.
Improving soil fertility and biodiversity conservation are other ecological services provided by agroforestry (Garrity et al., 2010; Atangana et al., 2014) in addition to ensuring food security (Mapongmetsem et al., 2016). Agroforestry combines both food production and environmental protection and are seen as sustainable and therefore eligible for the reduction of emissions from deforestation and degradation (REDD+) mechanism. This incentive mechanism considers conservation and carbon stock in the prospect of payment for environmental services and could be an economic opportunity for farmers (Takimoto et al., 2008; Atangana et al., 2014; Etchiké et al., 2017).
Coffee agriculture represents about 6.5% of world permanent crop and globally, more than 10.5million hectares of tropical land is under coffee production (FAO, 2019).In many parts of the world, coffee is traditionally cultivated under tree cover, the farmers retaining or introducing useful woody species into their plantations (Dalliere and Dounias, 1999; Perfecto et al., 2005; Correia et al., 2010; Tadesse et al., 2014a; Denu et al., 2016; Koda et al., 2019). These coffee agroforestry systems (CAFS) contribute to the conservation of wood diversity and carbon storage (Häger, 2012; Hergoualc’h et al., 2012; Tadesse, 2014b; De Beenhouwer et al., 2016; Denu et al., 2016; Kodaet al., 2019).The amount of carbon stored in a CAFS varies depending on management intensity. For example in Ethiopia, compared to nearby natural forests, CAFS have been reported to retain 50 to 75% of carbon (Tadesse et al. 2014b; Vanderhaegen et al., 2015; Denu et al., 2016).
Western Cameroon is a volcanic region in which the cultivation of coffee trees is an age-old practice. However, the 1980s was marked by a deep coffee crisis following the fall in world prices (Guétat-Bernard, 2008). To cope with the situation, production systems evolved towards crop diversification in order to multiply sources of income (Kankeu and Kaffo, 2012; Manga et al., 2013).Most of these farmers grow coffee in agroforestry systems with a wide variety of useful trees. But given the fact that coffee is losing value due to constant drops in its price, smallholder coffee farmers remain poor and the tendency is to convert coffee agroforestry farms to other crop farms. There is a need to check for ecological services these CAFS provide so that they could be valued in the context of payment for environmental services and carbon stock sold as CO2 emission offsets. Several studies have already been carried out on the biodiversity conservation and carbon storage potential of coffee agroforestry systems in Central and South America (Häger, 2012; Schmitt-Harsh et al., 2012; Richards and Mendez, 2014; Goodall et al., 2015; Zaro et al., 2019) and in East Africa (Tadesse et al., 2014a, b; Vanderhaegen et al., 2015; De Beenhouwer et al., 2016; Bukomeko et al., 2019). In Central Africa and in Cameroon in particular, such studies are still very limited (Manga et al., 2013).Thus, this study is very important and timely as it seeks to evaluate the tree diversity and the carbon sequestration potential of coffee agroforestry systems in the western region of Cameroon.
MATERIALS AND METHODS
Study area
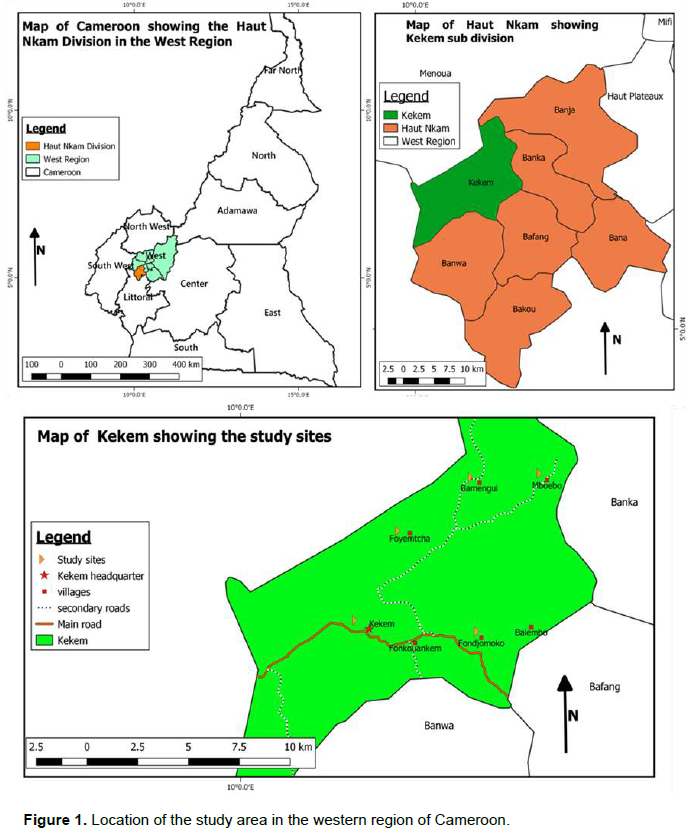
The study was carried out in Kekem sub-division found in the Haut-Nkam division, West Region of Cameroon. The sub-division is located between latitudes 5.01° - 5.15°N and longitudes 10.00° - 10.08°E (Figure 1). The climate of Kekem is of the tropical highland type characterised by two seasons namely; the dry season from November to March and the rainy season the rest of the year. The rainfall here is relatively high with about 1800 to 2000 mm of rainfall per year and temperatures range between 20 and 30°C.Haut-Nkam is a transitional zone between the Mbo plains and the mountain chains of west Cameroon. The altitude is between 600 and 1200 m (PNDP, 2013). Naturally, the vegetation cover is mainly made up of forest and savannah grassland. The grasslands are found in plains, while the forest dominates on hill slopes and tops. Agriculture is by far the main economic activity in the study area. It is mostly carried out on extensive mixed cropping systems. Robusta coffee, cocoa and oil palm are the main cash crops.
Data collection
An inventory was carried out in 5 villages. In coffee farms, sample plots were laid out by adapting the method described by Hairiah et al. (2011) with the marking out of rectangular shaped main plots of 2400 m2 (40m × 60m) for counting woody trees with a diameter at breast height (dbh) ≥ 30 cm and sub- plots of 800 m2 (20m × 40m) for woody trees with a dbh≥ 5 cm. A total of 48 main plots were marked out. Four main control plots of 2400 m² (40m × 60m) were established in adjacent secondary forests for counting woody trees with a diameter at breast height (dbh) ≥ 30 cm and in each plot 2 sub- plots of 200 m2 (5m x 40m) were laid out for counting woody trees with a dbh ≥ 5 cm. The choice to count trees of dbh ≥ 5 cm was made based on the allometric equation used for the biomass calculation. Indeed, the equation used (Chave et al., 2014) considers trees with a diameter of at least 5 cm at breast height.
In each plot we measured height and the diameter at breast height of all woody species including coffee trees. The diameters of coffee trees were also measured at breast height. The diameters were measured using a measuring tape and the height with a clinometer. Species identification was made on the basis of discriminating characteristics of species using dichotomous keys of Cameroon flora, Identification Manual of Vivien and Faure (2012) and vernacular names. The botanical nomenclature adopted is that of Lebrun and Stork (1991-1997). Semi-structured interviews with 30 farmers provided information on indigenous knowledge, conservation and the introduction of species and their main uses.
Data analysis
Diversity, species richness and floristic composition
The main floristic parameters considered in this study were species richness, the diversity indexes of Shannon and Simpson, Evenness index of Piélou, family importance value index (FIV) and importance value index of species (IVI).
Species richness: This refers to the total number of species that make up a community. To get its values, we need to know the total number of families and species represented in each sub-plot.
Diversity index of Shannon-Weaver (H'): This index helps to measure the probability of interactions between the different species that constitute the community. This index includes components like the number of species present and the number of individuals within these species.
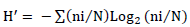
![]()
Where: ni is the total number of individuals of the specie i; and N the number of individuals of all the species.
Evenness Index of Pielou (E): It represents the distribution of species within a particular community. This index varies from 0 to 1 and is at its maximum when the species have equal abundances and at its minimum when one species dominates in the community.
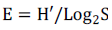
where, S is the total number of species identified and H' the Shannon index.
Simpson diversity index (D’): This is the probability for two individuals selected randomly to belong to different species. The maximum diversity value is represented by 1 and the minimum diversity is represented by 0(Danais, 1982).
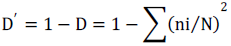
where: ni is the number of individuals for a particular species; N is the total number of individuals for all species.
Jaccard index: Its measures the similarity between species composition of two sites.
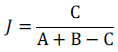
Where A is the number of species for site A, B is the number of species for site B and C the number of species site A and B have in common.
To describe the ecological importance of families and species within the total flora, the Family Importance Value index (FIV) (Mori et al., 1983) and the Importance Value Index (IVI) (Curtis and McIntosh, 1950) were calculated.
FIV= Relative diversity + Relative density + Relative dominance
Where: Relative diversity = (number of species in a family / total number of species) x 100
Relative density = (number of trees in a family / total number of trees) x 100
Relative dominance = (basal area of a family / total basal area) x 100
IVI = Relative Frequency + Relative Density + Relative Dominance
Relative frequency = (frequency of a species / sum of frequencies) x 100
Relative density = (density of a species / sum of all densities) x 100
Relative Dominance = (basal area of a species / sum of all basal areas) x 100.
Stand structure parameters
Vegetation structure was determined by parameters such as density, basal area and distribution of individuals by diameter classes. Density and basal area was estimated using the formula given by Kent and Coker (1992).
Density (D): Density is the number of individuals per hectare. It was calculated by converting the total number of individuals encountered in all plots to equivalent number per hectare, following this formula:
ð· = N/S
With D the density (stems ha-1), N the number of stems present on the considered surface and S the area considered (ha).
Basal area (BA) provides information on the area occupied by tree sections at 1.30 m from the ground.
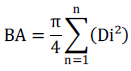
Where BA is basal area (m2 ha-1) and D is diameter (m).
Distribution of individuals by diameter classes: The trees were distributed in the different diameter classes of 10 cm amplitude, following the recommendations of Favrichon et al. (1998).The define classes were as such:(5-15 cm), (15-25 cm), (25-35 cm), (35-45 cm), (45-55 cm), (55-65 cm), (65-75 cm), (75-85 cm) and ≥ 85 cm.
Uses of associated trees
Categories of uses were distinguished according to farmer’s point of view about the services provided by associated trees.Information about the status of the trees (planted or conserved) was also found.
Biomass and carbon estimation
Above ground biomass: A non-destructive sampling method was used for the determination of total aboveground biomass (AGB). We used the allometric equation proposed by Chave et al. (2014) which is given by the formula:
AGB = 0.0673× (ρD²H) 0.976
where, AGB is above ground biomass (in kg), ρ is the specific wood gravity (in g.cm-3), D the tree diameter at breast height (in cm) and H the total tree height (in m).
Because palms trees (E. guineensis) do not have secondary growth the only parameter considered for biomass estimation is tree height and the model developed by Aguaron and McPherson (2012) was used.
AGB = 1.282 × (7.7H + 4.5)
Below ground biomass: The estimation of below ground biomass (root biomass) was calculated using the method by IPCC (2006). This method states that the below ground biomass of trees is gotten by multiplying the value of above ground biomass by the coefficient R which is equal to 0.24.
BGB = AGB x R
where, BGB is below ground biomass, AGB is above ground biomass and R is the root/stem ratio.
Carbon stocks were gotten by multiplying the sum of AGB and BGB by the carbon fraction which has a value of 0.47 (IPCC, 2006). It is expressed mathematically as:
C = (AGB + BGB) × 0.47
where C is the total carbon stock, AGB is above ground Biomass and BGB is below ground biomass.
Statistical analysis
The Excel spreadsheet Microsoft Office helped to organize the data collected and perform descriptive analyzes for a better characterization of these agroforestry systems. Means value of species richness, diversity indices, densities and carbon stocks were subjected to analysis of variance (ANOVA) using the SPSS software. When the differences were significant between the elements of these coffee agroforestry systems in different villages and forest, we put forward the elements that caused these changes by the test Newman-Keuls.
RESULTS
Tree species composition and diversity
Altogether, out of the 48 plots surveyed in CAFS in five villages, 1066 individuals belonging to 30 species and 19 families were recorded. As for the secondary forest zone, 184 individuals were recorded belonging to 30 species and 15 families. The Shannon diversity indices ranged from 0.48 to 2.16 in CAFS (Table 1) showing low species diversity.
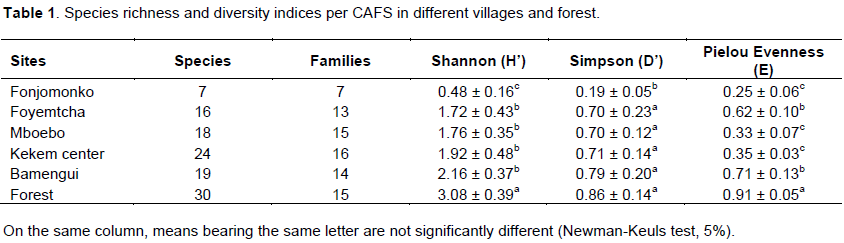
The village where species richness is closest to that of the forest is Kekem center with 24 species, while Fonjomonko is the village with the lowest species richness (7 species). Statistical analysis revealed that there is a significant difference between the Shannon diversity index of the forest and that of CAFS in all the villages and between the villages, there is a significant difference between the Shannon diversity index of Fonjomonko and the other villages (P < 0.001).The Simpson diversity index of Fonjomonko (0.19) was low, showing that there is a higher probability that two trees selected randomly may belong to the same species. There is no significant difference between the Simpson diversity indices of the forest and the other villages, except for Fonjomonko. The Piélouevenness index expresses the distribution of individuals within species and thus, the low index in Fonjomonko (0.25) shows that there is clearly one species that dominates the others.
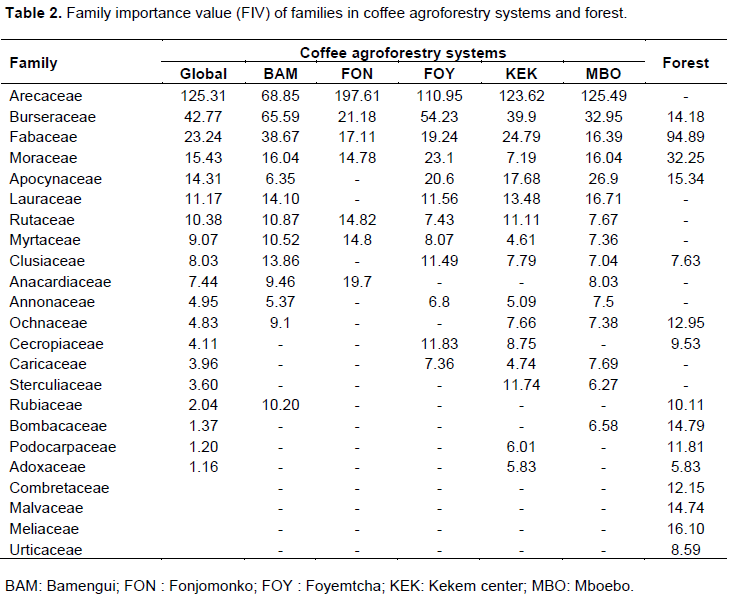
In terms of the number of species in CAFS,the most represented family was Fabaceae with five species, followed by Apocynaceae (4 species), Sterculiaceae, Arecaceae, Rutaceae and Burseraceae with 2 species each.The other 13 families had only onespecies each.The family importance values found in CAFS and in the adjacent forest are presented in Table 2. In CAFS, the most important families were Arecaceae, Burseraceae, Fabaceae, Moraceae and Apocynaceae. CAFS and the forest shared in common eleven families. In the secondary forest, Fabaceae occupied the first place in terms of abundance and dominance followed by Moraceae, Meliaceae, Apocynaceae and Burseraceae.
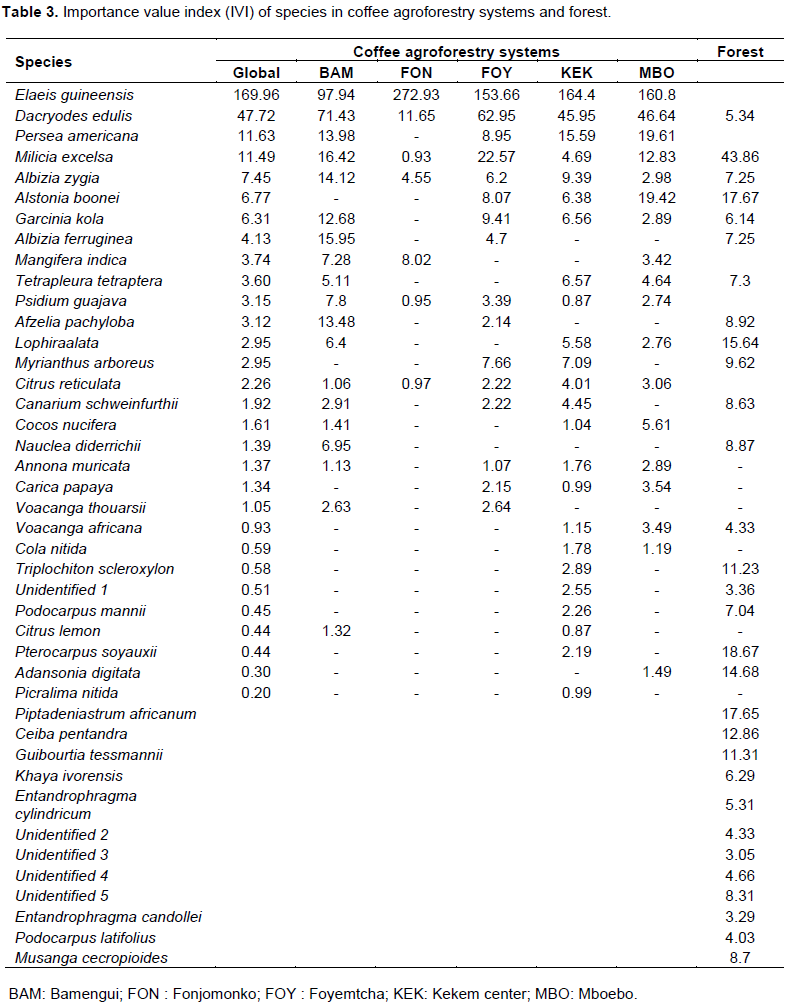
The Importance value indices of species in CAFS are presented in Table 3. E. guineensis had the overall highest importance value index in all the villages (169.96%) followed by Dacryodes edulis (47.72%), Persea americana (11.63%), Milicia excels (11.49%) and Albizia zygia (7.45%). This is quite evident because these species are the most frequent and abundant in the CAFS of the area. Five species had an IVI less than 0.5 (Podocarpus latifolius, Citrus lemon, Pterocarpus soyauxii, Adansonia digitata and Picralima nitida). In the secondary forest, Milicia excelsa had the highest importance value index (43.86%) due its high dominance, and abundance, followed by Pterocarpus soyauxii (18.6%), Alstonia boonei (17.67%), Piptadeniastrum africanum (17.65%) and Lophira alata (15.64%).
Similarity between coffee agroforestry systems and forest
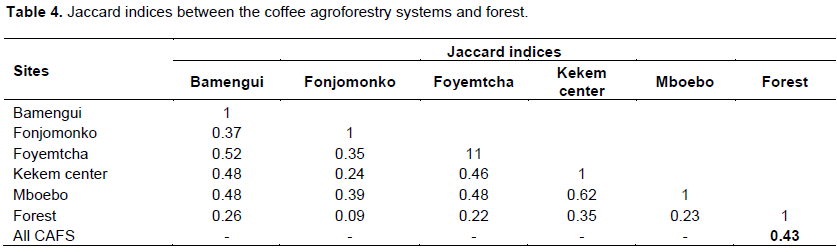
Jaccard's indices of similarity were calculated to compare species composition between the CAFS of the different villages and forest (Table 4). From the values of the Jaccard index, almost all were below 0.5, implying that the floristic composition of the CAFS in the five villages are not similar to each other. The CAFS in Fonjomonko have the fewest number of species in common with other villages and those in the Kekem center and Mboebo villages have more species in common (J = 0.62). Concerning the similarity between CAFS and forest, the overall floristic composition of CAFS is different from that of the forest (J= 0.43). Kekem center which was the village with species richness closest to that of the forest wasalso the village which resembles the forest most, with fourteen species in common (J= 0.35). Eighteen species were found in both the CAFS of at least one village and the forest, among which: Dacryodes edulis, Milicia excelsa, Albizia zygia, Alstonia boonei, Garcinia kola, Albizia ferruginea, Afzelia pachyloba, Triplochiton scleroxylon and Podocarpus latifolius. Only 6 species were found in CAFS in all the villages. These were: Elaeisguineensis, Dacryodes edulis, Milicia excelsa, Albizia zygia, Psidium guajava and Citrus reticulata.
Structure of coffee agroforestry and forest stands
Stem densitiesand basal areas
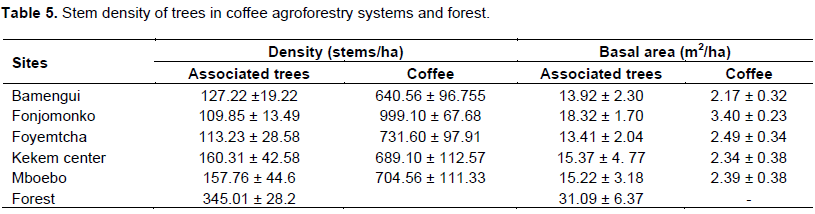
The CAFS have an average tree density of 133±24 stems/ha for associated trees and 753±142 stems/ha for the coffee plants. Kekem center has the highest tree density (160 stems/ha) and Fonjomonko the least (109 stems/ha). The forest on its part has an average density of 345.01 ± 28.28 stems/ha (Table 5). This implies that the associated trees density in CAFS is equivalent to 36% of the tree density of the forest. The mean basal area for the CAFS was 15 ± 3 m²/ha, lower than that of the forest (31.09 ± 6.37 m²/ha). This can be explained by the fact that, the trees density in CAFS is lower than in the forest. Fonjomonko is the village where CAFS had the highest basal area (18.32 ± 1.70 m²/ha), followed by Kekem center (15.37 ± 4.77m²/ha) and Mboebo (15.22 ± 3.18m²/ha).
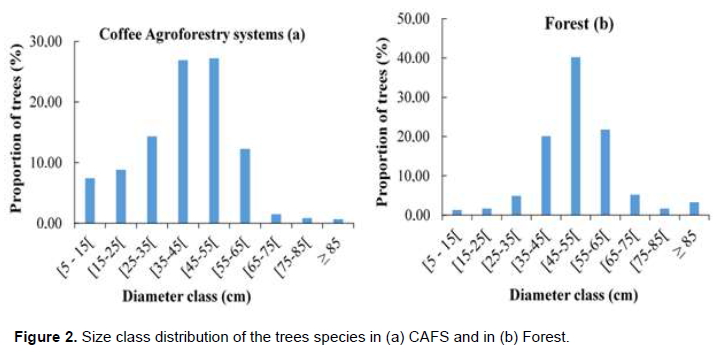
Diameter class distribution
The diameter class distribution of woody vegetation in coffee agroforestry exhibited a tendency towards a bell-curve distribution (Figure 2a). The classes with most abundant individuals were 45-55 cm and 35-45 cm with respectively 27.20 and 26.92% of individuals. Woody vegetation in CAFS has few trees with diameter greater than 85 cm. Small diameter trees represent young growing plants, usually planted by farmers. Larger diameter trees were mostly retained at the time the plantation was established. The same tendency of class diameter distribution was observed in forest with a bell- shape curve (Figure 2b), the classes with most abundant individuals being 45-55 cm with 40.22% of individuals.
Uses of associated trees
The conservation or introduction of woody species into CAFS largely responds to the different needs of households. The interviews with farmers showed that about 73% of tree species were planted, while 27% were conserved during plantation establishment. Five uses have been identified for trees associated with coffee. These are:
(i) Fruit production: concerns trees that produce edible fruits which are destined for home consumption or for sale (Persea americana, Dacryodes edulis, Citrus reticulata, Canarium schweinfurthii, Cocos nucifera, Carica papaya, Mangifera indica, Garcinia kola, Psydium guajava, Citrus lemon, Annona muricata and Cola nitida).
(ii) Medicinal: concernstrees whose barks or fruits are used mainly for medicinal purposes (Alstoniaboonei, Voacanga africana, Picralima nitida and Tetrapleura tetraptera).
(iii) Oil production: specifically of Elaeis guineensis whose fruits are used for the production of palm oil which generates considerable income.
(iv) Wood: this comprises trees that are kept in the farms principally to be used as fuel wood or timber (Milicia excelsa, Lophiraalata, Naucleadi derrichii, Triplochiton scleroxylon, Pterocarpus soyauxii, Afzelia pachyloba and Podocarpus latifolius).
(v) Shade: for trees which are kept in the farms to shade coffee or because they are too large to be cut down. All the other trees that serve for other purpose but especially tall ones can also serve as shade trees.Some of these shade trees are also leguminous species that contribute to the improvement of soil fertility (Albizia zygia, Albizia ferruginea, Afzelia pachyloba, Pterocarpus soyauxii andTetrapleura tetraptera).
Carbon stock in agroforestry systems and forest
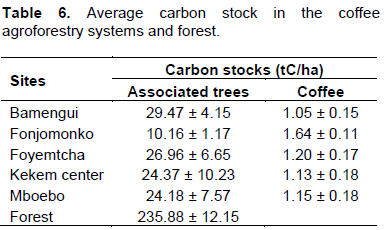
Carbon stock in CAFS was on average 24.28± 6.71 tC/ha with the associated trees contributing to 94.8% of this amount (23.03tC/ha) and coffee trees the remaining 5.2% (1.25 tC/ha). The adjacent forest on the other hand, stocked an average of235.88 ± 12.15tC/ha, which is 9.7 times higher than that of the CAFS (Table 6). From this, we deduce that CAFS stock about 10.30% of the amount of carbon stocked by the forest in this same area. Among the five villages, the carbon stocks of associated trees in the CAFS ranged from 10.16 ± 1.17 tC/ha for Fonjomonkoto 29.47 ± 4.15 tC/ha for Bamengui. At 5% significance level, there is a significant difference between the amount of carbon stocks in the CAFS of Fonjomonko and those of other villages (P = 0.007). In Fonjomonko the low carbon stock in CAFS is due to the very high abundance of E. guineensis which represented 89.6% of individuals counted in this village with an IVI of 272.93%.
Carbon stock allocation by different species
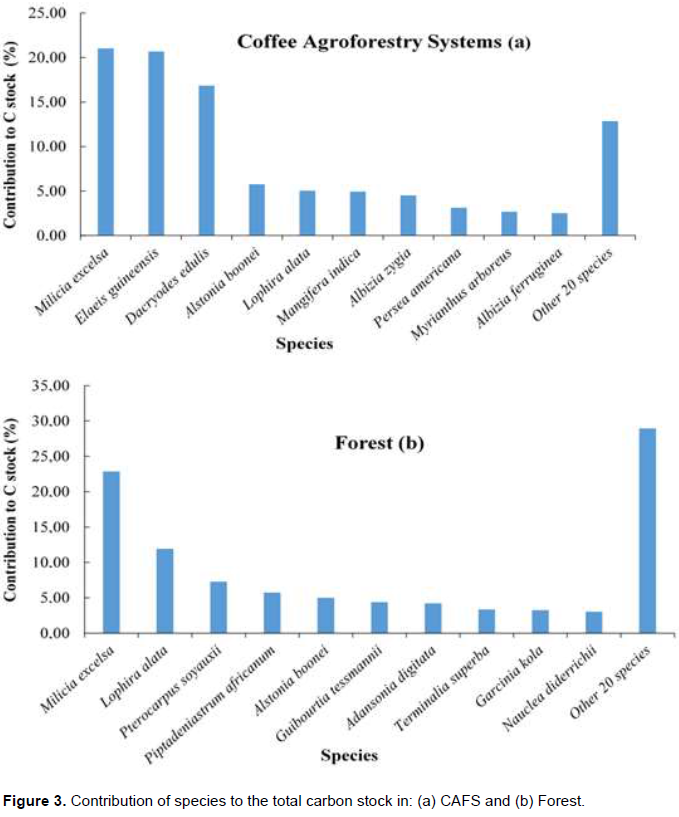
In terms of contribution of species to the total carbon stock, the top five species in the forest were Milicia excelsa, Lophira alata, Pterocarpus soyauxii, Piptadeniastrum africanum and Alstonia boonei. In the CAFS, the greatest contribution was madebyMilicia excelsa, Elaeis guineensis, Dacryodes edulis, Alstonia boonei and Lophira alata (Figure 3). In the CAFS, Elaeis guineensis and Dacryodes edulis had a good contribution to carbon storage in general due to their high abundance. They are indeed the two most abundant species with 56.47% and 16.23% of individuals respectively. The three other species (Milicia excelsa, Alstonia boonei and Lophira alata) have a good contribution to carbon sequestration due to their large size and high wood density, and also because they are among the most efficient species (Table 7).
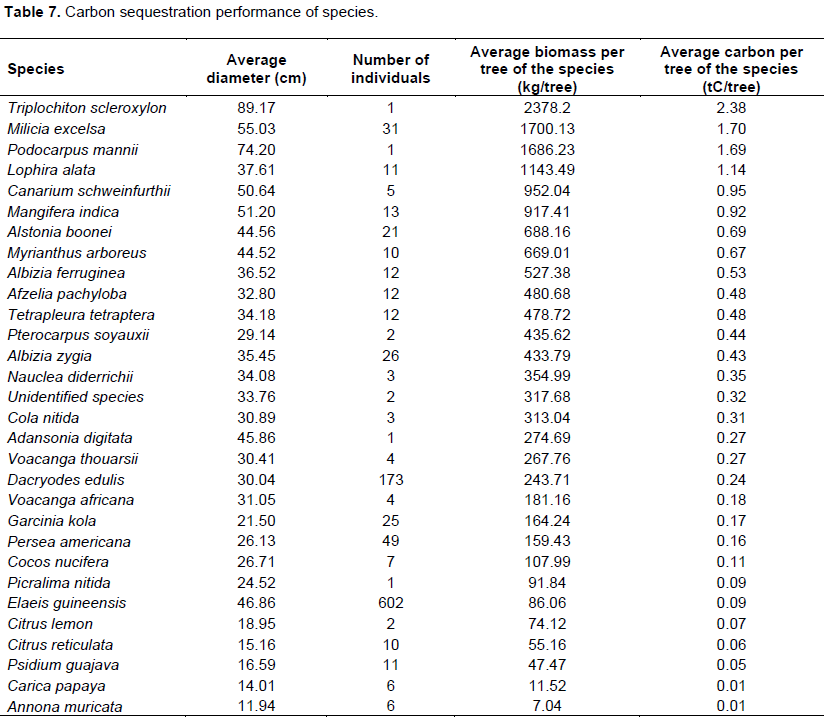
Carbon sequestration performance was evaluated based on the average amount of carbon stored by a tree of the species. From Table 7, it can be seen that the best performing species were Triplochiton scleroxylon, Milicia excelsa, Podocarpus mannii, Lophira alata and Canarium schweinfurthii, which are mostly secondary forest species that are conserved at the time of setting up the coffee plantation. Efficient species accumulated high average carbon per tree due to high specific wood densities (Milicia excelsa and Lophira alata) or relatively large size (Triplochiton scleroxylon, Podocarpus mannii, Alstonia boonei, Canarium schweinfurthii and Mangifera indica). Majority of non-forest species planted by farmers stored low average amounts of carbon per tree (Elaies guineensis, Persea americana, Citrus reticulata, Psidium guajava, Carica papaya and Annona muricata).
DISCUSSION
Floristic richness and diversity
A total of 30 woody species belonging to 19 families were recorded in the coffee agroforestry systems of Kekem. In the natural forest, 30 species belonging to 15 families were identified. The species richness of CAFS is similar to that of 30 species and 16 families found by Manga et al. (2013) in the western highlands of Cameroon. This similarity can be explained by the fact that these two study areas are ecologically close. However, this richness is lower than that of 44 species found by Dallière and Dounias (1999) in the CAFS in Central region of Cameroon. It is also lower than those found in other parts of the world: 47 species found by Richard and Mendez (2014), 91 species found by Tadesse et al. (2014a) and 138 species found by Koda et al. (2019) for smallholder coffee systems in El Salvador, Ethiopia and Togo respectively. This difference can be explained by the endogenous knowledge and cultural practices of these peoples and more technological itinerary adopted in establishing these coffee agroforestry systems (Mapongmetsem, 2017). In the study area, farmers conserve or introduce into their coffee farms, only trees species that are really useful to them and eliminate unnecessary ones, this choice being guided by the socio-economic and ecological benefits of the species.
The Shannon-Weaver diversity index (H’) in CAFS ranged from 0.48 to 2.16 with a mean of 1.61, reflecting low diversity. The low diversity was also confirmed by a Simpson’s diversity index of 0.62. The low Pielou evenness (0.45) obtained show a low distribution of individuals within species due to the fact that E. guineensis was the dominant species. The Shannon index of CAFS in the study site was very low compared to the values of 3.5 and 4.06 recorded respectively by Tadesse et al. (2014a) in Ethiopia and Koda et al. (2019) in Togo. This difference can be explained by the fact that associated trees in Kekem are highly selected to leave just a few species that are really useful to farmers. Of the 30 species identified in the natural forest which was the control, 18 were found in agroforestry systems, representing a species conservation rate of 60%. This may be justiï¬ed by the fact that during the establishment and evolution over time of the coffee plantations, the farmers are able to conserve forest species that have both socio-economic and environmental beneï¬ts to coffee and households. However this figure should be put into perspective, because taken separately, the rate of species conservation varies significantly between villages. In Fonjomonko, CAFS share only 3 species (10%) in common with the natural forest while in Kekem center, they share in common 14 species (46.67%). Among the trees species found in CAFS, four are considered vulnerable (Afzelia pachyloba, Garcinia kola, Lophira alata, Nauclea diderrichii) and one is near threatened (Milicia excelsa) according to the IUCN Red List (2019). We found that conversion of forests to coffee agroforestry systems resulted in a loss of at least 40% of forest-based woody species. This loss is close to the 34% loss found by Tadesse et al. (2014a) in Ethiopia but is lower than the 54% loss by Mbolo et al. (2016) in cocoa agroforestry systems in central region of Cameroon.
Despite this loss, for income diversification purposes, farmers replace some native forest trees with species that are useful to them. Thus, 12 species that are not found in natural forest were identified in the CAFS. It was observed that the choice of conserving or introducing trees in the CAFS is guided by their uses, but also by the market opportunities available to farmers. Thus, in order to fill the gaps in coffee production or to keep the inflow of agricultural income constant, these farmers are shaping their farm by prioritizing the conservation/introduction of trees whose fruits or products will be consumed by family or sold. Priority is given to species of high socio-economic value and to those whose planting and regeneration techniques are mastered by farmers. This concerns trees that produce edible fruits and that are usually planted by farmers (Citrus reticulata, Dacryodes edulis, Elaeis guineensis, Persea americana, Mangifera indica, Garcinia kola, Psydium guajava and Annona muricata). The species useful for wood and shade are those that are most often conserved at the time the plantation is established, and are also species found in the adjacent forest (Milicia excelsa, Lophira alata, Albizia ferruginea, Nauclea diderrichii, Pterocarpus soyauxii, Albizia zygia, Afzelia pachyloba).
In addition to shading, four other uses were mentioned by the coffee farmers which were:medicine, wood, fruit production and palm oil production. The latter use is provided by Elaeis guineensis which was the most abundant species found in the CAFS in the study area. In the Western Highlands of Cameroon, Manga et al. (2013) found that Persea americana was the most abundant species while E. guineensis was the least abundant. This difference can be explained by the proximity of the study area to the Littoral region, which is one of the main production basins of oil palm in Cameroon and is an important source of income for smallholders (Ndjogui et al., 2014).
Structure of coffee agroforestry systems and forest
The average tree density found in CAFS was133 ± 24 stems/ha and was equivalent to about 38.5% of the tree density in the adjacent secondary forest (345 ± 28 stems/ha). The tree density in CAFS is similar to the 108 ± 59 stems/ha recorded by Goodall et al. (2015) in San Ramon in Nicaragua; and is lower than the 207 stems/ha and 246.38 stems/ha recorded by Tadesse et al. (2014a) and Koda et al. (2019)in smallholder coffee systems in southwest Ethiopia and Togo respectively. The basal area of associated trees in CAFS (15 m2/ha) fell within the range of 11 to 16 m2/ha found by Manga et al. (2013), but was smaller than those of 54.5 and 27.99 m2/ha found by Tadesse et al. (2014a) and Koda et al. (2019) respectively. This difference can be explained by much higher stem densities in the study sites of the latter authors than in ours.
In CAFS, size class distribution of stems followed a bell-shaped curve indicating a regeneration deficit with the largest numbers of stems concentrated above 35 cm. This could be due to the selective removal of saplings by coffee farmers or a non-renewal of big trees. This distribution is similar to that described in coffee agroforestry systems in Highlands of Western Cameroon by Manga et al. (2013), but is different to the J-inverted distribution observed in Guinea (Correia et al., 2010), in Ethiopia (Denu et al., 2016) and in Togo (Koda et al., 2019).
Carbon sequestration potential
The amount of carbon stock in CAFS was about 24.28tC/ha on average. This value fell within the low end of the range of 12 to 228 tC/ha reported by Albrecht and Kandji (2003) for tropical agroforestry systems, and is similar to the value of 24.4 tC/ha reported in CAFS in El Salvador by Richards and Mendez (2014). However this value is less than the average carbon stock reported for comparable carbon poolsin CAFS in other parts of the world. For example, Schmitt-Harsh et al. (2012) found 83.39 tC/ha in western highlands of Guatemala; Goodall et al. (2015) found 49.25 tC/hain Nicaragua; Denu et al. (2016) and Tadesse et al. (2014b) reported respectively 61.5 tC/ha and 153 tC/ha in southwest Ethiopia; and Zaro et al. (2019) recorded a carbon stock of 75.80 tC/ha in CAFS with rubber trees in southern Brazil. These disparities recorded by several similar studies may be related to the fact that the studies were carried out in different areas with different climatic and ecological conditions and, as such, the wood density, the species as well as the stem densities of trees associated with coffee varied. In the study area the most abundant species with an overall relative abundance of 56.47% and an IVI of 169.96% was E. guineensis which, because of its very low wood density do not contribute to carbon sequestration the same way as forest species.
The carbon stock of the natural forest has been estimated at 235.88tC/ha. The average carbon stock on CAFS represents about 10.30% of the average amount of carbon stored by the adjacent forest. The difference in carbon sequestration between CAFS and forest is due to the high stem density, wood density and diameter of trees found in the forest. In agroforestry systems, the most abundant species was E. guineensis. Despite the fact that this species had a very high abundance compared to other species, it had a low performance interms of carbon sequestration, that is, only 0.09 tC/tree.The best performing species were Triplochyton scleroxylon, Milicia excelsa, Podocarpus latifolius, Lophira alata and Canarium schweinfurthii. However these species had low abundance (only 1, 31, 1,11 and 5 individuals respectively).
The 10.30% of carbon stored by CAFS compared to natural forest is smaller than the 75, 62 and 52% reported in Ethiopia by Denu et al. (2016), Tadesse et al. (2014b) and Vanderhaegen et al. (2015) respectively. This great difference is mainly due to the less abundance of carbon sequestration efficient species in CAFS of the study area. Although CAFS stock less carbon than the forest, they represent one of the most diverse farming systems and agroforestry trees can still store more carbon than other cropping systems (Kirby and Potvin, 2007).
With an average offset price of $3.2 per ton of CO2 from voluntary carbon markets (Ecosystem Marketplace, 2019), the amount of carbon stored in CAFS in Kekem could enable farmers to earn an additional $294/ha. However, these figures could even be higher if all the carbon pools, particularly litter and soil organic carbon were taken into consideration. These amounts of money may afford an opportunity for coffee farmers to manage such systems for greater carbon sequestration. Thus, payment for environmental services mechanism would promote climate mitigation and adaptation benefits in addition to its socio-economic and ecological benefits if CAFS are integrated into conservation. In fact, the farmers’ perception of climate change in the area is very real and in order to adapt to these changes, they are increasingly opting not only for the diversification of crops, but also of cropping systems, the collection and marketing of non-timber forest products in addition to the benefits brought by coffee plants (Mapongmetsem, 2017). This opportunity of payment of carbon credit would encourage the conservation and planting of trees and would reduce the observed tendency of conversion of CAFS to other cropland by farmers in the study area with the drop in coffee prices.
CONCLUSION
Significant differences were recorded between coffee agroforestry systems and the forest in terms of diversity, tree density and carbon stock. Although tree density is much higher in the forest, CAFS contributed significantly to the conservation of woody species because they share in common 60% of the species with the forest. In CAFS, some forest species were being replaced with non-forest species that are useful and can contribute to income generation and farmers’ livelihood. Farmers have mainly oriented their coffee farms towards diversification of production. As a result, the associated trees are mainly introduced/conserved for fruit production, palm oil production and the needed shade for coffee trees. Compared to forests, CAFS contributed little to carbon storage because the more abundant trees were less efficient in terms of carbon storage. However, the amount of carbon stored remains higher than in other non-agroforestry cropping systems. The ecological service linked to carbon sequestration and wood diversity conservation offers a possibility of financial benefits in case of payment for ecosystem services. To farmers, this would then not only raise awareness of climate change and the need for conservation, but would also contribute to the improvement of their livelihood. Farmers should been couraged to plant/conserve more tree species that are useful but also have good carbon sequestration potential.
CONFLICT OF INTERESTS
The authors have not declared any conflict of interests.
REFERENCES
|
Aguaron E, McPherson EG (2012). Comparison of methods for estimating carbon dioxide storage by Sacramento's urban forest. In: Lal R and Augustin B (Eds), Carbon sequestration in urban ecosystems. Spinger, New York USA. |
|
|
Albrecht A, Kandji ST (2003). Carbon sequestration in tropical agroforestry systems. Agriculture, Ecosystems and Environment 99(3):15-27. |
|
|
Atangana A, Khasa D, Chang S, Degrande A (2014). Tropical agroforestry.Springer, Dordrecht Netherlands. |
|
|
Bukomeko H, Jassogne L, Balaba S, Eilu G, Vaast P (2019). Integrating local knowledge with tree diversity analyses to optimize on-farm tree species composition for ecosystem service delivery in coffee agroforestry systems of Uganda. Agroforestry Systems 93(2):755-770 |
|
|
Chave J, Réjou-Méchain M, Búrquez A, Chidumayo E, Colgan MS, Delitti WBC, Duque A, Eid T, Fearnside PM, Goodman RC, Henry M, Martínez-Yrízar A, Mugasha W (2014). Improved allometric models to estimate the aboveground biomass of tropical trees.Global Change Biology 20:3177-3190. |
|
|
Correia M, Diabaté M, Beavogui P, Guilavogui K, Lamanda N, de Foresta H (2010). Conserving forest tree diversity in GuinéeForestière (Guinea, West Africa): the role of coffee-based agroforests. Biodiversity and Conservation 19(6):1725-1747. |
|
|
Curtis JT, McIntosh RP (1950). The interrelations of certain analytic and synthetic of phytosociological characters.Ecology 31:434-455. |
|
|
Dalliere C, Dounias E (1999). Agroforêts caféières et cacaoyères des Tikar (Cameroun central), structures, dynamiques et alternatives de développement. Nasi R, Amsallem I, Drouineau S (Eds) La gestion durable des forêts denses africaines aujourd'hui. Séminaire Forafri 12-16 octobre 1998. Libreville Gabon. |
|
|
Danais M (1982). La diversité en écologie : Analyse bibliographique. BotanicaRhedonica 17:77-104. |
|
|
De Beenhouwer M, Geeraert L, Mertens J, Van Geel M, Aerts R, Vanderhaegen K, Honnay O (2016). Biodiversity and carbon storage co-benefits of coffee agroforestry across a gradient of increasing management intensity in the SW Ethiopian highlands. Agriculture Ecosystem and Environment 222:193-199. |
|
|
Denu D, Platts PJ, Kelbessa E, Tadesse WG, Marchant R (2016). The role of traditional coffee management in forest conservation and carbon storage in the Jimma Highlands, Ethiopia. Forests Trees and Livelihoods 25(4):226-238. |
|
|
Ecosystem Marketplace (2019).Financing emission reductions for the future: State of voluntary carbon markets 2019.Washington DC: Forest Trends. |
|
|
EtchikéDAB, Mapongmetsem PM, Ngassoum MB (2017). Phytodiversité et stock de carbone dans les agroforêts du Mbam et Inoubou au Cameroun. Cameroon Forum for Biological Sciences 11(01):9-22. |
|
|
FAO (2010). Climate-smart agriculture policies, practices and financing for food security, Adaptation and Mitigation. Food and Agricultural Organization of the United Nations, Rome. |
|
|
FAO (2016).Global forest resource assessment 2015. How are the world's forests changing? Second edition. Food and Agricultural Organization of the United Nations, Rome. |
|
|
FAO (2019).FAOSTAT Data (accessed 11.02.2020). |
|
|
Favrichon V, Gourlet-Fleury S, Bar-Hen A, Dessard H (1998).Parcelles permanentes de recherche en forêt dense tropicale humide, Eléments pour une méthodologie d'analyse des données. Série Forafri 1998. Document nº14. CIRAD. |
|
|
Garrity D, Akinnifesi F, Ajayi O, Weldesemayat S, Mowo J, Kalinganire A, Larwanou M, Bayala J (2010). Evergreen agriculture: a robust approach to sustainable food security in Africa. Food Security 2(3):197-214. |
|
|
Geist HJ, Lambin EF (2002).Proximate causes and underlying driving forces of tropical deforestation. BioScience 52:143-150. |
|
|
Goodall KE, Bacon CM, Mendez VE (2015). Shade tree diversity, carbon sequestration, and epiphyte presence in coffee agroecosystems: A decade of smallholder management in San Ramon, Nicaragua. Agriculture Ecosystems and Environment 199:200-206. |
|
|
Guétat-Bernard H (2008). Cultures du café et dynamiques des rapports de genre en pays Bamiléké au Cameroun : effet de similitude avec la situation kikuyu au Kenya. Les Cahiers d'Outre-Mer 243. |
|
|
Häger A (2012). The effects of management and plant diversity on carbon storage in coffee agroforestry systems in Costa Rica. Agroforestry Systems 86(2)159-174. |
|
|
Hairiah K, Dewi S, Agus F, Velarde S, Ekadinata A, Rahayu S, Van Noordwijk M (2011). Measuring carbon stocks across land use systems: A Manual. World Agroforestry Centre (ICRAF), SEA Regional Office. Bogor, Indonesia. |
|
|
Hergoualc'h K, Blanchart E, Skiba U, Hénault C, Harmand JM (2012). Changes in carbon stock and greenhouse gas balance in a coffee (Coffeaarabica) monoculture versus an agroforestry system with Inga densiflora, in Costa Rica. Agriculture Ecosystems and Environment 148:102-110. |
|
|
IPCC (2006).Guidelines for national greenhouse gasinventories. In: Eggleston HS, Buendia L, Miwa K, Ngara T, Tanabe K (Eds). Guidelines for national greenhouse gasinventory: agriculture, forestry and other land-use. IGES. Japan. |
|
|
IPCC (2014).Summary for policymakers. In: Field CB, Barros VR, Dokken DJ, Mach KJ, Mastrandrea MD, Bilir TE, Chatterjee M, Ebi KL, Estrada YO, Genova RC (Eds). Climate change 2014: impacts, adaptation, and vulnerability. Cambridge University Press. Cambridge. |
|
|
IUCN (2019). The IUCN Red List of threatened species. Version 2019-2. |
|
|
Kankeu F, Kaffo C (2012). Faillite de la caféiculture comme moteur du développement local à l'Ouest Cameroun : leçons à tirer de trois décennies d'encadrement coopératif du monde rural (1960-1990). In Tsalefac M., Kamdem P. (Eds): Les mutations socio-spatiales au Cameroun. IRESMA, Yaoundé. |
|
|
Kent M, Coker P (1992). Vegetation description and analysis: A practical approach. John Wiley and Sons Ltd. England. |
|
|
Kirby KR, Potvin C (2007). Variation in carbon storage among tree species: implications for the management of a small-scale carbon sink project. Forest Ecology and Management 246:208-221. |
|
|
Koda DK, Chérif M, Adjossou K, Amégnaglo KB, Diwediga B, Agbodan KML, Guelly AK (2019). Typology of coffee-based agroforestry systems in the semi-deciduous forest zone of Togo (West Africa). International Journal of Biodiversity and Conservation 11(7):199-211. |
|
|
Lasco RD, Delfino RJP, Espaldon MLO (2014). Agroforestry systems: helping smallholders adapt to climate risks while mitigating climate change. Wiley Interdisciplinary Reviews: Climate Change 5(6):825-833. |
|
|
Lebrun JP, Stork AL (1991, 1992, 1995, 1997). Enumération des plantes à fleur d'Afrique tropicale, 4 Vols. Genève, Conservatoire et Jardin botaniques de la ville de Genève. |
|
|
Locatelli B, Kanninen M, Brockhaus M, Colfer CJP, Murdiyarso D, Santoso H (2008). Face à un avenir incertain : Comment les forêts et les populations peuvent s'adapter au changement climatique. Regards sur la forêt No 5 CIFOR, Bogor, Indonesia. |
|
|
Manga MA, Akoa A, Abolo D, Mbang AA, Bedimo JM, Bidzanga NL, Akume ND (2013). Structure et composition floristiques des agroforêts à base de caféiers arabica (Coffea arabica L.) dans les hauts plateaux de l'Ouest du Cameroun. International Journal of Biological and Chemical Sciences 7(4):1474-1489. |
|
|
Mapongmetsem PM (2017). Domestication et culture des espèces d'intérêt socio-économique au Cameroun. Leçon inaugurale aux Doctoriales 2017. Univiversité de Ngaoundéré, Cameroun. Excellence Plus (éd.), 47p. |
|
|
Mapongmetsem PM, Dong Etchiké AB, Ngassoum MB (2016). Conservation et valorisation de la biodiversité dans les agroforêts dans la zone périurbaine de Bafia (Région du Centre au Cameroun). Revue Scientifiques et techniques Forêts et Environnement du Bassin du Congo 6 :60-69. |
|
|
Mbolo AM, Zekeng JC, Mala AW, Fobane JL, Chimi DC, Nyako MC, Tamandjong V (2016). The role of Cocoa agroforestry in conserving forest tree diversity in Central Region of Cameroon. Agroforestry Systems 90(4):577-590. |
|
|
Mori SA, Boom BM, Carvalhode AM, Dos Santos TS (1983). Ecological importance of Myrtaceae in an eastern Brazilian west forest.Biotropica 15(1):68-70. |
|
|
Ndjogui TE, Nkongho RN, Rafflegeau S, Feintrenie L, Levang P (2014). Historique du secteur palmier à huile au Cameroun. Document occasionnel 109. CIFOR, Bogor, Indonesia. |
|
|
Ogouwalé E (2006). Changements climatiques dans le Bénin méridional et central : indicateurs, scénarios et prospective de la sécurité alimentaire. Cotonou: Thèse de Doctorat, Universitéd'AbomeyCalavi. |
|
|
Perfecto I, Vandermeer J, Mas A, Soto-Pinto L (2005).Biodiversity, yield, and shade coffee certification.Ecological Economics 54(4):435-446. |
|
|
PNDP (2013). Plan communal de développement de Kekem. PNDP/Commune de Kekem. |
|
|
Richards MB, Mendez VE (2014). Interactions between carbon sequestration and shade tree diversity in a smallholder coffee cooperative in El Salvador. Conservation Biology 28(2):489-497. |
|
|
Schmitt-Harsh M, Evans TP, Castellanos E, Randolph JC (2012). Carbon stocks in coffee agroforests and mixed dry tropical forests in the western highlands of Guatemala. Agroforestry Systems 86:141-157. |
|
|
Tadesse G, Zavaleta E, Shennan C (2014b). Effects of land-use changes on woody species distribution and above-ground carbon storage of forest-coffee systems. Agriculture Ecosystems and Environment 197:21-30. |
|
|
Tadesse G, Zavaleta E, Shennan C (2014a). Coffee landscapes as refugia for native woody biodiversity as forest loss continues in southwest Ethiopia. Biological Conservation169:384-391. |
|
|
Takimoto A, Nair PKR, Nair VD (2008). Carbon stock and sequestration potential of traditional and improved agroforestry systems in the West African Sahel. Agriculture,Ecosystems and Environment. 125(1-4):159-166. |
|
|
Vanderhaegen K, Verbist B, Hundera K, Muys B (2015). REALU vs. REDD+: Carbon and biodiversity in the Afromontane landscapes of SW Ethiopia. Forest Ecology and Management 343:22-33. |
|
|
Vivien J, Faure JJ (2012). Arbres des forêts denses d'Afrique centrale. Espèces du Cameroun. NguilaKerou, France. |
|
|
Zaro GC, Caramori PH, Yada JGM, Sanquetta CR, AndrocioliFilho A, Nunes ALP, Prete CEC, Voroney P (2019). Carbon sequestration in an agroforestry system of coffee with rubber trees compared to open-grown coffee in southern Brazil. Agroforestry Systems. |
|
Copyright © 2024 Author(s) retain the copyright of this article.
This article is published under the terms of the Creative Commons Attribution License 4.0


