Full Length Research Paper

ABSTRACT
Clinacanthus nutans is an economically important medicinal plant that can be found grown in many countries in the Asian region. Useful medicine properties such as anti-cancer, anti-bacteria, and anti-viral, backed by its high content of phytochemical compounds such vitexin, isovitexin, stigmasterol and lupeol has increased the demand for C. nutans in the market. Extensive work had been carried out on its content and pharmacological activity using fresh samples but limited studies for in vitro cultures of C. nutans. No genome size estimation has been done for C. nutans. Objective of this study was to analyse nuclear DNA content of C. nutans using flow cytometry. Preparation of different nuclei isolation buffer and stoichiometric DNA staining using propidium iodide was carried out. The genome size of C. nutans was estimated using Glycine max cv. Polanka as internal standard and its genome size was compared with in vitro plantlets of C. nutans. Flow cytometry analysis revealed that nuclear 2C DNA of C. nutans content is estimated at 1.75 ± 0.006 pg. Coefficient of variation in flow cytometric analysis was within the limit of 5% implying that the results were reliable with the Tris.MgCl2 being the best nuclei isolation buffer. No significant difference was observed from field grown and in vitro C. nutans. This finding will assist further in genome size evolution analysis of Clinacanthus spp. and to determine polyploids for increased active compounds and biomass.
Key word: Flow cytometry; Nuclear DNA content, Clinacanthus nutans.
INTRODUCTION
Clinacanthus nutans, also known as Sabah Snake Grass or Daun Belalai Gajah is a shrub belonging to the Acanthaceae family. This plant has recently gained much economic value in South Asian region mainly in Malaysia, Indonesia, and Thailand due to its pharmacological properties (Zulkipli et al., 2017). Its secondary content, rich in phytochemicals such as betulin, lupeol, vitexin, isovitexin and stigmasterol are beneficial to mankind. Based on the active compounds, pharmacological activities such as anti-oxidative (Pannangpetch et al., 2007; Arullappan et al., 2014), anti-proliferative (Yong et al., 2013; Ghazemzadeh et al., 2014), anti-tumorigenic (Huang et al., 2015), anti- bacterial (Chomnawang et al., 2009; Arullappan et al., 2014), anti-viral (Kunsorn et al., 2013) and anti-inflammatory (Wanikiat et al., 2008) have been reported with C. nutans. Owing to the growing demand, conventional propagation methods through stem cutting and micropropagation have been proposed as an alternative way to cultivate this plant commercially. In line to that, a few in vitro protocols since then had been established and explored (Chen et al., 2015; Haida et al., 2020). Besides cultivation, field management, clone selection and polyploidization are being constantly explored to cater the growing demand.
Knowledge of nuclear DNA content, both size and molecular details have become essential in determining genetic evolution of plants besides gaining a better understanding at molecular and cellular level (Yan et al., 2016). Since the report of Lilium longiflorum genome size (Ogur et al., 1951), more than 12,200 plant species genomes have been estimated (Pellicer and Leitch, 2014). Genome size refers to its nuclear DNA content in a cell and is measured in picograms (pg) or megabase pairs (Mbp, 1 pg = 987 Mbp) (Dolezel et al., 2003). Estimation of genome size is crucial in many biological fields such as evolution, ecology, population genetics and plant breeding (Kron et al., 2007; Loureiro et al., 2010). Its size change is associated with environmental factors, climatic variation, and geographical plant distribution (Bennett, 1976; Levin and Funderburg, 1979) and (Ohri and Khoshoo, 1986). Continuous subculturing of plantlets in in vitro may lead to genetic disturbance and cause somaclonal variation (Sliwinska and Thiem, 2007). It is crucial to ensure genome stability in in vitro plantlets especially medicinal plant such as C. nutans that is highly sort after for its pharmaco-properties. Moreover, limited studies have evaluated the effect of in-vitro conditions on genome size.
Genome size evaluation is constantly being optimized both at the process level as well as use of improved instruments. The estimate of genome size in plants started with Feulgen densitometry (Bennett and Leitch,1997) and re-association kinetics (Dhillon et al., 1980) followed by the popular flow cytometry (FCM) (Dolezel et al., 2007). The FCM requires a small quantity of sample and can analyse many cells in a shorter time with higher precision compared to other spectrophotometry approaches (Moghbel et al., 2015; Dhooghe et al., 2010; Omidbaigi et al., 2010).
However, the accuracy of FCM in some plants was subjected to the presence of endogenous fluorescence inhibitors such as tannins (Loureiro et al., 2006) and anthocyanins (Bennett et al., 2008). This demands the need to optimize Galbraith et al. (1983) simple method of plant nuclei isolation technique, chopped leaf tissues in a lysis buffer. The selection of appropriate nuclei isolation buffer according to the plant and inhibitors present is considered crucial in genome size determination. As the appropriate buffer ascertains the quality of the sample maintained and stoichiometric errors during DNA staining (Sadhu et al., 2016). Among the common buffer used in nuclear DNA estimation in plants are Galbraith buffer (Galbraith et al., 1983), LBO1 buffer (Dolezel et al., 1989), Otto buffer (Otto, 1990; Dolezel and Gohde, 1995), Tris.MgCl2 buffer (Pfosser et al., 1995) and Tris.MgCl2 with 1% PVP (Dolezel et al., 1989). Although the chemical component of the mentioned buffers varies, each of the nuclei isolation buffer contains an organic pH-stabilizing chemical such as MOPS, TRIS or HEPES, chromatin stabilizers such as MgCl2, MgSO4 or Spermine, and divalent cation binding metal chelators such as EDTA or sodium citrate as nuclease cofactors. Inorganic salts such as KCl or NaCl are also added to attain proper ionic concentration and non-ionic detergents such a Triton X-100 or Tween 20 which further aid in releasing nuclei and remove debris from the surface of the nuclei (Coba and Brown, 2001).
Studies have reported that concurrent evaluation of both target plants and standards, use of internal and external standards (Price et al., 2000; Noirot et al., 2005), use of appropriate nuclei isolation buffer and addition of anti-oxidative compounds (Dolezel and Bartos, 2005; Dolezel et al., 2007) reduces experimental error. The genome size is reflected and estimated based on known DNA content that act as standards. Plants such as Solanum lycopersicum L. Stupicke polni rane (2C DNA content = 1.96 pg), Glycine max Merr. Polanka (2C DNA content = 2.50 pg), Zea mays.L. CE-777 (2CDNA content = 5.43 pg) and Pisum sativum. L. Citrad (2C DNA content = 9.09 pg) (Dolezel et al., 2007) are commonly used as an estimator or standard to estimate the sample plant genome size. It is recommended that the standard should have a genome size close to target plant species (Dolezel et al., 1998).
No genome size estimation had been carried out for C. nutans which is highly sort after for its medicinal values as this can help in further exploration of clone selection and polyploidization sector to enhance active compounds. At present, to cater the growing demand, stem cutting has been the propagation method used to cultivate this valuable medicinal plant which could soon lead to extinction (Zulkipli et al., 2017). Besides, genetic disturbance and somaclonal variation is reported in in vitro cultures (Sliwinska and Thiem, 2007). Therefore, this study explores the impact varying nuclei isolation buffer to determine the genome size of C. nutans besides determining the variation, if any, in in vitro grown and field grown plants using laser sourced flow cytometer (BD Accuri C6) along with Glycine max cv. Polanka (Dolezel et al., 1992) as an internal standard.
MATERIALS AND METHODS
Plant materials
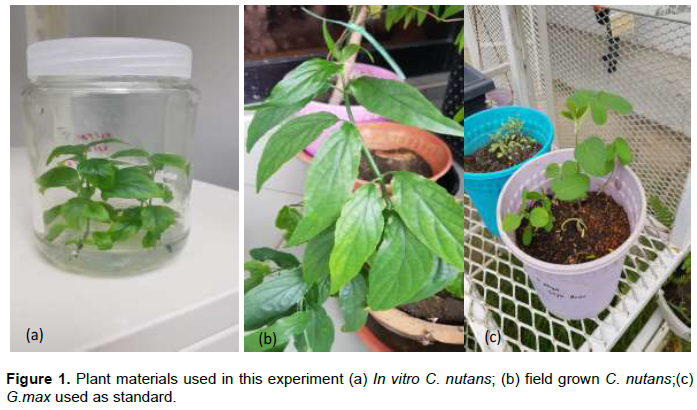
Plant material for field grown C. nutans was obtained from the medicinal plant garden, at the Forest Research Institute Malaysia (FRIM), Kepong, Selangor, with identity confirmed by the FRIM’s botanist, at the Ethnobotanical Department. These samples were collected in the month of September 2017, and grown in pots, at Taylor’s Garden, and thereafter explants were collected to establish in vitro culture. Both, field grown C. nutans and standard plant were grown under similar condition at the greenhouse or in vitro. Greenhouse plants were grown in 30 cm pots under natural light source at Taylor’s Garden. Glycine max cv. Polanka (2C DNA content = 2.50 pg) was chosen as the standard reference as its genome size was larger than of the target sample. Seeds of G. max was obtained from Cytogenetic lab, MPOB (Malaysian Palm Oil Board) which was procured from Dr. Jaroslav Dolezel, Institute of Botany, Olomouc, Czech Republic. The ambient growth room condition of 25± 2°C and 60 to 65% relative humidity, at 12 h photoperiod, with light intensity at 3000 lux were maintained for in vitro grown C. nutans cultures in Plant Tissue Culture room at Taylor’s University. These plantlets were sub-cultured every 8 weeks using nodal cutting approach. The samples used for analyses were maintained for a duration of over two years (Figure 1).
Sample preparation
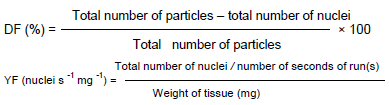
Plant samples (C. nutans) and standards (G. max) were selected randomly for nuclei isolation using different isolation buffer and genome size evaluation with FCM. Three nuclei extraction buffer were prepared according to modified procedure from Dolezel et al. (1989), first being Tris.MgCl2 containing 200 mM Tris, 4 mM MgCl2. 6H2O, 0.5% (v/v) Triton X-100 and 1% PVP (Dolezel et al., 1989), LBO1 buffer containing 15 mM Tris, 2 mM Na2EDTA, 80 mM KCL,20 mM NaCl, 0.5 mM spermine,15 mM β-mercaptoethanol, 0.1% Triton X-100, pH 7.4) (Dolezel et al., 1989) and Otto buffer comprising of Otto I (0.1 M citric acid and 0.5% (v/v) Tween 20; pH 2 to 3) and Otto II (0.4 M Na2HPO4⋅12H2O; pH 8-9) (Otto, 1990). Fully formed young leaf from sample and standard was excised. Each sample, weighing approximately 30 to 50 mg were placed on ice cold 6 mm petri dish to decrease the nuclease activity and was chopped into tiny segments (0.5 to 1.0 mm) in 1 ml of ice-cold buffer using a sharp clean razor blade (Treet Corporation Ltd) to form a homogenate. About 500 µl of the homogenate was then pipetted out and filtered through a 40 µm nylon mesh (Fisher Scientific) into a 1.5 ml microcentrifuge tube to remove cell fragments and large debris. The filtrate was then added with 2.5 µl of RNase (10 mg/ml; Sigma-Aldrich) to denature RNA and 25 µl of Propidium iodide (1 mg/ml; Sigma-Aldrich) to stain the DNA. Final concentration of propidium iodide was maintained at 50 µg/ml. Samples and standard were incubated on ice in the dark for 30 min prior to analyse with flow cytometer. Four replicates were carried out for each buffer on different days and debris factor and yield factor were calculated based on the formula as below (Loureiro et al., 2007):
Flow cytometric analysis
Estimation of nuclear DNA content was performed using BD Accuri TM C6 flow cytometer. Samples and standard were stained with propidium iodide and were excited at 488 nm with 20-mW laser illumination. The fluorescence signal also known as the pulse area measurement was screened using two different filters. FL2 with a 585/40 nm bandpass filter was used for propidium iodide-stained nuclear DNA content. Auto fluorescence due to chloroplast was excluded from the analysis by selecting a region using FL3 (670 nm long pass filter). Flow rate was kept constant at low pace (14 µl sample per minute) throughout the experiment and a run time for each sample was approximately 3 to 5 min. Each sample, at least 5000 nuclei were evaluated.
Resolution, linearity, and doublet discrimination capability of the instrument was evaluated using Accuri C6 DNA QC Particles Kits which includes the usage of chicken erythrocyte nuclei (CEN) and cow thymocyte (CTN) as 8 beads and 6 beads. This was carried out prior to running the samples and the standard. The nuclei were gated to obtain a region around the signals due to intact single nuclei and to eliminate the background fluorescence due to debris, fragmented DNA and auto-fluorescence from chlorophyll. The gate was consistently maintained across all the samples during the run using FCM. Histogram was plotted to compare median fluorescence intensity (MFI) of the peaks derived from the sample and standard used as external and internal. The DNA content per cell is proportional to the fluorescence intensity of PI measured by the flow cytometry (Yan et al., 2016). Therefore, the 2C DNA content was calculated based on the value of fluorescence intensity of the peaks for both sample and standard based on the calculation as below (Dolezel et al., 2007):

(MFI: Mean fluorescence intensity)
Presence of inhibitors
Test sample and standard were chopped together to assess the presence of inhibitors in the C. nutans. This is due to the presence of phenolic compounds in the cytosol of plants that inhibits the propidium fluorescence. Therefore, it is required to test for inhibitors for all sample plants that are run using FCM to determine the nuclear DNA content (Price et al., 2000). Presence of inhibitors are confirmed if the mean peak position of the standard plant is lower in the presence of the target sample compared to the mean of the standard plant chopped alone. In this experiment, the sample and standard were examined separately and chopped together and processed as one sample.
Data analysis
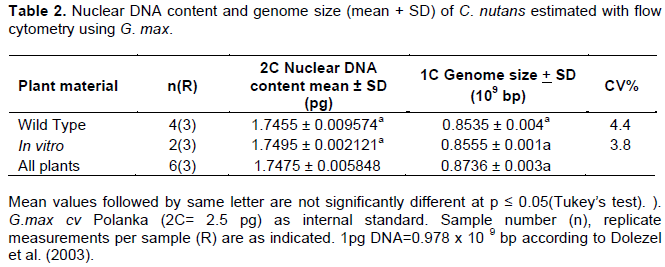
Total of four replicates from C. nutans were examined using the three buffers (Tris.MgCl2, LBO1 and Otto buffer). Each replicate was run on different days. For genome size estimation, total of six C. nutans plants were analysed with four from wild type C. nutans and the other two in vitro propagated C. nutans plantlets. Each plant sample was analysed in triplicates with each replicate being performed on different days. In all the experiments, the fluorescence of at least 5000 nuclei to 10000 nuclei was measured. Conversion from picograms (pg) to base pair numbers was done as follows: 1 pg DNA is equivalent to 0.978 × 10⁹ bp (Dolezel et al., 2007). The results were analysed using one way analysis of variance (ANOVA) using SPSS version 25. For significant effect, Tukey’s pairwise comparison was carried out with p value ≤ 0.05..
RESULTS
Comparative analysis of different buffers
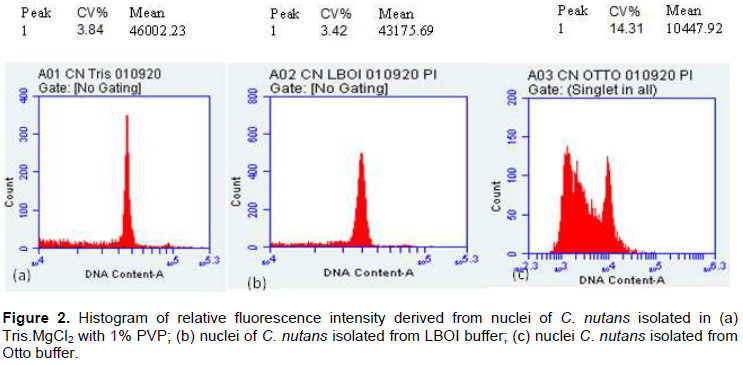
The choice of nuclei isolation buffer is a crucial step in genome size estimation in plants. Three different buffers were examined here for C. nutans as these three buffers (Tris.MgCl2, LBO1 and Otto buffer) differ in their ingredients to extract the nuclei from the plant. The effectiveness of these buffers in C. nutans nuclei isolation is presented in Figure 2. It is seen, Tris.MgCl2 with 1% PVP buffer (a) and LBO1 buffer (b) shows low CV value compared to Otto buffer (c) and with a narrower peak. The result also shows that no noticeable nuclear aggregation particles was seen in FCM histogram of nuclei suspension extracted using Tris.MgCl2 (a) and LBO1 buffer (b). However, Otto buffer (c) showed cell clumping and increased CV value (≥ 5%) plus relatively higher variance in mean fluorescence intensity in all the replicates.
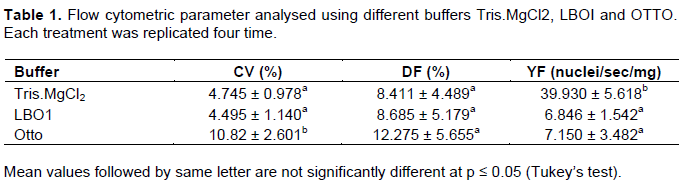
The efficacy of the buffers was further evaluated based on the calculation obtained from a combination of high yield factor (YF), low debris factor and low CV (%) peaks (Table 1). Based on the FCM analysis of C. nutans, there was no significant difference between the debris factor in all three-buffer tested. No significant variation too was seen with total number or particles, total number of singlet nuclei and the weight of the C. nutans leaf cut. However, the time required to run the sample differed in these buffers. LBO1 buffer and Otto buffer took an average of 25 to 28 min to run the analysis compared to Tris.MgCl2 buffer, which was much faster, an average of 5 min. As such, LBOI and OTTO buffer gave a significantly low yield factor compared to Tris.MgCl2 buffer (Table 1). In this study, significantly highest yield factor (YF), lowest debris factor (DF) and low CV peaks are seen with Tris.MgCl2 supplemented with 1% PVP. Therefore, Tris.MgCl2 with added 1% PVP buffer was further used for genome estimation in C. nutans plant.
2C Nuclear DNA content analysis in C. nutans
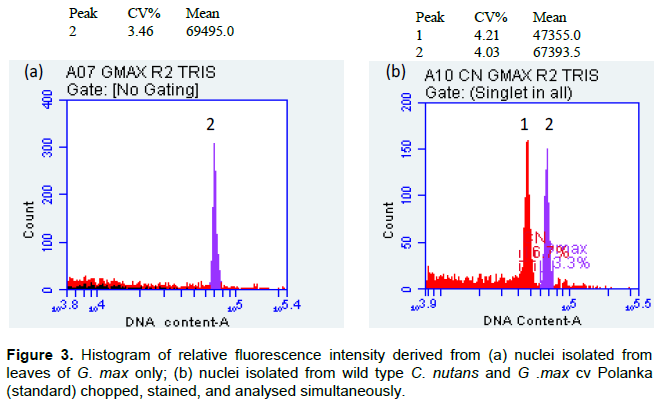
Genome estimation for C. nutans along with G. max cv. Polanka as its internal reference was carried out using Tris.MgCl2 with 1% PVP. The mean fluorescence intensity peak for G. max (as external) and C. nutans presented in Figure 3, shows distinct and well separated 2C peak of G.max and 2C peak of C. nutans. The coefficient of variation (CV) for the mean fluorescence intensity varied between 3.5 to 4.5%. The 2C nuclear DNA content of C. nutans was estimated by comparing DNA content of the standard (G. max), to be 2C=1.75± 0.005 pg. For the 2C-value obtained in this study, the CV value (standard deviation divided by average number of channels) is crucial. The CV values being above 5% indicates that the extracted nuclei are not concentrated. This leads to larger deviation in the 2C DNA value which will not be precise. Therefore, CV value of ≤ 5% is taken as reliable factor for genome size estimation (Cao et al., 2014).
Genome size comparison between in vitro and field grown C. nutans
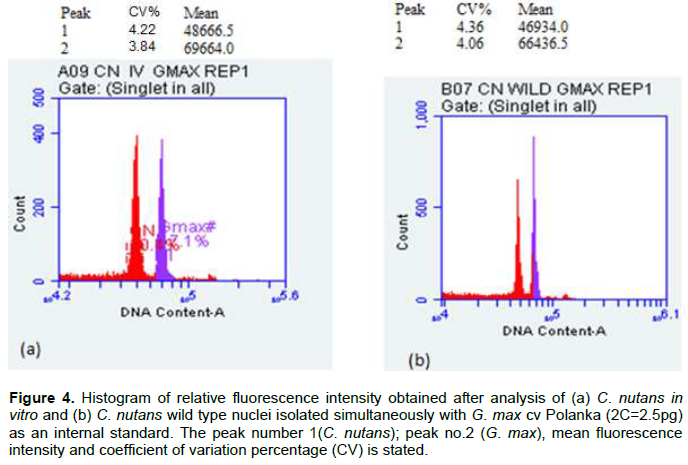
Figure 4 shows the comparison of mean fluorescence intensity between the wild type and in vitro grown C. nutans, as well as the DNA values (2C) of C. nutans along with 1C calculated (bp) using Tris.MgCl2 buffer. The estimated nuclear DNA content of field grown C. nutans was compared to its in vitro plantlets using G.max cv Polanka as internal standard (Figure 3). It shows no significant difference in genome size, between the field grown and in vitro grown C. nutans chopped together with G. max (Table 2).
DISCUSSION
Establishing the genome size and determining the best nuclear isolation protocol is among the preliminary, but crucial step in description of a plant species, and constructing pathways for genome sequencing (Gregory, 2005). DNA analysis using FCM involves preparation of intact nuclei suspension which is stained using PI fluorochromes prior to analysis. It is crucial for the suspension buffer to protect the nuclear DNA from degradation and to provide a suitable environment for specific stochiometric staining of the nuclear DNA including reduction in the negative effect of cytosolic compound present in plants during DNA staining (Loureiro et al., 2007). Although there are several nuclear isolation buffers available, published data shows that no one buffer works for all plant species (Bainard et al., 2010). Similarly, prominent yield of nuclei was seen for C. nutans isolated using Tris.MgCl2 buffer with 1% PVP compared to OTTO and LBO1 buffer. Tris being an organic compound helps in stabilizing the pH of the solution, thus keeping the nuclei intact (Greilhuber et al., 2007). Besides the presences of Triton X -100 further helps to ease the nuclei release from the cells and isolates them away from debris (Galbraith et al., 1983). The addition of polyvinylpyrrolidone (PVP) that is known to bind to phenolics and prevents interaction with DNA (O’Brien et al., 1996) has been crucial. The absences of PVP in both OTTO and LBO1 buffer could be a factor for high CV or low yield (Grielhuber et al., 2007). PVP have been reported to eliminate the intervention of inhibitory compounds in many studies (Veselska et al., 2014; Nath et al., 2014; Sadhu et al., 2016). However, the performance of the Tris.MgCl2 with 1% PVP did not exhibit good isolation of nuclei cells in Garcini mangostana (Midin et al., 2017) and Drimia indica (Nath et al., 2014). In certain plant species, the nuclei released from the plant cells adheres to the precipitate that is formed from citric acid in Otto I buffer as it forms mucous substance (Dolezel et al., 2005) thus giving a high background debris as seen in the histogram plot of this study. But Otto buffer was successfully used as isolation buffer in other plant species such as Erianthus arundinaceus (Yan et al., 2016), Cucurma species (Skornickova, et al. 2007) and Festuca pallens (Smarda and Bures, 2006). The presence of beta-mercaptoethanol in LBO1 reduced the CV value but did not give a high yield for the nuclei of in vitro C. nutans. But this buffer is reported applicable in evaluation of genome size in other plant species such as Rosa macrophylla (Idrees et al., 2020) and Primula genus (Wang et al., 2015).
Based on the FCM analysis, the difference between the mean fluorescence intensity of G. max prepared separately and those prepared together with C. nutans was not significant (Figure 2). This suggests that the addition of 1% PVP as antioxidant in the Tris.MgCl2 buffer (Dolezel et al., 1989) was able to minimize the cytosolic effect of C. nutans cell debris or secondary compounds in the PI staining of G. max. Thus, giving consistent results of nuclear DNA content of C. nutans against G. max as internal standard. Based on the mean fluorescence values, the nuclear DNA content of C. nutans was approximately 0.7 times of G. max. Therefore, it’s estimated that the nuclear DNA content of C. nutans to be 1.75 pg /2C and the 1C value to be 0.835 ×10⁹ bp. With this known genome size of C. nutans, evolutionary pattern of other species within Clinacanthus genus can be explored in the future besides being a basic guidance in polyploidization work.
In this study, micropropagation of C. nutans was carried out using nodal segments which facilitates lower risk of gene instability (Kesari et al., 2012). FCM analysis of 2C DNA carried out on in vitro plantlets of C. nutans showed a similar pattern compared to the field grown C. nutans indicating genome stability after continuous subculture over a period of two years. This suggests that the genome of the C. nutans plantlets is stable after prolonged subcultures. Similarly, genome stability was recorded in six medicinal plants that were propagated in vitro by Sliwinska and Thiem (2007). Stable genome sizes were also observed in Hydrasis canadensis L. (Obae et al., 2010) and Pongamia pinnata L. (Choudury et al., 2013) too. Thus, this paves the way for mass propagating C. nutans via tissue culture, to meet commercial-scale cultivation demands, while preserving the threatened wild population of this high value medicinal plant.
The recent release of C values in the plant data base has a compilation of more than 12,000 plant species with Angiosperm covering more than 10,000 species (Leitch et al., 2019). The Kew-C value database reports the smallest angiosperm genome size belongs to Fragaria viridis. Duch with 1C value at 0.1 pg and the largest (95 pg) belongs to Trillium apetalon using the same method of estimation, i.e. flow cytometer. Based on the data, C. nutans genome size falls at the lower end of the C-value distribution under the family of Acanthaceae, which ranges from 0.4 to 2.91 pg/1C. From this experiment, C. nutans genome size can be estimated to be approximately two times larger than Hygrophilia violacea with 1C DNA value at 0.40 pg and 0.8 times smaller than Acanthus mollis, which has 1C DNA value at 0.97 pg (Leitch et al., 2019). Genome size is directly associated to cell size and cell size is significantly related to cell division (Yuan et al., 2021). From the genome size comparison, cell size of C. nutans is larger than H. violacea and smaller than A. molis. With the variation found in genome size, correlation between the genome size and other phenotypical traits can be investigated to further understand the evolution drift, if any exists among a family (Yuan et al., 2021).
CONCLUSION
2C nuclear DNA content of C. nutans is estimated at 1.75 pg using flow cytometry analysis. This report is the first to estimate the nuclear DNA content of C. nutans and therefore provides important information required to assist further genomic and molecular studies of this economically important medicinal plant.
CONFLICT OF INTERESTS
The authors have not declared any conflict of interests.
ACKNOWLEDGMENTS
The authors appreciate School of Bioscience, Faculty of Health and Medical Sciences, Taylor’s University, Malaysia for the technical support and facilities provided in conducting this research and also thank Dr. Noorhariza Mohd. Zaki and team from Cytogenetics Laboratory, Malaysian Palm Oil Board (MPOB), Kajang, Malaysia for their technical advice, kind assistance and supplying of Glycine max cv. Polanka as the reference plant for this experiment. This research did not receive any specific grant from funding agencies in the public, commercial, or not-for-profit sectors.
REFERENCES
|
Arullappan S, Prabhu R, Naadeirmuthu T, Kodimani CC (2014). In vitro Screening of Cytotoxic, Antimicrobial and Antioxidant Activities of Clinacanthus nutans (Acanthaceae) leaf extracts. Tropical Journal of Pharmaceutical Research 13(9):1455-1461. |
|
|
Bainard JD, Fazekas AJ, Newsmaster SG (2010). Methodology significantly affects genome size estimate: quantitative evidence using Bryophytes. Cytometry 77A(8):725-732. |
|
|
Benett MD, Leitch IJ (1997). Nuclear DNA amounts in angiosperms. Annals of Botany 80(2):169-196. |
|
|
Bennett MD (1976) DNA amount, latitude and crop plant distribution. Environmental and Experimental Botany 16(2-3):93-108. |
|
|
Bennett MD, Price HJ, Johnston JS (2008). Anthocyanin inhibits propidium iodide DNA fluorescene in Euphoria pulcherrima :implications for genome size variation and flow cytometry. Annals of Botany 101(6):777-790. |
|
|
Cao B, Zhang LL, Bai C (2014). Estimation of Nuclear DNA Content in Tannin-rich Medicinal Plant Cornus officinalis by Flow Cytometry. Chinese Herbal Medicine 6(2):152-158. |
|
|
Chen B (2015). The rapid propagation technique of the medicinal plant Clinacanthus nutans by tissue culture. New York Science Journal 8(2):23-27. |
|
|
Chomnawang Traidej M, Surrasmo S, Wongsariya K, Bunyapraphatsara N (2009). Antibacterial Activity of Thai Medicinal Plants against Methicillin-resistant Staphylococcus aureus. Filoterapia 80(2):102-104. |
|
|
Choudury RR, Basak S, Ramesh AM, Rangan L (2013). Nuclear DNA content of Pongamia pinnata L. and genome size stability of in vitro regenerated plantlets. Prtoplasma 215(3):1-8. |
|
|
Coba PT, Brown SC (2001). Cytometry and Fluorimetry. In Plant Cell Biology- a pratical approach, 2nd edition by Hawes C, Satiat -Jeunenmaitre B, (eds),IRL Press, pp. 85-106. |
|
|
Dhillon S, Sukhraj, Adrian RV, Miksche JP (1980). Reassociation Kinetics and Cytophotometric Characterization of Peanut (Arachis hypogea) DNA. Plant Physioliogy 65(6):1121-1127. |
|
|
Dhooghe E, Laere K, Eeckhaut T, Leus L, Huylenbrock J (2010). Mitotic chromosome doubling of plant tissues in vitro. Plant Cell Tissue and Organ Culture 104(3):359-373. |
|
|
Dolezel J, Bartos J (2005). Plant DNA Flow Cytometry and Estimation of Nuclear Genome size. Annals of Botany 95(1):99-110. |
|
|
Dolezel J, Gohde (1995). Sex determination in dioecious plants Melandrium album and M.rubrum using high resolution by flow cytometry. Cytometry 19(2):103-106. |
|
|
Dolezel J, Bartos J, Voglmayr H (2003). Nuclear DNA content and genome size of trout and human. Cytometry Part A 51A(2):127-128. |
|
|
Dolezel J, Binarova P, Lucreti S (1989). Analysis of nuclear DNA content in plant cells by flow cytometry. Bioligia Planatarum 31(2):113-120. |
|
|
Dolezel J, Greilhuber J, Suda J (2007). Estimation of nuclear DNA content in plants using flow cytometry. Nature Protocols 2(9):2233-2244. |
|
|
Dolezel J, Grielhuber J, Lucretti S, Meister A, Lysak MA (1998). Plant Genome Size Estimation by Flow Cytometry: Inter-laboratory Comparison. Annals of Botany 82(1):17-26. |
|
|
Dolezel J, Sgorbati S, Lucreti S (1992). Comparison of three DNA fluorochrome for flow cytometric estimation of nuclear DNA content in plants. Physiologia Plantarum 85(4):625-631. |
|
|
Galbraith DW, Harkins KR, Maddox JM, Ayres NM, Sharma DP, Firoozabady E (1983). Rapid flow cytometric analysis of the cell cycle in intact plant tissues. Science 220(4601):1049-1051. |
|
|
Ghazemzadeh A, Nasiri A, Hawa ZE, Jaafar J, Baghdadi A, Ahmad I (2014). Changes in phytochemcial synthesi, chalcone synthase activity and pharmaceutical qualities of Sabah Snake Grass (Clinacanthus nutans) in relation to plant age. Molecule 19(11):17632-17648. |
|
|
Gregory TR (2005). The C-value enigma in plants and animals : a review of parallels and an appeal for partnership. Annals of Botany 95(1):133-146. |
|
|
Grielhuber J, Temseh E, Loureiro J (2007). Nuclear DNA content measurement. Flow cytometry with plant cells: analysis of genes, chromosomes and genomes pp. 67-101. |
|
|
Haida Z, Nakasha JJ, Mansor H (2020). In vitro Responses of Plant Growth Factors on Growth ,Yield, Phenolics Content and Antioxidant Activities of Clinacanthus nutans (Sabah Snake Grass). Plants 9(8):1-17. |
|
|
Huang D, Guo W, Gao J, Chen J, Olatunji JO (2015). Clinacanthus nutans (Burm. f.) Lindau Ethanol Extract Inhibits Hepatoma in Mice through Upregulation of the Immune Response. Molecules 20(9):17405-17428. |
|
|
Idrees M, Memon NH, Zhiyong Z, Gao XF (2020). Identification of Genome Size in Rosa macrophylla using MoFlo XDP Flwo Cytometry. Asian Journal of Plant Sciences 19(2):177-184. |
|
|
Kesari V, Ramesh AM, Rangan L (2012). High frequency direct organogenesis and evaluation of genetic stability for in vitro regenerated Pongamia pinnata,a valuable biodiesel plant. Biomass and Bioenergy 40:23-32. |
|
|
Kron P, Suda J, Husband BC (2007). Application of flow cytometry to evolutionary and population biology.Annual Review of Ecology, Evolution and Systematics 38(12):847-856. |
|
|
Kunsorn P, Ruangrungsi N, Lipipun V, Khanboon A, Rungsihirunrat K (2013). The identities and herpers simplex virus activity of Clinacanthus nutans and Clinacanthus siamensis. Asia Pacific Journal of Tropical Biomedicine 3(4):284-290. |
|
|
Leitch IJ, Johnston E, Pellicer J, Hidalgo O, Bennett MD (2019). Plant DNA C- values database release 4.0. Royal Botanic Gardens, Kew. Available via DIALOG. |
|
|
Levin DA, Funderburg SW (1979). Genome size in angiosperms: temperature versus tropical species. The American Naturalist 114(6):784-795. |
|
|
Loueriro J, Rodrigues E, Dolezel J, Santos C (2006). Comparison of Four Isolation Buffers for plant DNA Flow Cytometry. Annals of Botany 98(3):679-689. |
|
|
Loureiro J, Rodriguez E, Dolezel J, Santos C (2007). Two nuclear Isolation Buffers for Plant DNA flow cytometry: A test with 37 species. Annals of Botany 100(4):875-888. |
|
|
Loureiro J, Dolezel J, Gomes A, Santos C (2010). Genome size estimations on Ulmus minor Mill., Ulmus glabra Huds., and Celtis australis L. using flow cytometry. Plant Biology 9(4):541-544. |
|
|
Midin MR, Mohd SN, Madon MNS, Jhoe-Han G, Mohd N (2017). Determination of the chromosome number and genome size of Garcinia mangostana L.via cytogenetics, flow cytometry and k-mer analyses. International Journal of Cytology ,Cytosystematics and Cytogenetics 71(1):35-44. |
|
|
Moghbel N, Borujeni MK, Bernard F (2015). Colchicine Effect on the DNA content and stomata size of Glycyrrhiza glabra var. gladulifera and Carthamus tinctorius.L. cultured in vitro. Journal of Genetic engineering and Biotechnology 13(1):1-6. |
|
|
Nath S, Mallick SK, Jha S (2014). An improved method of genome size estimation by flow cytometry in five mucilaginous species of Hyacinthaceae. Cytometry Part A 85(10):833-840. |
|
|
Noirot M, Bare P, Duperey C, Hamon S, Kochko A (2005). Investigating the causes of stoichiometric error in genome size estimation using heat experiences: consequences on data interpretation. Annals of Botany 95(1):111-118. |
|
|
Obae G, Samuel, Todd West P (2010). Nuclear DNA content of Hydrastis canadensis .L. and genome stabilty of in vitro regenerated plantlets. Plant Cell Tissue Organ Culture 102:259-263. |
|
|
O'Brien IEW, Smith DR, Gardner RC, Murray BG (1996). Flow cytometric determination of genome size in Pinus. Plant Science 115(1):91-99. |
|
|
Ogur M, Erickson RO, Rosen GU, Sax KB, Holden C (1951). Nuclei acids in relation to cell divison in Lilium longiforum. Experiment Cell Research 2(1):73-89. |
|
|
Ohri D, Khoshoo TN (1986). Genome size in angiosperms. Plant Systematic and Evolution 153(1):119-132. |
|
|
Omidbaigi R, Mirzaee M, Hassani ME, Moghadam S (2010). Induction and identification of polyploidy in basil (Ocimum basilicum L.) medicinal plant by colchicine treatment. International Journal of Plant Production 4(2):87-98. |
|
|
Otto FJ (1990). DAPI staining of fixed cells for high-resolution flow cytometry of nuclear DNA. In: Darzynkiewickz Z, Crissman HA eds. Methods in cell biology, San Diego: Academic Press 33:105-110. |
|
|
Pannangpetch PL (2007). Antioxidant activity and protective effect against oxidative hemolysis of Clinacanthus nutans (Burm.f) Lindau. Songklanakarin Journal of Science and Technology 29(1):1-9. |
|
|
Pellicer J, Leitch I ( 2014). The Application of Flow Cytometry for Estimating Genome Size and Ploidy Level in Plants. In Molecular Plant Taxonomy: Methods in Molecular Biology, New York: Springer Science pp. 1-29. |
|
|
Pfosser M, Amon A, Lelley T, Heberle-Bors E ( 1995). Evaluation of sensitivity of flow cytometry in detecting aneuploidy in wheat using disomic and ditelosomic wheta rye addition lines. Cytometry 21(4):387-393. |
|
|
Price HJ, Hodnett G, Johnston JS (2000). Sunflower (Helianthus annuus.L) leaves contain compounds that reduce nuclear propidium iodide fluorescene. Annals of Botany 86(5):929-934. |
|
|
Sadhu A, Bhadra S, Bandyopadhyay M (2016). Novel nuclei isolation buffer for flow cytometric genome size estimation of Zingiberaceae sp.: a comparison with common isolation buffers. Annals of Botany 118(6):1057-1070. |
|
|
Skornickova LJ, Sida O, Jarolimova V, Sabu M, Tomas F, Travnicek P, Suda J (2007). Chromosome Numbers and Genome size Variation in Indian Species of Cucurma (Zingiberaceae). Annals of Botany 100(3):505-526. |
|
|
Sliwinska E, Thiem B (2007). Genome size stability in six medicinal plant species propagated in vitro. Biologia Plantarium 51(3):556-558. |
|
|
Smarda P, Bures P (2006). Intraspecific DNA content variability in Festuca pallens on different geographical scales and ploidy levels. Annals of Botany 98(3):665-678. |
|
|
Veselska, Tereza, Svoboda J, Rizickova Z, Kolarik M (2014). Appilcation of Flow Cytometry for Genome Size Determination in Geosmithia Fungi; A comparison of methods. Cytometry 85(10):856- 965. |
|
|
Wang J, Juan L, Ming K (2015). Quantitative testing of the methodology for genome size estimation in plants using flow cytometry: a case study of the Primulina genus. Frontiers in Plant Science 6:354. |
|
|
Wanikiat P, Panthong A, Sujayanon P, Yoosok (2008). The anti-inflammatory effects and the inhibition of neutrophil responsiveness by Barleria lupulina and Clinacanthus nutans extracts. Journal of Ethnopharmacology 116(2):234-238. |
|
|
Yan J, Zhang J, Sun K, Chang D, Shiqie B, Yixin S, Huang L, Jin Z, Yu Z, Dong Y (2016). Ploidy level and DNA content of Erianthus arundinaceus and the association with biological characteristics. PLOS pp. 1-14. |
|
|
Yuan H, Huang Y, Mao Y, Zhang N, Nie Y, Zhang X, Zhou Y, Mao S (2021). The Evolutionary Patterns of Genome Size in Ensifera (Insecta; Orthopetra). Frontier in Genetics 12:1-13. |
|
|
Yong KY, Tan JJ, The SS, Mah SH, Cheng LE, Chong HS, Zuraini A (2013). Clinacanthus nutans extratcs are anti oxidant with anti proliferative effect on cultured human cancer cell line. Evidence Based Complementary and Alternative Medicine pp. 1-9. |
|
|
Zulkipli N, Ihsan, Rajabalaya R, Adi Idris, Sulaiman NA, David SR (2017). Clinacanthus nutans: A Review on ethnomedicinal uses, chemical constituents and pharmacological properties. Pharmaceutical Biology 55(1):1093-1113. |
|
Copyright © 2024 Author(s) retain the copyright of this article.
This article is published under the terms of the Creative Commons Attribution License 4.0


