Full Length Research Paper

ABSTRACT
Coffee is an important commodity in the international market. However, little attention is given to it and its breeding research in Nigeria. This has resulted to low production and foreign earning. The information on relationship between yield and yield- related characters is an excellent and significant tool for breeding. The experiment was conducted on Cocoa Research Institute of Nigeria coffee germplasms. The objectives of this study were to determine the genetic relationship and identify traits that have a direct and indirect effect on yield of coffee. A total of 45 coffee genotypes were studied during 2016/2017 cropping season. The data were subjected to correlation coefficients and regression analyses. The result revealed significant (P<0.05) correlation among traits. Weight of seed per tree (actual yield) has strong and positive correlation with trunk height, leaf length, leaf width, stiple arista length, number of flower per axil, number of flower per fascicle, berry width, berry thickness, 100 berry weight, 100 seed weight, and weight of berry per tree. Weight of berry per tree, plant height, number of flower per axil and number of fascicle per node were the predictors and accounted for 94% of the variation observed and therefore be given serious consideration in coffee breeding programmes.
Key words: Coffee, germplasm, yield, characters, correlation, stepwise regression.
INTRODUCTION
Coffee is one of the most economically important beverage crops, and it stands second only to crude oil in terms of international trade on the world market. It is originated from tropical Africa where wild populations occur abundantly in the tropical regions (Berthaud and Charrier, 1988; Maurin et al., 2007). Its production is fundamental in over 50 developing countries for which it is the main foreign currency earner. In many producing countries, besides contributing a tremendous amount to the foreign exchange as main crop, it serves as a main crop for livelihood for millions of people and plays a vital role in their socio-economic life (Orozco Castillo et al., 1994; Agwanda et al., 1997; Carneiro, 1999; Anthony et al., 2001; Steiger et al., 2002). Coffee trees are evergreen which range from shrubs to trees and can grow to a height of 10 m. The stems are orthotropic and developed from aerial part of the stem. The primary branches arise in pairs opposite each other and are subsidiary to the main stem. The sub lateral branches that is, secondary, tertiary and quaternary branches developed from primary branches (Coste, 1992; Cliffort and Wilson, 1985). The upper side of leaves is shiny, waxy, spear-shaped, and elliptical with conspicuous vein. They grow on the side of main stem and branches in pairs with buds at the leaf stalk base. Leaf color varies. It can be greenish, yellowish, dark green, bronzed or purple tinged young flush. Leaf can be as long as 40 cm. Some trees are deciduous while others retain leaves for three or more years with a leaf area index of 7-8 for a high yielding variety (Wintgens, 2004; Ngugi and Aluka, 2017).
In developing adapted cultivars of any crop, available genetic resources of the crop are important for its improvement. The significant positive correlation coefficient, genetic advance, variability and heritability are an excellent tool to explore for genotype selection in crop improvement programme (Akbar et al., 2003, Mwenye et al., 2010). Yield is a quantitative trait that is complex because of the influence of a number of characters contributing to yield (Xie, 2015). There is need therefore to understand the interrelationships and the magnitude of characters among themselves and with the yield in order to improve the selection efficiency through a combination of suitable characters (Ahmad et al., 2013). The correlation coefficient is an imperative statistical method to evaluate breeding programs for high yield and to study direct and indirect input of the yield variables (Mohamed, 1999). Correlation may be due to phenotypic, genotypic and environmental factors.
However, traits that are not important could be eliminated through stepwise regression analysis. Stepwise regression proved to be the more resourceful predictive equation for yield (Naser and Leilah, 1993). Therefore, traits that are most important with considerable effects on yield, which is a dependable trait or variable, will be verified. The traits selected through stepwise regression analysis can be used as selection criteria in a breeding programme (Williams et al., 1990; Ogrodowczyk and Warzyniak, 2004; Sabaghnia et al., 2010). Moreover, the stepwise regression model is a technique that is used to estimate the value of a quantitative variable regarding its relationship with one or some other quantitative variables. This relation is such that it is possible to predict other changes using one variable.
Getachew (2019) in his research reported a significant and positive correlation of coffee yield with average internode length on stem, angle of primary branches, number of primary branches, stem diameter, the width of fruit, length of fruit, thickness of fruit and average length of primary branches. Percentage of bearing primary branches, hundred bean weight, leaf length, and canopy diameter also had a positive and significant correlation with coffee yield. Lemi et al. (2017), similarly reported canopy diameter, length of first primary branch, plant height have direct effect that had positive and significant on coffee. Seyoum (2003) reported his findings that the highest direct effect on coffee yield was exerted by length of the longest primary branches and angle of primary branches. All these suggested that selection, using these characters, would be of help in coffee improvement. In order to meet the demand for coffee, there is need for increase in yield per hectare. Therefore, the objectives of the study are to determine the genetic relationship and identify traits that have a direct and indirect effect on coffee.
MATERIALS AND METHODS
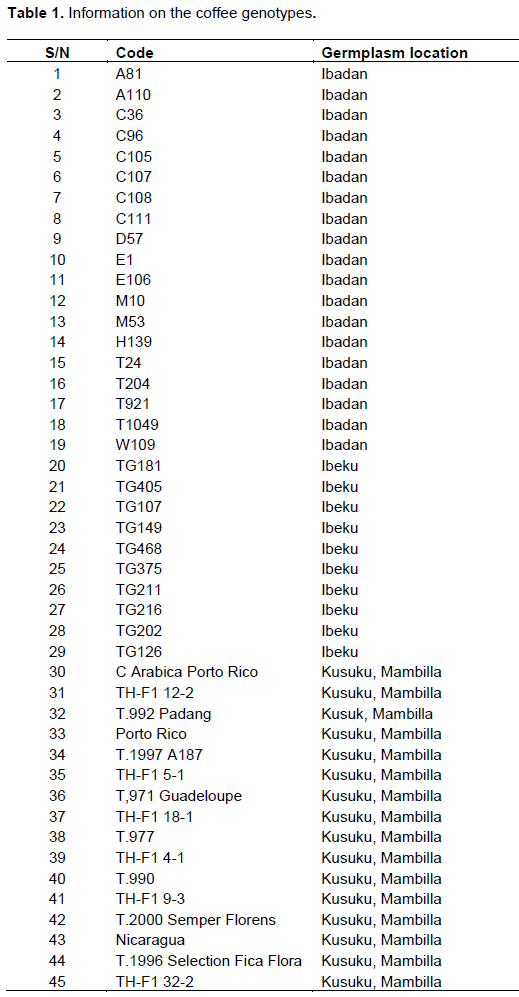
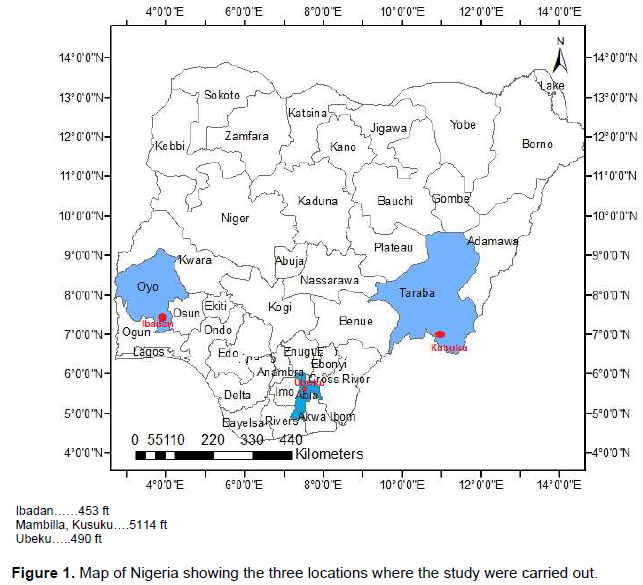
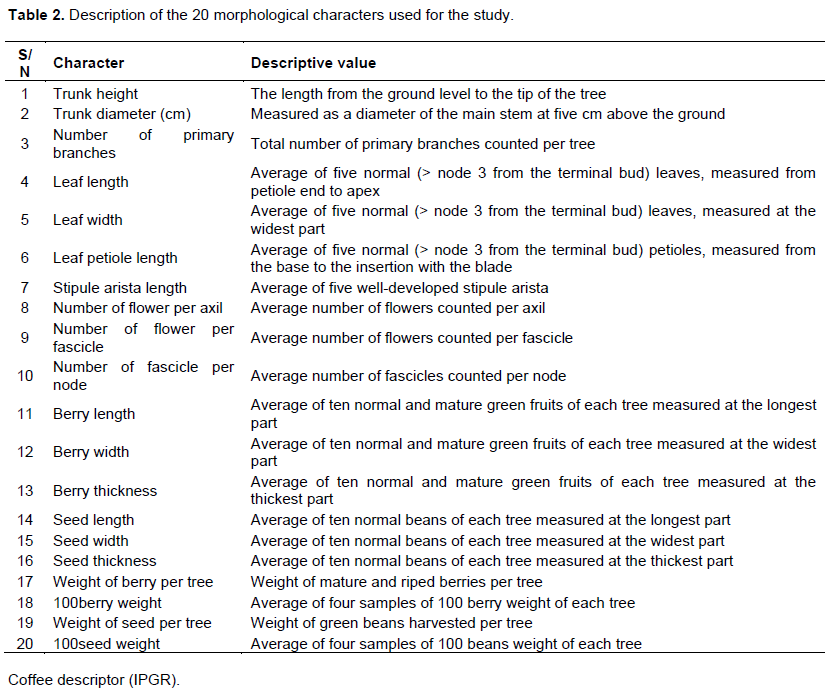
Forty-five coffee genotypes from Cocoa Research Institute of Nigeria (CRIN) coffee germplasms located in headquarter in Ibadan, Oyo state and two of her substations (Ibeku, Abia state and Kusuku Mambilla, Taraba state) were used for the study as represented in Table 1. The sites are situated between latitude 5.3130° and 7.37750N; and longitude 3.9470° and 11.7200°E (Figure 1). The experiment was conducted during 2016/ 2017 cropping season on existing coffee trees. The experimental design was Randomised Complete Block Design. Data were collected from 4 individual plants using a random sampling procedure. Descriptor of Coffee (IPGRI, 1996) was used for data collection. Twenty quantitative characters namely: trunk height (cm), trunk diameter (cm), number of primary branches, leaf length (mm), leaf width (mm), leaf petiole length (mm), stipule arista length (mm), number of flower per axil, number of flower per fascicle, number of fascicle per node, berry length (mm), berry width (mm), berry thickness (mm), seed length (mm), seed width (mm), seed thickness (mm), weight of berry per tree (g), 100berry weight (g), weight of seed per tree (g) (actual yield), and 100seed per tree (g) were scored on the morphology of the 45 genotypes. The quantitative characters were determined by measurement and weighing (Table 2).
Genetic parameters and association among characters
The phenotypic, genotypic and environmental correlation coefficients were estimated using the formula of Miller et al. (1958) thus:
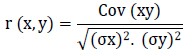
Where r(x,y) is either genotypic or phenotypic or environmental correlation between variables x and y; Cov(xy) is the covariance of variables x and y; (σx)2 is either the genotypic or phenotypic or environmental variance of variable x; (σy)2 is either the genotypic or phenotypic or environmental variance of variable y.
The significance of the correlation coefficients was tested using the non-directional probability in the software of Lowry (2009). Stepwise regression analysis was performed using SAS software version 9 (SAS Institute Inc. 2004.
RESULTS
The result of phenotypic correlation coefficient is presented in Table 3. Trunk height had a positive correlation with trunk diameter, number of primary branches, leaf length, leaf width, leaf petiole length, stipule arista length, weight of berry per tree, 100 berry weight, weight of seeds per tree and 100 seed weight (r = 0.33, 0.26, 0.71, 0.80, 0.41, 0. 51, 0.34, 0.49, 0.39, and 0.52 respectively) but negatively correlated with number of flower per fascicle, seed length and seed thickness (-0.23, -0.35 and -0.42 respectively). The trunk diameter had positive significant correlation with number of primary branches, leaf length, leaf width, leaf petiole length, stipule arista length and 100 berry weight (0.80, 0.22, 0.25, 0.35, 0.62 and 0.21 respectively) but negative significant correlation with berry width and berry thickness (-0.25 and -0.34 respectively). Number of primary branches had positive correlation with leaf length, leaf width, leaf petiole length, stipule arista length and seed width (0.26, 0.28, 0.46, 0.55, 0.32) but negatively correlated with berry width and berry thickness (-0.26, -0.40). Leaf length had positive significant correlation with leaf width, leaf petiole length, stipule arista length, berry width, weight of berry per tree, 100 berry weight and 100 seed weight (0.90, 0.59, 0.49, 0.24, 0.23, 0.33 and 0.41 respectively) but negative significant correlation with number of flower per fascicle, seed length and seed thickness (-0.26, -0.26 and -0.43 respectively).
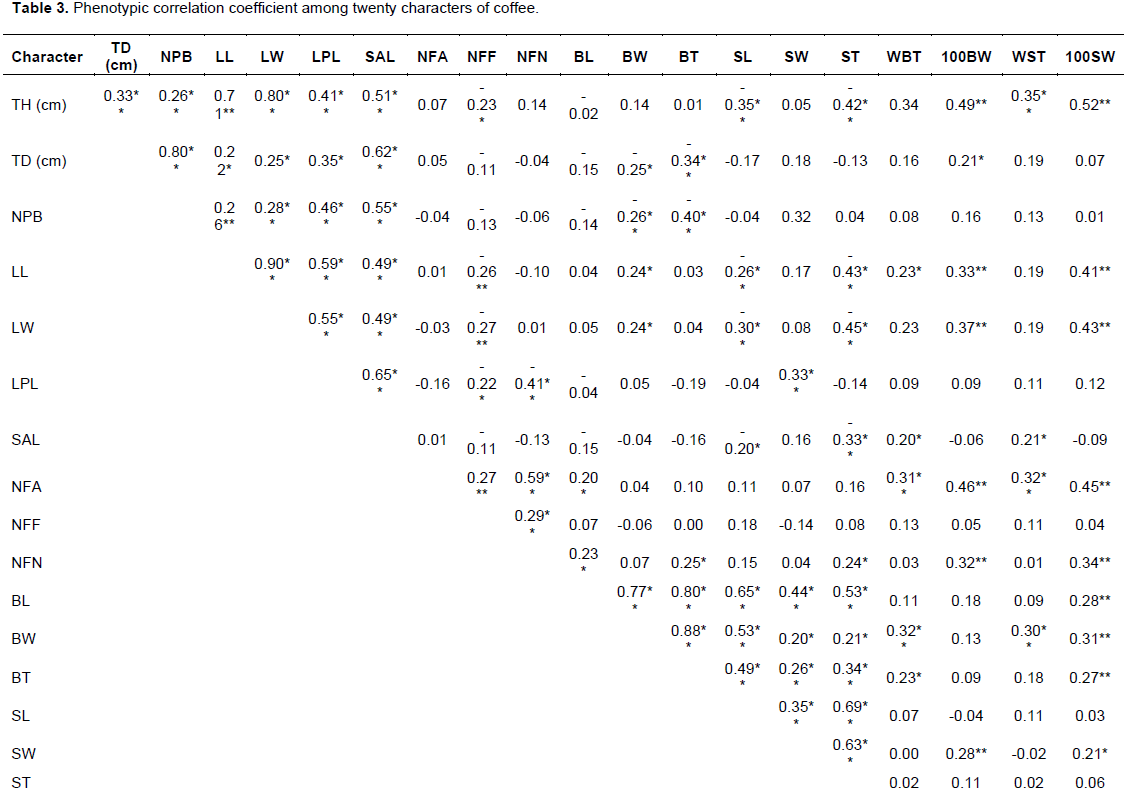
Similarly, leaf width had a positive significant correlation with leaf petiole length, stipule arista length, berry width, 100 berry weight and 100 seed weight (0.55, 0.49, 0.24, 0.37 and 0.43 respectively) and negative significant correlation with number of flowers per fascicle, seed length and seed thickness (-0.27, -0.30 and 0.45 respectively). Leaf petiole length had positive significant correlation with stipule arista length and seed width (0.65 and 0.33 respectively) and negative significant correlation with number of flowers per fascicle and number of fascicles per node (-022 and 0.41 respectively). Stipule arista length had a positive significant correlation with weight of berries per tree and weight of seed per tree (0.20 and 0.21 respectively) and negative significant correlation with seed length and seed thickness (-0.20 and -0.33 respectively). Number of flowers per axil positive significant correlation with number of flowers per fascicle, number of fascicles per node, berry length, weight of berries per tree, 100 berry weights, weight of seeds per tree and 100 seed weight (0.20, 0.59, 0.20, 0.31, 0.46, 0.32, and 0.45respectively). Number of flowers per fascicle is positive significant correlation with number of fascicle per node (0.29). Number of fascicles per node had positive significant correlation with berry length, berry thickness, seed thickness, 100 berry weights and 100 seed weight (0.23, 0.25, 0.24, 0.32, and 0.34 respectively).
Berry length had positive significant correlation with berry width, berry thickness, seed length, seed width, seed thickness and 100 seed weight (0.77, 0.80, 0.65, 0.44, 0.53 and 0.28 respectly). Berry width had positive significant correlation with berry thickness, seed length, seed width, and seed thickness, weight of berry per tree, weight of seeds per tree and 100 seed weight (0.88, 0.53, 0.20, 0.21, 0.32, 0.30, and 0.31 respectively). Berry thickness had a positive correlation with seed length, seed width, seed thickness weight of seed per tree and 100 seed weight (0.49, 0.26, 0.34, 0.23 and 0.27 respectively). Seed length was significantly correlated with seed width and seed thickness (0.35 and 0.69 respectively). Seed width had positive significant correlation with seed thickness, 100 berry weight and100 seed weight (0.63, 0.28, and 0.21 respectively). Weight of berries per tree had positive significant correlation with 100 berry weights, weight of seeds per tree and 100 seed weight (0.48, 0.98, and 0.45 respectively). Also, 100 berry weights had positively correlated with weight of seed per tree and 100 seed weight (0.48 and 0.91 respectively). Weight of seeds per tree had positive correlation with 100 seed weight (0.46).
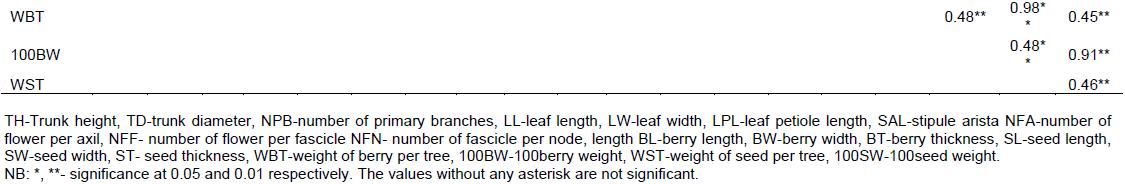
Table 4 presents the genotypic correlation coefficient. Trunk height had strong, positive correlation with trunk diameter, number of primary branches, leaf length, leaf width, stipule arista length, weight of berries per tree, 100berry weight, weight of seeds per tree and 100 seed weight (0.35, 0.28, 0.75, 0.84, 0.43, 0.53, 0.37, 0.53, 0.38 and 0.55 respectively) but negative significant correlation with number of flowers per fascicle, seed length and seed thickness (-0.64, -0.37 and -0.46 respectively). Similarly, trunk diameter correlated positively with number of primary branches, leaf length, leaf width, leaf petiole length, stipule arista length and 100berry weight (0.97, 0.24, 0.27, 0.39, 0.67 and 0.24 respectively ) but exhibited negative and significant correlation with number of flowers per fascicle, berry width and berry thickness (-0.43, -0.30 and -0.39 respectively) . Number of primary branches had a positive correlation with leaf length, leaf width, leaf petiole length, stipule arista length and seed width (0.29, 0.31, 0.52, 0.61 and 0.42 respectively) but negatively and significant correlation with number of flowers per fascicle, beery width and berry thickness (-0.45, -0.28 and -0.45 respectively). Leaf length had a positive correlation with leaf width, leaf petiole length, stipule arista length, berry width, seed width, weight of berries per tree, 100berry weight, weight of seeds per tree and 100seed weight (0.91, 0.60, 0.51, 0.25, 0.20, 0.24, 0.35, 0.20 and 0.45 respectively) and negative correlation with number of flowers per fascicle, seed length and seed thickness (-0.75, -0.28 and -0.46 respectively). Leaf width had positively correlated with leaf petiole length, stipule arista length, berry width, weight of berries per tree, 100berry weight, weight of seeds per tree and 100seed weight (0.56, 0.51, 0.25, 0.24,0.40, 0.20 and 0.48 respectively) and negatively correlated with number of flowers per fascicle, seed length and seed thickness (-0.79, -.0.32 and 0.48 respectively).
Leaf petiole length had positive correlation with stipule arista length, number of flowers per axil and seed width (0.67, 0.21, and 0.38 respectively), but negatively correlated with number of flowers per fascicle, number of fascicles per node and berry thickness (-0.67, 0.52 and -0.20 respectively). Stipule arista length was negatively correlated with number of flowers per fascicle, seed length and seed thickness (-0.33, -0.22 and -0.36 respectively) but exhibited positive and significant correlation with weight of berries per tree and weight of seeds per tree (0.22 and 0.23 respectively). Number of flowers per axil had positive and significant correlation with number of flowers per fascicle, number of fascicles per node, weight of berries per tree, 100bery weight, weight of seeds per tree and 100seed weight (0.73, 0.68, 0.36, 0.54, 0.37 and 0.53 respectively). Number of flower per fascicle had positively correlated with number of number fascicles per node, seed length, weight of berries per tree and weight of seeds per tree (0.91, 0.36, 0.35 and 0.30 respectively) and negative correlation with berry width and seed width (-0.23 and -0.68 respectively). Number of fascicles per node had positive correlation with berry thickness, seed thickness, 100berry weight and 100seed weight (0.22, 0.20, 0.37 and 0.40 respectively).
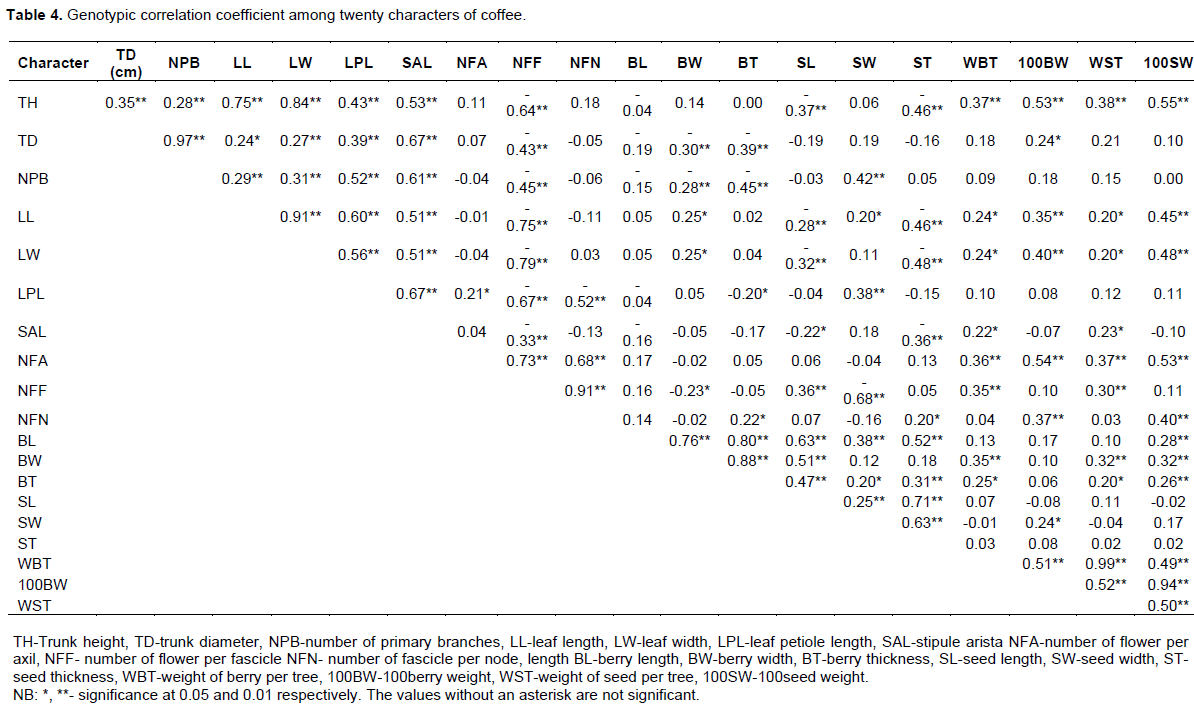
Berry length had positively correlated with berry width, berry thickness, seed length, seed width, seed thickness and 100seed weight (0.76, 0.80, 0.63, 0.38, 0.52, and 0.28 respectively). Berry width had positively correlated with berry thickness, seed length, weight of berries per tree, weight of seeds per tree and 100seed weight (0.88, 0.51, 0.35, 0.32, and 0.32 respectively). Similarly, berry thickness was correlated with seed length, seed width, seed thickness, weight of berries per tree, weight of seeds per tree and 1000seed weight (0.47, 0.20, 0.31, 0.25, 0.20 and 0.26 respectively). Seed length was correlated with seed width and seed thickness (0.25 and 0.71 respectively). Seed width was correlated seed thickness and 100berry weight (0.63 and 0.24). Weight of berries tree was correlated with 100berry weight, weight of seeds per tree and 100seed weight (0.51, 0.99 and 0.49 respectively). 100berry weight was correlated with weight of seeds per tree and 100seed weight (0.52 and 0.94 respectively). Weight of seeds per tree was correlated with 100seed weight (0.50). Trunk height had positively correlated with trunk diameter, number of primary branches, stipule arista length and 100seed weight (0.22, 0.22, 0.29 and 0.26 respectively) (Table 5). Trunk diameter had a positive correlation with leaf length and stipule arista length (0.21 and 0.33 respectively). Number of primary branches had positively correlated with stipule arista length (0.23). Leaf length was strongly correlated with leaf width (0.72). Leaf width had negative correlation with seed width (-0.20). Leaf petiole length had positively correlated with 100 berry weight and 100 seed weight (0.23 and 0.21 respectively). Stipule arista length had a negative correlation with number of fascicles per node (-0.21). Number of flowers per axil had positively correlated with number of fascicles per node, berry length, berry width, berry thickness, seed length, seed width, seed thickness and 100 seed weight (0.41, 0.35, 0.40, 0.40, 0.36, 0.39, 0.35 and 0.20 respectively). Similarly, number of flowers per fascicle had a positive correlation with seed length and seed thickness (0.22 and 0.22 respectively). Number of fascicles per node had positively correlated with berry length, berry width, berry thickness, seed length, seed width, seed thickness, 100 berry weight, and 100 seed weight (0.58, 0.54, 0.54, 0.52, 0.53, 0.47, 0.21 and 0.21 respectively).

Berry length had strong a positive correlation with berry width, berry thickness, seed length, seed width, seed thickness, 100 berry weight, and 100 seed weight (0.93, 0.87, 0.79, 0.78, 0.62, 0.31 and 0.29 respectively). Berry width had a strong positive correlation with berry thickness, seed length, seed width, seed thickness, 100 berry weight, and 100 seed weight (0.92, 0. 75, 0.76, 0.61, 0.37 and 0.31 respectively). Berry thickness was strongly positively correlated with seed length, seed width, seed thickness, 100 berry weight, and 100 seed weight (0.72, 0.72, 0.64, 0.44 and 0.39 respectively). Seed length had strong positive correlation with seed width, seed thickness, 100 berry weights and 100 seed weight (0.90, 0.58, 0.39 and 0.36 respectively). Seed width had strong positive correlation with seed thickness, 100 berry weight and 100 seed weight (0.66, 0.52 and 0.43 respectively). Seed thickness had positively correlated with 100 berry weight and 100 seed weight (0.48 and 0.35 respectively). Weight of berries per tree was strongly correlated with weight of seeds per tree (0.90). Also,100 berry weight strongly correlated with 100 seed weight (0.75).
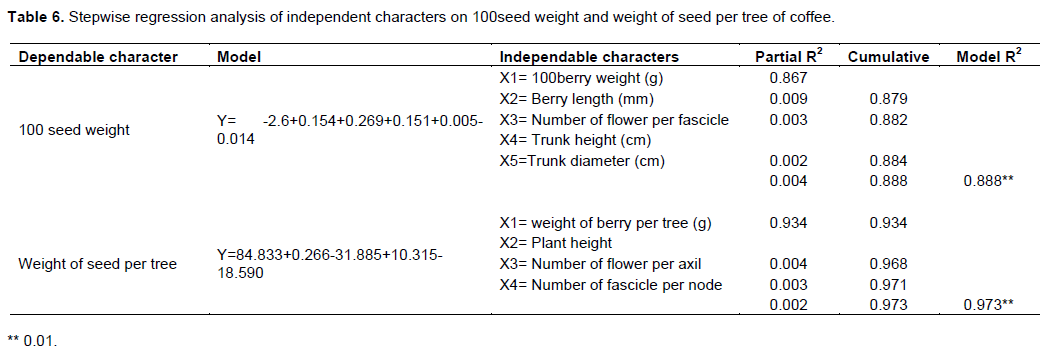
Stepwise regression analysis identifies the best subset of predictors or independent variables and the order in which variables are included in the regression equation. The order tells the relative importance of the predictors, which is the best predictor, second best and so on. The result for 100 seeds weight as dependent variables showed that 100 berries weight, berry length, number of flower per fascicle, trunk height and trunk diameter are the predictors for 100seed weight and accounted for 93% of variation observed. Each trait made a significant contribution to 100seed weight with 100berry weight as best predictor, which accounted for 86% of the total variation (Table 6). Similarly, the result obtained for weight of seed per tree showed that weight of berry per tree, plant habit, number of flower per axil and number of fascicle per node in that order are the predictors and accounted for 94% of the variation observed with weight of berry per tree as best predictor, accounting for 93.4%.
DISCUSSION
Knowledge of correlations among characters is useful in designing an effective breeding programme for any crop. The mutual association among characters is often expressed by the phenotypic, genotypic and environmental correlation (Searle 1961; Ariyo, 1989; Akinyele and Osekita, 2006). Weight of seed per tree which is actual yield is has strong and positive correlation with trunk height, leaf length, leaf width stiple arista length, number of flower per axil, number of flower per fascicle, berry width, berry thickness, 100 berry weight, 100seed weight and weight of berry per tree. According to Getachew (2019), coffee yield was found to have strong and positive association with fruit width and fruit thickness at genotypic level. Gizachew and Hussei (2017) in their findings reported that average yield has positive and significant correlation with 100 bean weight and leaf length. Ermias (2005) also reported strong and positive correlation with plant height. Phenotypic correlation is a composite of genotypic and environmental correlations. There are several reasons for using indirect selection. Sometimes the main character is expressed late, or measurement of the indirect character is much easier than for the direct character. Although yield is not directly correlated with seed length and berry length but has correlation with berry width and berry thickness which in turn have direct correlation seed length (0.51 and 0.47) and berry length (0.76, 0.80). Selection could be made for seed length and berry length during breeding programme resulting to yield improvement.
Moreover, complex plant characters such as yield are quantitatively inherited and influenced by genetic effects, as well as by genotype x environment interaction. Due to these reasons, selections to improve yield directly may be difficult and time-consuming, especially for perennial crops with a long juvenile period such as coffee. Therefore, identification and use of positively correlated characters are appropriate.
From the results obtained, the lower values of phenotypic correlation coefficients (weight of seed per tree with trunk height, weight of berry per tree, 100seed weight and correlation among traits) to the genotypic correlation coefficient values, indicates that the influence of environmental factors is minimal and lower than the inherent genetic effects. This is in line with the work of Walyaro and Van der Vossen, 1979 where genotypic correlation values were greater than phenotypic values. According to Falconer (1989), linkage effects or pleotropic effect of genes may be the source of significant correlation coefficients among various characters. Negative correlation between two traits implies selection of one trait for improvement will cause decrease in the other trait especially if it is of high magnitude. In this study, number of flower per fascicle had strong negative correlation with leaf length, leaf width and leaf petiole length (-0.75, -0.79 and -0.67 respectively). When the correlation is strong and positive, simultaneous improvements of both traits could be achieved (Rangaswamy, 1995). All flower characters (number of flower per axil, number of flower per fascicle, and number of fascicle per node) and some yield and yield related characters were positively correlated with one another. The implication of this is that selection/breeding for any of the characters is invariably selecting /breeding for others. Moreover, those with high values of correlation show that no matter how many times the trial is repeated, the result will be highly dependent.
Stepwise regression procedure was used to determine the variables that accounted for the majority of total yield variability. At each step, one variable was added to the regression equation. The added variable was the one that included the greatest reduction in the error sum of square. It was also the variable that had the highest partial correlation with the dependent variable for fixed values of those variables already added. Moreover, it was the variable which had the highest F-value. Stepwise regression is, therefore designed to find the most parsimonious set of predictors that are most effective in predicting the dependent variables (Ndukauba et al., 2015).
In order to remove the effect of non-effective characteristics in the regression model of coffee yield, stepwise regression was used in the analysis. 100seed weight and weight of seeds per tree as dependent variable and other traits as an independent variable were considered.
The result suggested that 100 berry weight, berry length, number of flowers per fascicle, trunk height and trunk diameter were the major contributors towards 100seed weight. In contrast, the weight of berries per tree, plant height, number of flowers per axil and number of fascicles per node were the major contributors towards weight of seeds per tree of coffee and should therefore be given serious consideration in coffee breeding programs.
CONCLUSION
In conclusion, genotypic correlations among characters affecting yield elucidate true relationship as they eliminate the environmental influences. It can be recommended that coffee yield improvement could be accomplished through selections based on these correlations. Consequently, knowledge of associations between yield and its component traits as well as among the component traits themselves can promote the efficiency of selection in coffee breeding programs.
CONFLICT OF INTERESTS
The authors have not declared any conflict of interests.
ACKNOWLEDGEMENT
The authors appreciate the Cocoa Research Institute of Nigeria (CRIN) management for the opportunity to carry out the experiment. They also thank the staff of Kusuku, Mambilla and Ibeku CRIN substations and Mr. Tope Adebisi for their assistance during the research.
REFERENCES
|
Agwanda CO, Lashermes P, Trouslot P, Combes MC, Charrier A (1997). Identification of RAPD markers for resistance to coffee berry disease, Colletotrichum kahawae, in Arabica coffee. Euphytica 97:241-248. |
|
|
Ahmad MG, Zaffar SD, Mir ZA. Dar SH (2013). Estimation of correlation coefficient in oats (Avena sativa L.) for forage yield, grain yield and their contributing traits. International Journal of Plant Breeding Genetics 7:188-191. |
|
|
Akbar M, Mahmood T, Yaqub M, Anwar M, Ali M, Iqbal SH (2003). Variability, correlation and path coefficient studies in summer mustard (Brassica juncea L.). Asian Journal of Plant Science 2:696-698. |
|
|
Akinyele BO, Osekita OS (2006). Correlation and path coefficient analyses of seed yield attributes in okra (Abelmoschus esculentus(L.) Moench). African Journal of Biotechnology 5:1330-1336. |
|
|
Anthony F, Bertrand B, Quiros O, Wilches A, Lashermes P, Berthaud J, Charrier A (2001). Genetic diversity of wild coffee (Coffea arabica L.) using molecular markers. Euphytica 118:53-65. |
|
|
Ariyo OJ (1989). Variation and heritability of fifteen characters in okra (Abelmoschus esculentus (L.) Moench). Tropical Agricultural Journal 67:215-216. |
|
|
Berthaud J, Charrier A (1988). Genetic resources of Coffea. In: R.J. Clarke and R. Macrae (Eds.), Coffee: Agronomy. Elsevier Applied Science 4:1-41. |
|
|
Carneiro MF (1999). Advances in coffee biotechnology. AgBiotechNet 1:1-8. |
|
|
Cliffort MN, Willson KC (1985). Chemical and physical aspects of green coffee and coffee products. In: M.N. Clifford and K.C. Willson (Eds.), Coffee botany, biochemistry, and production of beans and beverage, Croom Helm, London pp. 305-374. |
|
|
Coste R (1992). Characteristics and composition of green coffee. In: Coffee: The Plant and the Product. The Macmillan Press Ltd, London and Basingstoke, U.K. P 328. |
|
|
Ermias H (2005). Evaluation of Wollega coffee germplasm for yield, yield component and resistant to coffee berry disease at early bearing stage. An MSc thesis submitted to school of graduate studies of Alemaya University 69 p. |
|
|
Falconer DS (1989). Introduction to Quantitative Genetics. Longman Scientific and Technical.Jhony Wiley and Sons, Inc. Newyork. 438p. |
|
|
Getachew W (2019). Character Association and Path Coefficient Analysis for Yield and Its Related Traits in Ethiopian Coffee (Coffea arabica L.) accessions. International Journal of Research Studies in Agricultural Sciences 5(3):19-29. |
|
|
Gizachew A, Hussein M (2017). Association and path coefficient analysis of yield and yield attributes of coffee (Coffea arabica L.) under Sidama specialty coffee growing area, Awada, southern Ethiopia. Advance Crop Science and Technology 5:307. |
|
|
International Plant Genetics Resource Institute (IPGRI) (1996). Descriptions of Coffea spp. and Psilanthus spp. International Plant Genetics Resource Institute, Rome. |
|
|
Lemi B, Ashenafi A, Tadesse B (2017). Correlation and path coefficient analysis for yield and yield components in some Ethiopian accessions of Arabica Coffee. International Journal of Plant Breeding and Crop Science 4(2):178-186. |
|
|
Lowry R (2009). The significance of a correlation coefficient. |
|
|
Maurin O, Davis AP, Chester M, Mvungi EF, Jaufeerally-Fakim Y, Fay MF (2007). Towards a phylogeny for Coffea (Rubiaceae): Identifying Well supported Lineages based on Nuclear and Plastid DNA sequences. Annals of Botany 100:1565-1583. |
|
|
Miller PA, Williams JC, Robinson HF, Cornstock RE (1958). Estimate of genotypic and environmental variance and covariance in upland cotton and their implication in selection. Agronomy Journal 50:126-131. |
|
|
Mohamed NA (1999). Some statistical procedures for evaluation of the relative contribution for yield components in wheat. Zagazig Journal Agriculture Research 26(2):281-290. |
|
|
Mwenye O, Labschagne MT, Herselman L, Benesi IRM, Chipungu FP (2010). Ethn-botanical and morphological characterization f cocoyams (Colocasia esculenta L. Schott and Xanthosoma sagittifolum L. Schott) germplasm in Malawi. Proceeding of the 2nd RUFORUM Biennial Meeting Research Application Summary pp. 193-199. |
|
|
Naser SM, Leilah AA (1993). Integrated analysis of the relative contribution for some variables in sugar beet using some statistical techniques. Bulletin of the Faculty of Agriculture, University of Cairo 44(1):253-266. |
|
|
Ndukauba J, Nwofia GE, Okocha PI. Ene-Obong, EE (2015). Variability in Egusi-Melon Genotypes (Citrullus lanatus (Thumb) Matsum and Nakai) in Derived Savannah Environment in South-Eastern Nigeria. International Journal of Plant Research 5(1):19-26. |
|
|
Ngugi K, Aluka P (2017). Harnessing genetic, biochemical and green bean quality diversity in landraces of robusta coffee (Coffea canephora L. Pierre) LAP Lambert Academic publishing. |
|
|
Ogrodowczyk M, Warzyniak M (2004). Adoption of the path- coefficient analysis for assessment of relationship and interrelationship of yield and yield parameters of winter oilseed rape. Rosliny Oleiste 25(2):479-492. |
|
|
Orozco-Castillo C, Chalmers KJ, Waugh R, Powell W (1994). Detection of genetic diversity and selective gene introgression in coffee using RAPD markers. Theory of Applied Genetics 87:934-940. |
|
|
Rangaswamy R (1995). A Text Book of Agricultural Statistics: Wiley Eastern Limited, New Delhi, India P 496. |
|
|
Sabaghnia N, Dehghani H, Alizadeh B, Mohghaddam M (2010). Interrelationships between seed yield and 20 related traits of 49 canola (Brassica napus L.) genotypes in non-stressed and water-stressed environments. Spanish Journal of Agricultural Research 8(2):356-370. |
|
|
SAS Institute INC. (2004). SAS/STAT user's guide. Version 9. Fourth Edition. Statistical Analysis Institute Inc., Cary North Carolina. |
|
|
Seyoum S (2003). Genetic divergence for seedling parameters and associations among agronomic traits in the Ethiopian coffee (Coffea arabica L.) germplasm M.Sc thesis, school of graduate studies of Alemaya University. |
|
|
Searle SR (1961). Phenotypic, genotypic and environmental correlation. Biometrics 17:474-480. |
|
|
Steiger D, Nagal C, Moore P, Morden C, Osgood R, Ming, R (2002). ALFP analysis of genetic diversity within and among Coffea arabica cultivars. Theory of Applied Genetics 105:209-215. |
|
|
Walyaro DJ, Van Der Vossen HAM (1979). Early determination of yield potential in arabica coffee by applying index selection. Euphytica 28:465-472. |
|
|
Williams WA, Jonesm MB, Demment, W (1990). A concise table for path analysis statistics. Agronomy Journal 82: 1022-1024. |
|
|
Wintgens JN (2004). Coffee: Growing, processing, sustainable production, a guide book for growers, processors, traders, and researchers. Wiley Vch Verlag GmbH & Co KGaA, Weinheium. |
|
|
Xie Q (2015). Physiological and genetic determination of yield and yield components in a bread wheat× spelt mapping population [Doctoral dissertation]. University of Nottingham. |
|
Copyright © 2024 Author(s) retain the copyright of this article.
This article is published under the terms of the Creative Commons Attribution License 4.0


