Full Length Research Paper

ABSTRACT
Characterization and conservation of germplasm is a critical step toward the genetic improvement of the crop. This study assessed variation in 257 common bean genotypes which included 207 accessions obtained the National Gene Bank of Kenya, 33 accessions from Kenya Agricultural and Livestock Research Organization (KALRO), 13 landraces collected from farmers’ fields and four commercial varieties for various agronomic traits. The experiments were laid out in a randomized complete block design with three replicates at Jomo Kenyatta University of Agriculture and Technology (Kenya) for four seasons between 2019 and 2020. Significant differences (P≤0.05) existed among the common bean accessions for all traits studied. Seed yield ranged from 220.6 to 4641.9 kg/ha (KNB0106) among the accessions with a mean of 1267.0 kg/ha. Significant (P ≤0.05) positive correlation was recorded for days to flowering and days to maturity (0.73), while 100-seed weight had a significantly negative correlation with the number of pods per plant (-0.66) and the number of seeds per pod (-0.65). High (>20%) broad-sense heritability was recorded for 100-seed weight (89.0%), days to flowering (76.8%), and grain yield (60.5%). Nineteen accessions that combined early maturity and high-yielding traits were identified. On average, higher seed yields were recorded for large-seeded and climbing genotypes compared to small-seeded and bush types. Common bean accessions characterized can be exploited in breeding programs.
Key words: Common bean, agronomic traits, Phaseolus vulgaris, variability, broad sense heritability.
INTRODUCTION
Common bean (Phaseolus vulgaris L.) is an important crop for human nutrition. It is a major source of protein, carbohydrates, dietary fiber, and essential minerals to a large population globally (Gepts et al., 2008). A wide diversity of traits exists in common bean with regard to growth habit, duration to maturity, resistance to biotic and abiotic stresses, seed size, seed color, and yield (Wortmann et al., 1998). These variations serve as genetic resources that have been extensively exploited in breeding programs to develop varieties (Pérez-Vega et al., 2010). Studies have shown that the common bean has two distinct centers of genetic differentiation, namely the Middle American and Andean gene pools (Bitocchi et al., 2012). The Andean bean types (large-seeded) are the most popular beans in Africa even though their yield has been reported to be lower compared to the middle American bean types (small-seeded) (Beebe, 2012).
Van Schoonhoven and Pastor-Corrales (1987) categorized growth habits into five groups ranging from determinate bush to indeterminate climbing. The bush types are preferred because they do not require support and are hence convenient for market production (Okii et al., 2014). Bush types are also popular for commercial production because they are early maturing and can be harvested mechanically thus require less labor. On the other hand, climbing common bean are popular in highland areas because they have higher yields and are ideal for small-scale farmers with a limited land size (Wortmann et al., 1998).
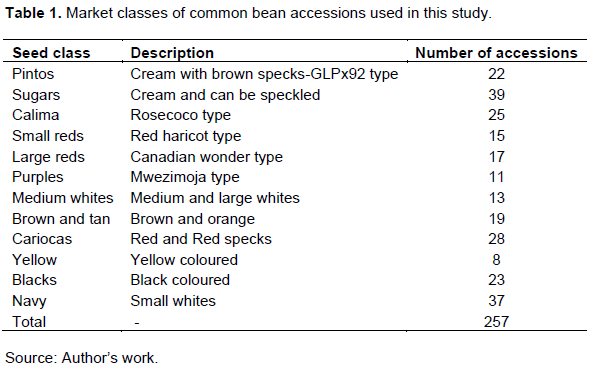
Preference for common bean grains varies among consumers depending on several parameters which include seed color and seed size. In eastern Africa, the Calima seed type (Red speckled or Rosecoco type) is the most popular followed by medium and small reds. Large reds including red kidney rank third in popularity, followed by navy, whites, purples, and black, respectively (Wortmann et al., 1998).
Heritability estimates of a trait indicate how much variation can be attributed to genetic variation and the environmental influence in the expression of the trait. The heritability estimates therefore aid a breeder to select a breeding procedure that will efficiently improve the performance of the genes involved (Yohannes et al., 2020).
Improving seed yield is a primary objective for most common bean breeding programs (Vandemark et al., 2014). Seed yield is a polygenic trait that is conditioned by three yield components, the number of pods per plant, the number of seeds per pod, and seed weight (Adams, 1967; Kamfwa et al., 2015). The knowledge of the association between these seed yield attributes may help in the selection of a suitable donor to improve this trait. The objective of this study was to assess common bean accessions for variation in yield related agronomic traits which are essential for characterization, conservation, and breeding.
MATERIALS AND METHODS
Field experimental site
Field experiments were carried out for four seasons at Jomo Kenyatta University of Agriculture and Technology (JKUAT) in Kiambu County Kenya. The site is located at coordinates 3o 35’South and 36o 35’ East at an elevation of 1520 m above sea level. The site experiences bimodal pattern of rainfall with an annual mean of 856 mm. Long rains occur between March and May while short rains occur between October and November with a monthly mean of 142 and 116 mm, respectively. The mean annual maximum and minimum temperatures are 20 and 30°C, respectively. The area falls under ecological zone four with three types of soils namely deep clay soils (vertisols).
Plant materials
A total of 257 common bean accessions were used in this study, accessions from the National Gene Bank of Kenya, 33 from Regional Agricultural Research Centre-Kenya Agricultural and Livestock Research Organization (KALRO)-Embu, 13 landraces collected from farmers’ fields and four commercial varieties (GLP-2; GLP-24, GLPx92 and GLP1192a). The growth habits of the genotypes were type I & II, III and IV with 124, 84 and 49 accessions, respectively. The genotypes belonged to different market classes found in the region (Table 1).
Experimental design and trial management
The experiment was conducted for four seasons during the long and short raining seasons of 2019 and 2020. The trial was laid out as a randomized complete block design with three replicates. At planting, the genotypes were separated into climbing and non-climber types to avoid shading of bush types. The bean lines were grown in single rows of 5 m in length. The bush genotypes were planted with an inter-row spacing of 40 cm while the climbing genotypes had an inter-row spacing of 50 cm, the intra-row spacing of all the genotypes was 20 cm. Compound N.P.K (17.17.17) fertilizer was applied at a rate of 200 kg/ha, evenly spread, and thoroughly mixed with soil. The bean seeds were planted and lightly covered with soil. The first manual weed control was conducted two weeks after emergence and the second one at 40 to 50 days thereafter. Insect pests and diseases were controlled by the application of chemical pesticides diazinon at a rate of 40 ml/20 L and 500 g/L pymetrozine at a rate of 400 to 600 g/ha. Before flowering, the climbing genotypes were supported with 1.5 m long sticks to prevent lodging.
Agronomic data collection
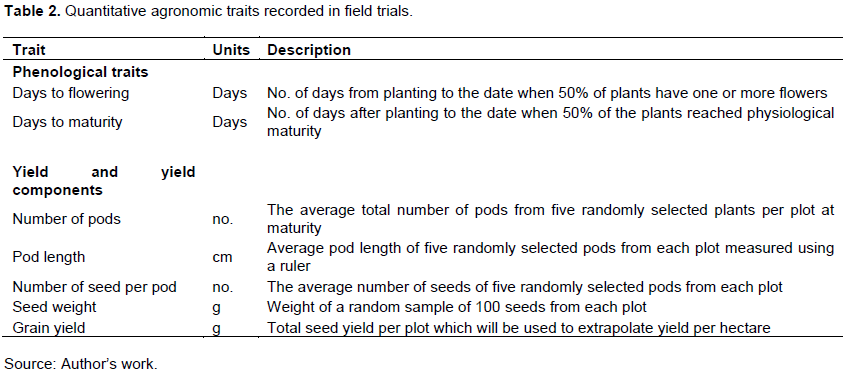
Data collection started one month after planting. The quantitative traits studied are described in Table 2.
Statistical analysis
Analysis of variance
Qualitative data collected was used to group the accessions into their growth habits and market classes. Quantitative data collected from field experiments were combined over seasons and analyzed using R software (version 4.0.2). All traits’ means were separated using Fisher’s Least Significance Difference test (LSD) at 5% level. The significance of correlations was tested at 0.05 and 0.01 levels of probability. Cluster analyses were carried out based on Euclidean distance method. Complete clustering method was used to determine the genetic relationship among genotypes based on the agronomic data.
Phenotypic and genotypic coefficient of variation
The estimates of phenotypic and genotypic coefficient of variation were calculated as described by Singh and Chaudhary (1985) as follows:
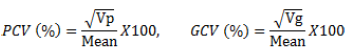
where PCV is the phenotypic coefficient of variance, Vp is the phenotypic variance, GCV is genotypic coefficient of variance, and Vg is the genotypic variance, GCV and PCV values were categorized as low (0-10%), moderate (10-20%) and high (20% and above) as indicated by Burton and de Vane (1953).
Heritability
Heritability was estimated as the ratio of genotypic variance to phenotypic variance as described by Singh and Chaudhary (1985).
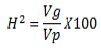
where H2 is broad-sense heritability, Vp is phenotypic variance and Vg is genotypic variance. Heritability percentage values were categorized as low (0-30%), moderate (30-60%), and high (60% and above) as described by Johnson et al. (1955).
RESULTS
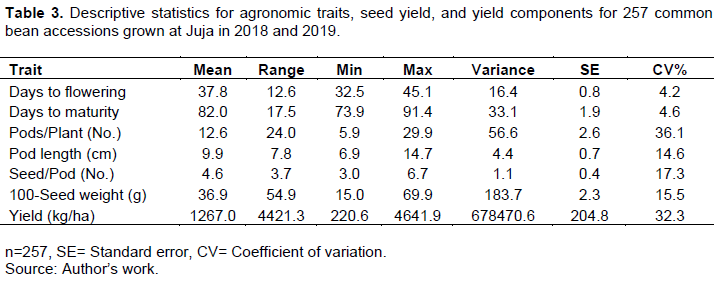
Descriptive statistics for agronomic and seed yield traits
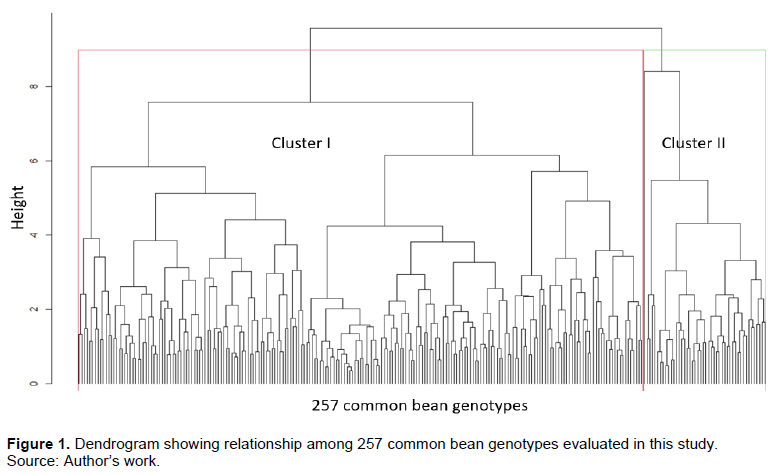
The means, range, variance, and coefficient of variation for recorded traits are summarized in Table 3. The coefficient of variation ranged from 4.2% (days to flowering) to 36.1% (number of pods per plant). The highest coefficient of variation registered was for the number of pods per plant and grain yield at 36.1 and 32.3%, respectively. Cluster analysis based on the agronomic traits grouped the 257 genotypes into two major groups. The largest group constituted 82.1% of the genotypes, which had the highest pod length, seed weight, and yield with a mean of 10.4 cm, 45.5 g and 1322.1 kgha-1, respectively. The second group constituted 17.9% of the genotypes and had the highest days to flowering, days to maturity, number of pods per plant and number of seeds per pod of 39.7 days, 84.1 days, 15.9, and 5.1 respectively (Figure 1).
Estimation of genetic variables for traits measured
The extent of variance components and heritability estimates of seven common bean traits are presented in Table 4. The phenotypic coefficient of variation ranged from 6.3% (days to maturity) to 51.4% (grain yield). Days to flowering and days to maturity recorded a low phenotypic coefficient of variation (0-10%) of 8.7 and 6.3%, respectively. On the other hand, pod length, seeds per pod, 100-seed weight, number of pods per plant, and grain yield showed a high phenotypic coefficient of variation (>20%) of 20.8, 22.8, 36.5, 43.6, and 51.4%, respectively (Table 4).
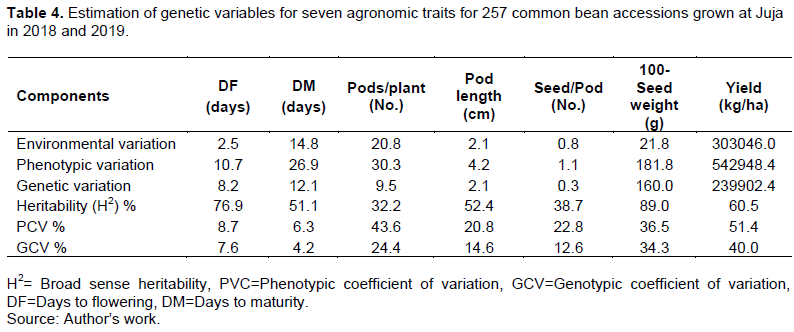
Genotypic coefficient of variation ranged from low (0-10%), moderate (10-20%) to high (>20%). Days to maturity and days to flowering had a low genotypic coefficient of variation of 4.2 and 7.6%, respectively, while the number of seeds per pod and pod length had a moderate genotypic coefficient of variation of 12.6 and 14.6%, respectively. High genotypic coefficients of variation were recorded for the number of pods per plant, 100-seed weight, and grain yield of 24.4, 34.3, and 40.0%, respectively (Table 4).
Grain yield, days to flowering and 100-seed weight recorded high broad-sense heritability (H2>0.6) of 60.5, 76.8, and 89.0%, respectively. In contrast, the number of pods per plant, number of seeds per pod, days to maturity, and pod length showed moderate broad sense heritability (H2=0.3-0.6) of 32.2, 38.7, 51.1, and 52.4%, respectively (Table 4).
Correlation between seed yield and yield components
The correlation coefficients among days to flowering, days to maturity, number of pods per plant, number of seeds per pod, 100-seed weight, and grain yield are presented in Table 5. A significant (P≤0.05) strong and positive correlation (0.73) was recorded between days to flowering and days to maturity. A moderate positive and significant association was revealed between pod length and 100-seed weight (0.51), between pods per plant and seed per pod (0.5) and between days to flowering and seeds per pod (0.43).
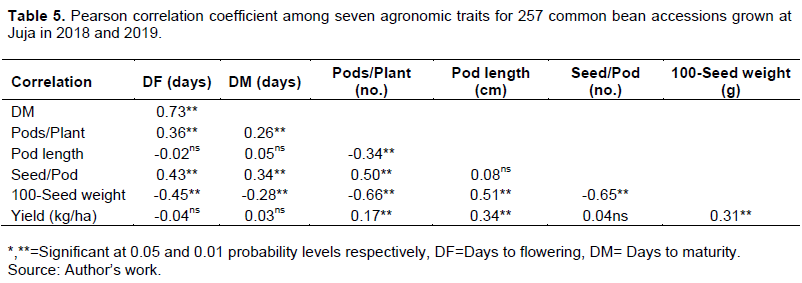
A significant positive but weak relationship was revealed between days to flowering and pods per plant (0.36), between days to maturity and number of seeds per pod (0.34), between pod length and grain yield (0.34), between 100 seed weight and grain yield (0.31), and between days to maturity and pods per plant (0.26). A significant extremely weak positive correlation of 0.17 was recorded between pods per plant and grain yield at P≤0.05 (Table 5).
A significant (P≤0.05) strong negative correlation was recorded between the number of pods per plant and 100-seed weight (-0.66) and between the number of seeds per pod and 100-seed weight (-0.65) among accessions. Furthermore, a significant moderate and negative relationship between days to maturity and 100-seed weight (-0.45) was recorded.
Finally, a significant but weak negative association between pods per plant and pod length (-0.34) and between days to maturity and 100-seed weight (-0.28) were also recorded (Table 5).
Means for days to flowering, days to maturity, number of pods per plant, pod length, number of seeds per pod, 100-seed weight and seed yield
There were highly significant (P≤0.05) differences for all the traits studied among the 257 common bean accessions. The seasonal and the interaction effect between season and common bean accessions also significantly influenced all the evaluated traits. For example, the mean for days to flowering, days to maturity, 100-seed weight, and grain yield were higher in long rain seasons than in short rain seasons. However, the average pods per plant and pod length were higher during the short rain than in long rain seasons (Supplementary Table 1).
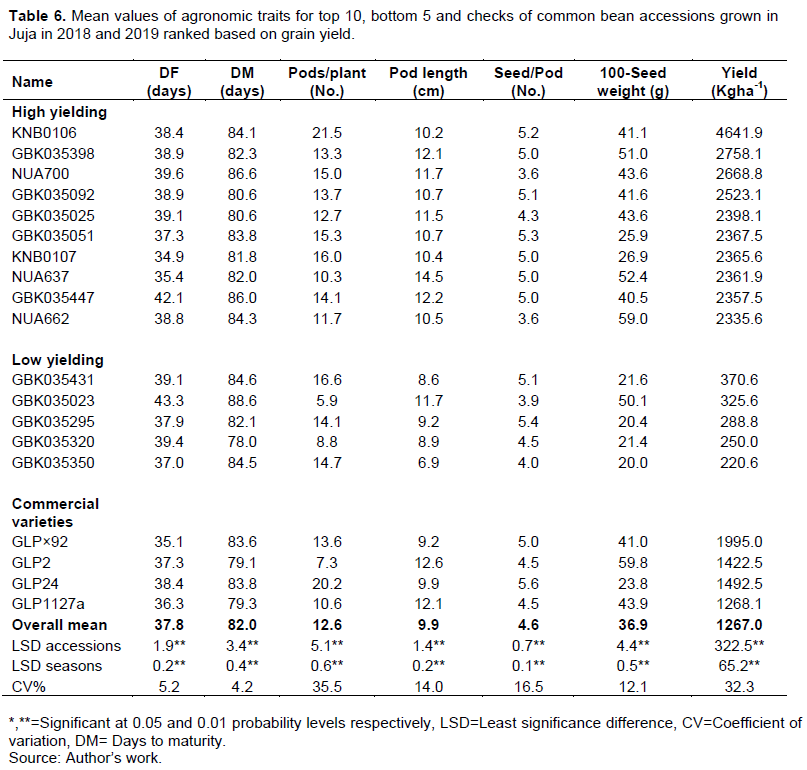
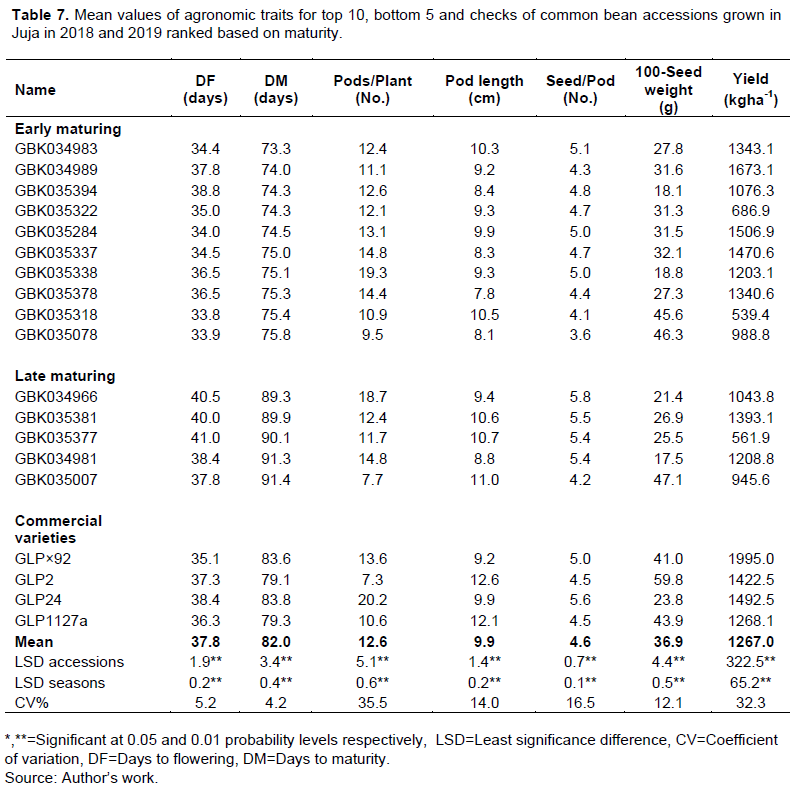
The period between flowering and maturity ranged from 35.5 (GBK035394) to 53.6 (GBK035007) days with a mean 44.1 days, this grain filling period varied from 41.9 (GLP 2) to 48.5 days (GLP×92) among the commercial varieties. Among the commercial varieties evaluated in this study, GLP×92 was the earliest to flower (35.1 days) and had the highest grain yield (1995 kg/ha). On the other hand, GLP2 was the earliest to mature (79.1 days) had the longest pods (12.6cm) and the highest 100-seed weight (59.8g), while GLP24 had the highest number of pods per plant (20.2) and the highest number of seeds per pod (5.6) (Table 6). However, 57 accessions flowered earlier than GLP×92, 69 accessions matured earlier GLP2 and 20 accessions out yielded GLP2 in grain yield (Supplementary Table 1). Nineteen accessions had shorter duration to maturity and higher yielded than the earliest maturing commercial variety GLP2 (Table 7 and Supplementary Table 1).
Mean grain yields for common bean seed classes
The average grain yield for various seed classes evaluated in this study ranged from 1535.7 kg/ha (Pinto) to 951.4 kg/ha (Navy). Pinto, sugars, calima, small reds, large reds, and purples seed classes had the higher yields (>1370 kg/ha), while medium white, brown and tan, cariocas, yellow, blacks, and navy seed classes had lower yields of 1200 kg/ha and below (Table 8).
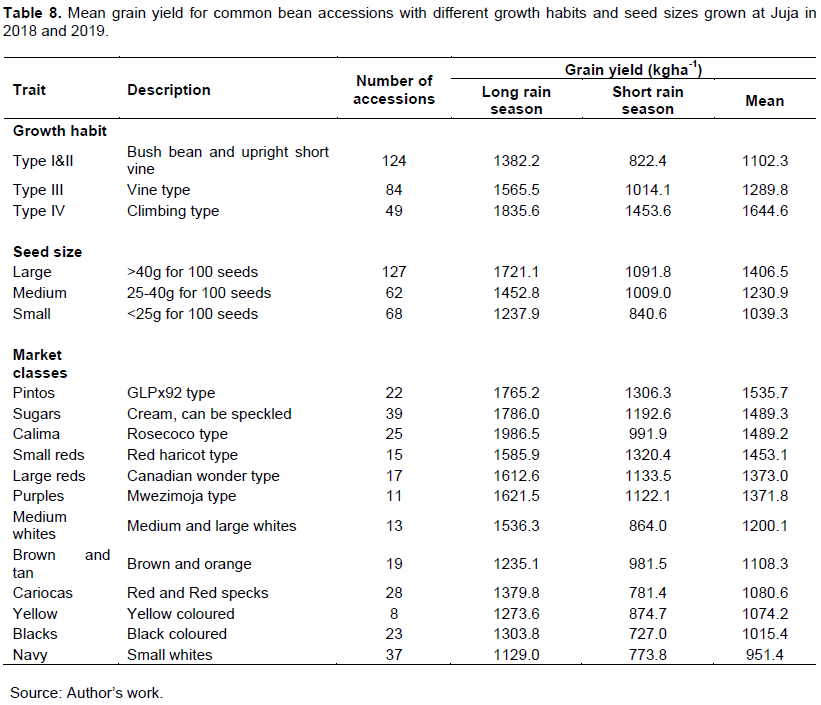
Mean grain yields for large, medium, and small-seeded common bean lines
The results revealed that the average grain yields varied with the seed size of the accessions, the large-seeded (>40 g) accessions had the highest yield of 1406.5 kg/ha, followed by the medium-sized (25-40 g) with an average of 1230.9 kg/ha, lastly, small-seeded (<25 g) had the lowest mean yields of 1039.3 kg/ha (Table 8).
Mean grain yields for bush, semi climber, and climbing common bean lines
The result shows that the mean grain yield varied with the growth habit of the accessions, accessions with climbing growth habit had the highest average grain yields of 1644.6 kg/ha, followed by semi climbers with an average yield of 1289.8 kg/ha and lastly, bush types had the lowest yields of 1102.3 kg/ha (Table 8).
DISCUSSION
In the current study, grain yield and number of pods per plant had the highest coefficient of variation, indicating a strong environmental influence among the genotypes evaluated for these traits. Similar results were obtained for seed yield (50.7%) and the number of pods per plant (38.9) in a previous study conducted by Negahi et al. (2014) using 284 genotypes. Cluster analysis grouped the common bean genotypes into two major groups. The cluster with majority (82.1%) of genotypes contained the large-seeded (> 45 g 100-seed weight) genotypes of Andean gene pool which are reported to be adapted to higher altitude and cooler environments. The other groups consisted of small-seeded accessions with a mean 100-seed weight of 23.9 g of Mesoamerican gene pool which is adapted to lower altitudes and higher temperatures (Beebe et al., 2011).
The coefficient of variation is a scale that can be used to compare the extent of variation of different traits with different measurement units. According to Burton and de Vane (1953), phenotypic and genotypic coefficients of variation are categorized as 0-10% low, 10-20% high, and above 20% as high. The results show high genotypic coefficients of variations for 100-seed weight, the number of pods per plant, and grain yield, which indicates high genetic variation in these traits among the common bean accessions evaluated. Similar results have been reported for number pods per plant, 100-seed weight, and grain yield by Negahi et al. (2014), who observed a high phenotypic coefficient of variation of 53.3, 38.9, and 50.7% for 100-seed weight, the number of pods per plant, and seed yield, respectively. On the contrary, a low genotypic coefficient of variation for 100-seed weight, number of pods per plant, and seed yield of 4.6, 4.67, and 2.2%, respectively, have also been reported in a previous study that evaluated 52 common bean landraces. The low genotypic coefficient could be attributed to low genetic diversity among the accessions used in the study (Anunda et al., 2019).
The significant seasonal differences for various traits between long and short rains are due to differences in environmental conditions, especially temperatures and rainfall. Lower temperatures prevail during long rain season, causing a prolonged vegetative state that delay flower and maturity. Heavy rainfall experienced during long rains adversely affects flower fertilization, resulting in reduced pod sets hence the lower number of pods in some cultivars during these seasons. On the other hand, short rain seasons tend to have higher temperatures that lead to early termination of the vegetative state and initiation of the reproductive phase (Mbugua et al., 2006). Genotypes that flower and mature early tend to be more adapted to environment of growth than late maturing genotypes (Amanullah et al., 2006). In this study, nineteen accessions were found to combine early maturity and reasonable yield higher than that of earliest maturing commercial variety GLP2.
Variety GLP 2 was the earliest to mature among the commercial varieties, however, there were 19 bean accessions that had higher seed yield and matured earlier than this variety. These bean accessions are ideal for cultivation in areas with a short rainy season. On the other hand, the variety GLP×92 was the earliest to flower, the latest to mature, and had the highest seed yield among the commercial varieties. Therefore, GLP×92 had a prolonged grain filling period that led to higher seed yield. Beebe et al. (2013) found that that drought tolerant lines with improved yields also presented shorter period to maturity.
The high yielding potential of climbing common bean was revealed in this study. However, climbing genotypes are labor-intensive as they require staking and may not be ideal for mixed cropping. The results agree with Wortmann et al. (1998) who reported that common beans with climbing growth habits are higher-yielding and hence ideal for small-scale farmers with a limited size of land in highland areas. Oppositely, the bush types are preferred because they do not require support and are early maturing, hence convenient for commercial production (Wortmann et al., 1998; Okii et al., 2014).
The results show that pinto, sugars, calima, small reds, large reds, and purples seed classes were more adapted to the environment in which the experiment was conducted compared to medium white, brown and tan, cariocas, yellows, blacks, and navy seed classes. It has been reported that consumer preference for common beans depends on seed size and color among other characteristics. In eastern Africa, the calima seed type (red speckled) is highly popular and accounts for about 22% of common bean production. Medium and small reds follow in consumer preference accounting for approximately 20% of the production. Large reds including red kidney rank third in popularity accounting for about 10% of common beans produced, navy, whites, purples, and black follow in popularity, respectively (Wortmann et al., 1998). The results show that the popular seed classes in the region were the highest yielding in this study, which could have resulted from continuous selection by local common bean farmers that improved their adaptability.
Common bean varieties vary in seed size, those that weigh less than 25 g per 100 seeds are classified as small-seeded while those that range from 25 to 40 g are classified as medium-sized, and those that weigh more than 40 g are classified as large-seeded (Rau et al., 2010; Lei et al., 2020). The result in this study indicates that large-seeded accessions are more adapted in this region, unlike the medium and small-seeded genotypes. Based on seed size, the common bean has been categorized into two distinct centers of origin, namely Mesoamerican and Andean gene pools (Blair et al., 2007; Burle et al., 2010). Andean gene pool is generally large-seeded and adapted to relatively higher altitudes and lower temperatures. In contrast, the Mesoamerican gene pool is small-seeded and adapted to lower altitudes and higher temperatures (Beebe et al., 2011).
Heritability estimates indicate how much variation in a trait can be attributed to genetic variation, which helps breeders to select based on the phenotypic performance of a trait. Based on the categorization of heritability by Johnson et al. (1955), the traits days to flowering, 100-seed weight, and grain yield traits recorded a high broad-sense heritability (>60%). This indicates that the performance of these traits was majorly due to genetic differences and could be improved through selection based on the trait itself. Yohannes et al. (2020) reported a high broad-sense heritability of days to maturity and 100-seed weight of 86.7 and 95.3%, respectively, and a moderate broad-sense heritability for days to flowering and number of seeds per pod of 40, and 51.6%, respectively.
Grain yield is a polygenic trait that is conditioned by three yield components, the number of pods per plant, the number of seeds per pod, and seed weight (Kamfwa et al., 2015). Consequently, the knowledge of the association between these seed yield attributes may help in selecting an excellent donor to improve this trait through indirect selection. A target trait can be improved through indirect selection via other traits. A strong positive relationship (0.73) between days to flowering and days to maturity indicates that days to flowering can be used to predict days to maturity for common bean accessions. Strongly associated traits are usually under the influence of the same gene or genes located close together on the chromosome and can both be selected simultaneously (Lobo, 2008). Days to flowering have been reported to be under the control of dominance and additive gene effect with the dominance effect being lower, and when present it reduces the number of days to flowering (Mendes et al., 2008). A similar correlation result (0.7) between days to flowering and days to maturity was reported in a previous study conducted by Kamfwa et al. (2015).
The weak and moderate positive correlation between days to flowering and number of pods per plant (0.36) and between days to flowering and number of seeds per pod (0.43) indicates that the number of pods per plant and number of seeds per pod is, to an extent, influenced by duration to flowering or time of flowering. For a crop that is largely self-pollinated like the common bean, pollination vectors may not be a limiting factor but the survival of pods and seeds after pollination may be affected by the competition of photosynthetic assimilates, soil nutrients, and water. These results agree with a previous study conducted by Marzooghian et al. (2014), who reported a positive correlation between days to flowering with both the number of pods per plant (0.36) and the number of seeds per pod (0.29).
The significant positive but weak relationship between grain yield and number of pods per plant (0.17), pod length (0.34) and 100-seed weight (0.31) indicate that these traits influence grain yields and should be put into consideration during selection to improve grain yield. Strong positive correlations between seed yield per plant and the number of pods per plant (0.67) (Anunda et al., 2019) have also been reported. A significant correlation of 0.51 between 100-seed weight and pod length suggests that large-seeded genotypes tend to have longer pods. Similar correlation result of 0.48 between 100-seed weight and pod length was reported by Okii et al. (2014).
A significant strong negative correlation between 100-seed weight and the number of pods per plant and between 100-seed weight and number of seeds per pod indicate compensation among yield components (Adams 1967). This negative association between yield components means that selecting for a greater number of pods per plant would lead to small-seeded plants, and selection for large-seeded genotypes would lead to plants with low seed locules per pod. It is critical to understand the nature of this negative relationship if it is independent of competition or due to competition for a limited resource.
Similar negative correlation results between 100-seed weight with both number of pods per plant and number of seeds per pod were reported by Negahi et al. (2014) and Kamfwa et al. (2015). However, Kamfwa et al. (2015) reported weak negative correlation between seed weight and the number of pods per plant (-0.17) and between the number of seeds per plant (-0.38) and days to maturity (-0.27).
CONCLUSION
The results showed high phenotypic and genotypic variation for 100-seed weight, the number of pods per plant, and grain yield. Higher yields were obtained during long rain seasons.
The traits days to flowering, 100-seed weight, and grain yield showed high broad-sense heritability. Grain yield had weak positive correlations with the number of pods per plant, pod length, and 100-seed weight. Large-seeded, climbing, and popular (pinto, calima, small reds, and purples) bean accessions had higher yields.
The study identified nineteen bean accessions that combined early maturity and high-yielding traits.
Common bean accessions evaluated in this study showed heritable variation that could be exploited in breeding programs.
CONFLICT OF INTERESTS
The authors have not declared any conflict of interests.
ACKNOWLEDGEMENT
The authors appreciate the financial support of VLIR-UOS Belgium under Grant number KE20171U037A101 extended to Jomo Kenyatta University of Agriculture and Technology (JKUAT) through the Legume Centre of Excellence for Food and Nutrition Security (LCEFoNS) Project. The members of staff at Jomo Kenyatta University of Agriculture and Technology, Horticulture and Food Security Department, and Vrije Universiteit Brussel (VUB), Laboratory of Plant Genetics are highly appreciated for their technical support. Great thanks to the National Gene Bank of Kenya, Kenya Agricultural and Livestock Research Organisation (KALRO)-Embu for providing the common bean accessions used for the study.
REFERENCES
|
Adams W (1967). Basis of yield components compensation in crop plants with special reference to the field bean, Phaseolus vulgaris. Crop Science 7(5):505-510 |
|
|
Amanullah, Khan AA, Nawab K, Sohail Q (2006). Performance of promising common bean (Phaseolus vulgaris L.) germplasm at Kala-Swat. Pakistan Journal of Biological Sciences 9(14):2642-2646 |
|
|
Anunda HN, Nyaboga EN, Amugune NO (2019). Evaluation of genetic variability, heritability, genetic advance and correlation for agronomic and yield components in common bean landraces from southwestern Kenya. Journal of Plant Breeding and Crop Science 11(5):144-147 |
|
|
Beebe S (2012). Common bean breeding in tropics. In: Janick J. (ed) Plant breeding Reviews 36:357-426 |
|
|
Beebe S, Ramirez J, Jarvis A, Rao I, Mosquera G(2011). Genetic improvement of common beans and the challenge of climate change. In: Yadav s, Redden J, Hatfield L, Lotze-Campen, Hall E (ed) Crop Adaptation to Climate change. Wiley-Blackwell, Oxford, pp356-369 |
|
|
Beebe SE, Rao IM, Blair MW (2013). Phenotyping common beans for adaptation to drought. Frontier in Physiology 4:35. |
|
|
Bitocchi L, Nanini E, Belluci M, Rossi A(2012). Mesoamerican origin of the common bean (Phaseolus vulgaris L.) is revealed by sequence data. Proceedings of the National Academy of Sciences USA 109(14):788-796 |
|
|
Blair M, Diaz J, Hildago R, Diaz L, Duque M (2007). Microsatellite characterization of Andean races of common bean (Phaseolus vulgaris L.). Theoretical and Applied Genetics 116(1):29-43 |
|
|
Burle M, Fonseca J, Kami J, Gepts P (2010). Microsatellite diversity and genetic structure among common bean (Phaseolus vulgaris L.) landraces in Brazil, a secondary center of diversity. Theoretical and Applied Genetics 121:801-813 |
|
|
Burton GW, De vane EH(1953). Estimating heritability in tall fescue (Festuca arundinacea) from replicated clonal material. Agrononomy Journal 45(10):478-481 |
|
|
Gepts P, Aragao F, de Barros E, Blair M (2008). Genome of Phaseolus beans, a major source of dietary protein and micronutrients in the tropics. In: Moore P, Ming R (ed) Plant Genetics and Genomics: Crops and Models Springer New York pp. 113-143. |
|
|
Johnson HW, Robinson H, Comstock R (1955). Estimates of genetic and environmental variability in soybean. Agronomy Journal 47(7):314-318. |
|
|
Kamfwa K, Cichy K, Kelly J (2015). Genome wide association study for agronomic traits in common bean. The Plant Genome 8:1-12. |
|
|
Lei L, Wang L, Wang S and Wu J (2020). Marker-Trait Association Analysis of Seed Traits in Accessions of Common Bean (Phaseolus vulgaris L.) in China. Frontiers in Genetics 11:698. |
|
|
Lobo I (2008). One gene can affect multiple traits. Nature education 1(1):10 |
|
|
Marzooghian A, Moghaddam M, Valizadeh M, Kooshki MH (2014). Genetic diversity of common bean genotypes as revealed by seed storage proteins and some agronomic traits. Plant Breeding and Seed Science 67:125-137 |
|
|
Mbugua GW, Wachiuri SM, Karoga JI, Kimamira JK, Ndegwa AM, Waigainjo MM(2006). Farmer-participatory evaluation of dry bean varieties with multiple constraints resistance in central Kenya, KARI-CIAT report P 8. |
|
|
Mendes M, Botello F, Ramalho M, Abreu A, Furtini I (2008). Genetic control of the number of days to flowering in common bean. Crop Breeding and Applied Biotechnology 8:279-282 |
|
|
Negahi A, Bihamta MR, Negahi Z, Alidoust M (2014). Evaluation of some agronomical and morphological traits in Iranian and exotic common bean (Phaseolus vulgaris L.) Agricultural Communications 2(3):22-26 |
|
|
Okii D, Tukamuhabwa P, Odong T, Namayanja A, Mukabaranga J, Paparu P, Gepts P (2014). Morphological diversity of tropical common bean germplasm. African Crop Science Journal 22(1):59-67 |
|
|
Pérez-Vega P, Pañeda A, Rodríguez-Suárez C, Campa A, Giraldez R, Ferreira JJ (2010). Mapping QTLs for morph-agronomic and seed quality traits in RILs population of common bean (Phaseolus vulgaris L.). Theoretical and Applied Genetics 120:1367-1380. |
|
|
Rau D, Nanni l, Attene G, Bellucci E (2010). Beans in Europe: origin and structure of the European landraces of Phaseolus vulgaris L. Theoretical and Applied Genetics 121:829-843. |
|
|
Singh RK, Chaudhary BD (1985). Biometrical Methods in Quantitative Genetic Analysis. Kalyani Publishers, New Delhi, India pp. 78-101 |
|
|
Van Schoonhoven A, Pastor-Corrales MA (1987). Standard system for the evaluation of bean germplasm. International Center for Tropical Agriculture (CIAT)-Cali, Colombia, p. 54 |
|
|
Vandemark GJ, Brick MA, Orsono JM, Kelly JD, Urrea CA (2014). Edible Grain Legumes. In: Smith S, Diers B, Specht J, Carver B (ed) Yield Gains in Major U.S. Field Crops. Madison pp 87-124. |
|
|
Wortmann C, Kirkby R, Eledu, C, Allen D (1998). Atlas of common bean (Phaseolus vulgaris L.) production in Africa. International Center for Tropical Agriculture (CIAT)-Pan-Africa Bean Research Alliance Cali, Colombia. publications (297):129. |
|
|
Yohannes S, Loha G, Gessese MK (2020). Performance Evaluation of Common Bean (Phaseolus vulgaris L.) Genotypes for Yield and Related Traits at Areka, Southern Ethiopia. Advances in Agriculture 2020:1497530. |
|
Copyright © 2024 Author(s) retain the copyright of this article.
This article is published under the terms of the Creative Commons Attribution License 4.0


