Full Length Research Paper

ABSTRACT
The present study attempts to analyze the magnitude of GxE interaction and evaluates the adaptability and stability of open pollinated maize genotypes for grain yield, using AMMI (Additive Main Effects and Multiplicative Interaction) model. The field experiment was conducted for two consecutive years during the off seasons of 2016/17 and 2017/18 at three locations namely, Awra, Dalifage and Dubti. The experiment in each location was laid out using RCBD with three replications. The pooled analysis of variance over environments for AMMI model was highly significant (P<0.01). The results revealed the existence of considerable variation among the genotypes and the environments for grain yield, indicating the differential performance of genotypes across the environments. Based on the AMMI model genotypes Melkassa-2 and Melkassa-7 were the most stable varieties with lower Interaction (IPCA) score and lowest ASV rank. Genotypes Melkassa-3 and Melkassa-4 had shown specific adaptation to environment Awra and Dalifage, respectively; indicating that these genotypes were more sensitive to environmental changes and have better adaptation for specific locations. The results of AMMI biplots were also in agreement with the results of ASV. Thus, the whole analysis generally suggested that maize grain yield was highly influenced by environments and G x E interaction. Thus, testing OPV maize varieties in more seasons and locations could enhance breeding efficiency with respect to genotypic stability and adaptation across environments.
Key words: AMMI, ASV, G x E interaction, IPCA, open-pollinated maize.
INTRODUCTION
Maize (Zea mays L.) (2n=20), which is also known as corn, belongs to the family Poceaceae. Maize is the most important crop worldwide and basic trade product recurring ingredient for millions of people in Sub-Saharan Africa (Nzuve et al., 2013). It is the third most significant cereal crop in the world, after wheat and rice, in terms of cultivated area, production and grain yield. Maize is a multipurpose crop that acclimates effortlessly to a wide variety of production set of conditions (FAO, 2015). Thus, maize is one of the most important cereals in Sub-Saharan Africa (SSA) and a staple food for an estimated 50% of the population. It is an important source of carbohydrate, protein, iron, vitamin B, and minerals (Apraku and Akinwale, 2011).
The genetic diversity of maize, as cross pollinated crop, is very wide for management in its genetic improvement, because landraces reveal important phonological and morphological distinction and allelic polymorphism (Anley et al., 2013).
One of the most exigent issues in plant breeding progress is to perfectly dissect genotype x environment (G x E) interaction, because it is based on figures from multi-environment experiments. In most trails, the G x E interaction is witnessed and then modeled statistically and elucidated. Genotype x environment interaction adjusts the reasonable grain yield of genotypes in diverse environments and makes it hard to select the better ones (Miah and Uddin, 2016).
Clarification of genotype x environment (G x E) interaction can be more supported by statistical modeling. Models can be linear formulations such as joint-regression, multivariate clustering techniques, multiplicative formulations such as additive main effects and multiplicative interaction (AMMI) or nonparametric methods (Albert, 2004). Modeling G x E interaction in Meta environments assists to clarify consistency of breeding materials, however, this thought has been well predetermined in various ways, and a number of stability parameters have been developed. Selection processes in plant breeding depends critically on the quality of phenotype predictions (Malosetti et al., 2013). The phenotype is classically predicted as a function of genotypic and environmental information. Models for phenotype prediction contain a mixture of statistical, genetic and physiological elements (Yong-Jian et al., 2010; Bustos-korts et al., 2016).
Although a number of methods are employed for genotype by environment interaction (GEI) and phenotypic stability analysis, Additive Main Effect and Multiplicative Interaction (AMMI) model is more suitable and simplify instantaneous choice of genotypes for stability. The model helps in establishing the relationship of genotypes, environment and their interaction (Giridhar et al., 2016). The AMMI model has been intensively used recently, since it incorporates both the classical additive main effects for GEI and the multiplicative components into an integrated least square analysis and thus become more effective in selection of stable genotypes (Dewi et al., 2014; Frutos et al., 2015).
However, the AMMI model alone does not provide measure for a quantitative stability. For this reason, AMMI Stability Value (ASV) was proposed by Purchase (1997). The lower the ASV value, the lower the genotype’s interaction to the environment and consequently the variety is said to be more stable. The most stable and adapted genotypes can be identified using ASV as that of Lin and Binns (1986) method.
Maize is one of the most important crops both in terms of production area and productivity and the basic staple food for Afar pastoral community of Ethiopia. Maize is produced mostly by small holder resource poor farmers under irrigation. In spite of this, the production of maize in farmer’s fields in the region is low. The average grain yields of maize are around 18.9 tons ha-1 (Solomon et al., 2008). A number of maize varieties were developed and released to the rift valley areas by different research centers, but most of them failed to adapt due to the dynamics of the growing environment and climate change effects in the area. In spite of this; adaptation of released varieties has to be conducted in multi environment before they are distributed to the farmers. However, limited efforts have been made to the adaptation of released varieties of maize in the low-land agro-ecologies where it is widely produced and utilized by the community. Hence, G x E interaction analysis or testing genotypes for wide and specific adaptation to a micro environment is a paramount for yield stability of maize varieties. Therefore, the present study was undertaken to analyze the magnitude of GEI and evaluate the adaptability and stability of open pollinated maize genotypes for grain yield, using Additive Main Effects and Multiplicative Interaction (AMMI) model.
MATERIALS AND METHODS
Description of the study area
The study was conducted in three locations, namely, Awra, Dalifage and Dubti of the Afar Regional State. Afar region is situated in the great rift-valley, the topography of the region is predominantly arid and semi-arid flat-land characterized by lowland climate. Pastoralism is the predominant economic and social mainstay of the population of Afar with around 88% of the total population livelihood depending on rearing, and moving with livestock herds. Agro-Pastoralism (estimated at 12%) involves production of crops, including maize, sorghum, vegetables and fruits to a lesser extent, using some permanent and temporary rivers in the region. The geographic descriptions of the study area are summarized follows: Awra is located at coordinate of 11°36’N and 39°59’E, located 208 km away from Samara with an altitude of 939 masl. The mean Max and Min temperature is 33.3 and 21°C having hot and dry weather with annual rain fall of 410 mm and a predominant soil type of silty-clay (WARC and APARI, 2007).
Dalifage is located in 11° 03’N and 40°13’E, in (Zone-5) of Afar Regional State and is found 235 km west of Samara. The elevation of the area is 695 masl, with low and erratic rainfall. The weather is hot and dry with mean Max and Min temperature ranging between 37 and 23°C (WARC and APARI, 2007).
Dubti is one of the districts in Zone-1 of Afar Regional State, located in 11° 33’ N and 40° 44’ E. The Max-Min temperature during the main rainy season is 42 to 31°C with annual rain fall of 100-200 mm and the predominant soil type is fluvisol (WARC and APARI, 2007).
Experimental materials and design
Six open pollinated maize genotypes namely Melkassa-1, Melkassa-2, Melkassa-3, Melkassa-4, Melkassa-7 and Melkassa-6Q were collected from Melkassa National Maize Research Coordinating Center and planted at three locations: Awra, Dalifage and Dubti Pastoral and A/pastoral Research Centers in 2016/2017 and 2017/2018 off seasons. In each location, the experiment was laid-out in randomized complete block design (RCBD) with three replications. Each plot was 11.25 m2 size having 5 rows of 3 m long with row spacing of 0.75 m. The harvested plot size was 6.75 m2 (3- rows from the center of each plot). Agronomic and cultural practices, like fertilizer, weeding and irrigation were applied as required based on recommendations.
Data collection
Ten competitive plants were randomly selected from the middle rows of each plot and the following morphological data were recorded on plant basis: days of silking (DSL), days of maturity (DM), ear per plant (EPL), ear length (EL), leaf per plant (LPL), plant height (PLH), cob weight (CW), row kernel number (RKN), number of kernel per row (NKPR), hundred kernel weight (HKW) and grain yield per hectare (GYPH). Mean grain yield was estimated for each genotype at each location and season.
Statistical methods and data analysis
The data on grain yield and yield related traits in six environments were subjected to pooled analysis of variance using Crop Stat 7.2 (IRRI, 2009). The AMMI model is a hybrid model incorporating both ANOVA (for additive component) and PCA (for multiplicative component) for analysing two way (G x E) data structures. To show a clear insight into specific GEI combination and the general pattern of adaptation, a biplot of varieties and environments was done. The AMMI biplot is developed by placing both genotype and environment means on the abscissa (X- axis) and the respective PCA axis, eigen vector on the Y- axis. In the AMMI model, the contribution of each genotype and each environment to the G x E interaction is valued by using the Biplot graphic representation as suggested by Zobel et al. (1988). The equation for AMMI model is represented as:
Yij=µ + gi +ej +Σλk +αikyjk +Rij
Where, Yij is the yield of ith-genotypes in jth-environment; µ is the overall mean; gi is the effect of the ith genotype; ej is the effect of the jth environment; λk is the eigen value of the PCA for axis k. Then αik and yjk are the genotype and environment principal component scores for axis k, respectively, and Rij is the residual term. Environment and genotype PCA scores are expressed as unit vector times the square root of λk.
In order to rank the genotypes in terms of stability, AMMI stability value (ASV) was employed for each genotype following the procedure proposed by Purchase (1997) as follows:
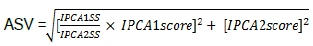
Where, ASV AMMI Stability Value; IPCA1and IPCA2 are Interaction Principal Component Axis one and Axis two; SS = sum of squares.
The ASV is the distance from zero in a two dimensional scatter-gram of IPCA1 scores against IPCA2 scores. Since the IPCA1 score contributes more to G x E sum of squares, it has to be weighted by the proportional difference between IPCA1 and IPCA2 scores to compensate for the relative contribution of IPCA1 and IPCA2 to total G x E sum of squares (SS).
RESULTS AND DISCUSSION
AMMI analysis
Additive Main Effect and Multiplicative Interaction (AMMI) analysis of variance for the data on yield (t/ha) showed that all the three variance components genotype (G), environment (E) and GEI were highly significant at P< 0.01; indicating the existence of considerable variability among the tested varieties (Table 1). Similar results were reported by Solomon et al. (2008) and Anley et al. (2013).
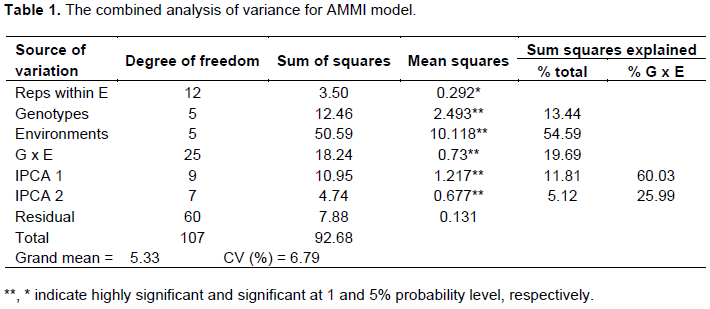
However, the variance due to environments accounts for 55% of the total variation and was about 4 times greater than that of the variance due to genotypes. The higher proportion of environmental variance may be due to the high variation in soil types and weather conditions among the environments. This suggested that the yield potential of OPV maize is greatly influenced by environmental factors.
Genotype x environment interaction (GEI) was further partitioned into two Interaction Principal Component Axes. The AMMI result also showed that the first and second Interaction Principal Component Axis (IPCA1 and IPCA2) explained about 86.2% of the interaction sum squares, indicating that the first two IPCA are sufficient to explain GEI in grain yield of maize genotypes. This result is in harmony with some previous findings (Nzuve et al., 2013; Kumar and Singh, 2015; Kumar et al., 2014; Miah and Uddin, 2016); they indicated that AMMI with only two interaction principal component axes was the best predictive model. IPCA1 captures about 91.0% of the interaction sum of squares and the rest 9% were captured by IPCA2. IPCA scores of genotypes and environments were both positive and negative, thus, representing the principal source of variation for any crossover interaction.
Mean performance of open pollinated maize genotypes
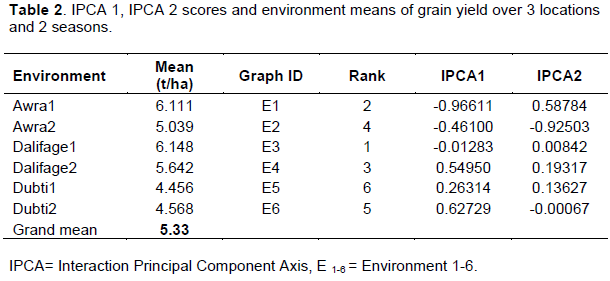
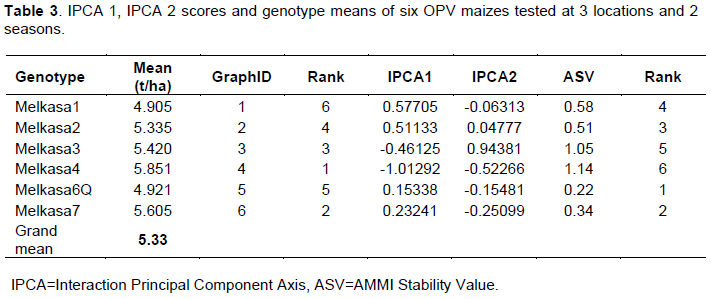
Average environment grain yield varied between 4.46 t/ha for Dubti-1 and 6.18 t/ha for Dalifage-1 (Table 2). Melkasa-4 was the highest yielding genotype with average grain yield of 5.85 t/ha, followed by Melkasa-7 with average grain yield of 5.62 t/ha. The lowest yielding genotype was Melkasa-1 with average grain yield of 4.91 t/ha (Table 3). The genotypes showed varied performance in response to the test environments, thus contributed to greater variation in GEI; similar results were reported by Giridhar et al. (2016). GEI diminishes the efficacy of genotypes by confounding their yield potential, which indicates the relevance of evaluating the adaptability and stability of genotypes across multi environments.
ASV analysis
Table 3 also presents the AMMI stability value (ASV) and ranking with IPCA1 and 2 scores for each maize variety. In ASV method, a variety with high mean yield and least ASV score is the most stable (Purchase et al., 2000).
Accordingly, the variety Melkasa-7 had higher mean yield (above the grand mean) with lower ASV value and was considered as the most stable across all environments, followed by Melkasa-2. Whereas, Melkasa-3 and Melkasa-4 were the most unstable varieties, as they exhibited largest ASV ranks. Though these genotypes, having higher mean yield over the grand mean, are suited to specific environments, this result is incongruence with the result of AMMI biplot. However, the remaining varieties, whatever ASV rank they have, since they had under average yield performance, were considered as unsuitable to any environment.
Biplot analysis
The results of AMMI analysis further enlightened the relative contribution of the first two IPCA axes to the interaction effects by plotting with genotype and environment means as presented in Figures 1 and 2.The mean performance and PCA1 scores for both the varieties and environments used to construct the biplots are presented in Tables 2 and 3. In the biplot, environments are designated by the letter ‘E’ followed by numbers 1 to 6 as suffix (Table 2 and Figure 1), while genotypes represented by numbers from 1 to 6 (Table 3, Figure 1). The quadrants in the graph represented (QI and QII) higher mean, (QIII and QIV) lower mean, (QI and QIV) +ve IPCA1 and (QII and QIII) –ve IPCA1 scores (Figure 1). When a variety and environment have the same sign on PCA1 axis, their interaction is positive and if opposite, their interaction is negative. Thus, if a variety has a PCA1 score near to zero, it has small interaction effect and was considered as stable over wide environments. Conversely, varieties with high mean yield and large PCA scores were considered as explicitly adapted to specific environments (Abdi and Williams, 2010; Askari et al., 2017; Mustapha and Bakari, 2014).
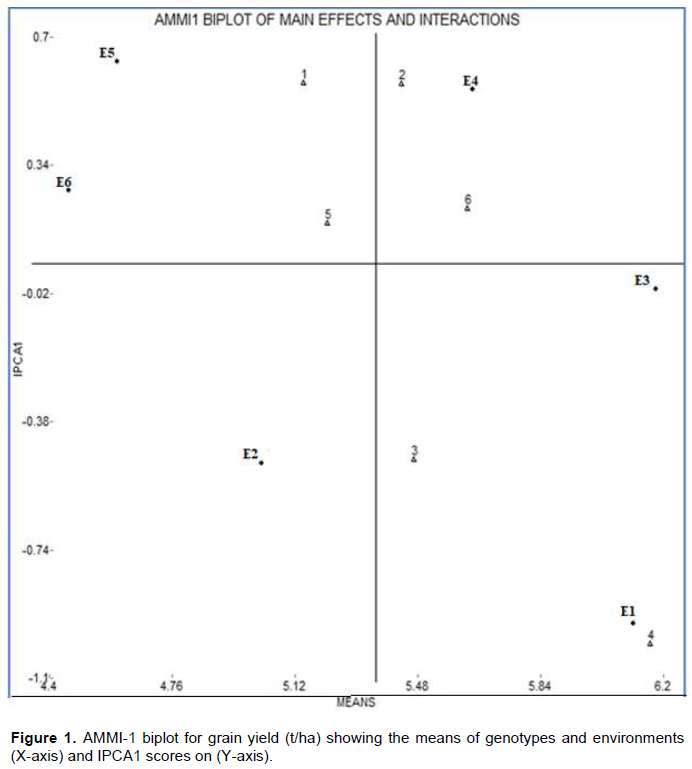
Accordingly, Dalifage-1 (E3) was the most stable environment having highest mean and lowest PCA score. Dalifage-2 (E4) was the next stable environment with higher mean yield and moderate interaction effects. These environments are most suitable for synthesizing hybrids due to low interaction effects. However, environments Dubti-1 (E5) and Dubti-2 (E6) showed lower mean yield and high interaction effects, hence they were considered as unfavorable for the present set of genotypes. Similarly, Awra-2 (E2) had negative interaction effects with most of the genotypes with mean yield below the grand mean and was considered as unstable environment (Figure 1). Although Awra-1 (E1) had above average grain yield, since it interacted negatively with most of the genotypes, it is suitable for specific adaptation with high mean yield. Hence, it is more favorable for Melkasa-4. Similar results were reported by Nzuve et al. (2013) and Ndhlela et al. (2014).
Regarding the scattered plot of genotypes, Melkassa-7 (genotype no.6) had higher mean yield with very low interaction effects and it can be regarded as the most stable for seed yield across environments, which is consistent with the ASV result. The two high yielder varieties: Melkasa-3 and Melkasa-4 (no. 3 and 4) had higher mean yield above the grand mean, but since they exhibited high interaction effects, they are desirable for specific adaptation in favorable environments with high mean yield; whereas, Melkasa-2 (no.2) was most favored in Awra1 (E1). As it interacted negatively with most of the environments, it is best suited for unfavorable environments with high yield. However, the rest genotypes, since they had below average mean yield, were not selected to any environment for grain yield (Figure 1). Different authors (Haruna et al., 2017; Kumar and Singh, 2015)have also used AMMI biplot to discriminate among OPV maize varieties.
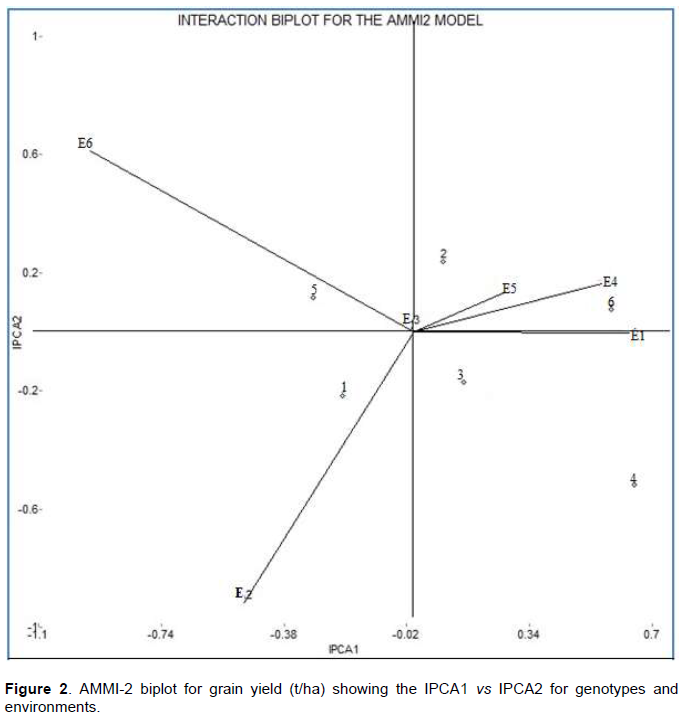
AMMI-2 relationships among genotypes and environments
In AMMI2 biplot, the IPCA1 and IPCA2 scores of genotypes and environments were plotted against each other, depicted easy visualization of differences in interaction effects (Figure 2). The AMMI2 biplot graph showed that Dalifage1 (E3) was the most favorable and ideal environment for the low-land OPV maize varieties; whereas, Dalifage-2 (E4) and Awra-1 (E1) were the average environments for OPV maize varieties. However, Awra-2 (E2) and Dubti-2 (E6) were found to be unfavorable environments for the present set of genotypes. The AMMI2 biplot graph also showed that varieties Melkasa-7 and Melkasa-2 were the most stable genotypes across location, which supports the results of AMMI1 biplot and ASV analysis. Whereas, Melkasa-3 and 4 were highly interactive and unstable genotypes which are then suited for high yielding favorable environments (Figure 2). However, genotype1 and 5 (Melkasa-1 and Melkasa-6Q) were not suitable to any of the environment. Similar results were reported by Sumathi et al. (2017) and Bose et al. (2014).
Genotypes located near the origin had lower interaction effects than the genotypes farther from the center of the vector. Moreover, genotypes that are closer to each other tend to manifest similar adaptability pattern and vice versa. Further information about the discriminating power of environments, together with a representation of their mutual relationships, can be obtained by the environment-vector of the AMMI2 biplot. In this case, a long environmental vector reflects a high capacity to discriminate the genotypes (Askari et al., 2017). Accordingly, Awra-2 and Dubti-2 had the longest vector and genotypes Melkasa-3 and Melkasa-4 are still came out the best performing genotypes in Dalifage-1 and Awra-1, respectively. These genotypes showed the highest ASV and identified as the most unstable but high yielding genotypes. The closer the genotypes to the center in AMMI2 biplot are assumed to be more stable than the genotypes far away from the center. AMMI model does not provide a quantitative stability measure and is indispensable to quantify and rank genotypes in terms of yield and stability; however, ASV quantifies and ranks genotypes (Kumar and Singh, 2015; Yong-Jian et al., 2010; Shiri, 2013;Sumathi and Govintharaj, 2017; Mortazavian et al., 2014; Miah and Uddin, 2016).
CONCLUSION
The present study revealed that the varieties Melkasa-7 and Melkasa-2 were identified to be the most stable open pollinated maize genotype across all location having greater yield above the grand mean, and are recommended for wider adaptation across diverse agro- ecologies of the Afar Regional State. Whereas, Melkasa-3 and Melkasa-4 were the most unstable across the test environments with outstanding grain yield and recommended for specific adaptation. The AMMI analysis also revealed that environment-3 (Dalifage-1) was the most favorable and ideal environment for best yield performance of OPV maize varieties, while Dalifage-2 and Awra-1 were average environments for better grain yield of OPV maizes. Moreover, the results of the different AMMI components were consistent in identifying the stable genotypes for specific and wide adaptation. However, yield performance in maize was greatly influenced by environment and GEI, which contributed more to the phenotypic variation. Generally, the first two IPCAs of the AMMI model were more efficient to discriminate GEI in grain yield of maize genotypes. Further testing of these OPV maize genotypes in different environments could enhance breeding efficiency with respect to genotypes’ stability and adaptation across environments.
CONFLICT OF INTERESTS
The authors have not declared any conflict of interests.
ACKNOWLEDGEMENT
The author is grateful to the Afar Pastoral and Agro-pastoral Research Institute (APARI) for funding this research work.
REFERENCES
|
Abdi H, Williams LJ (2010). Principal Component Analysis. Wiley Interdisciplinary Reviews: Computational Statistics 2(4):433-459. |
|
|
Albert MJA (2004). Comparison of Statistical Methods to describe G x E interaction and yield stability in multi-location maize trials. M.Sc. Thesis, University of the Free State, pp. 19-51. |
|
|
Anley W, Zeleke H, Dessalegn Y (2013). Genotype X Environment Interaction of Maize (Zea mays L.) across North Western Ethiopia. Journal of Plant Breeding and Crop Science 5(9):171-181. |
|
|
Apraku B, Akinwale R (2011). Identification of early-maturing maize inbred lines based on multiple traits under drought and low N environments for hybrid development and population improvement. Canadian Journal of Plant Science (91):931-942. |
|
|
Askari H, Kazemitabar KS, Zarrini NH, Saberi HM (2017). Analysis of the Genotype by Salt Interaction of Barley (Hordeum voulgar L) Genotypes at early Growth Stage by Graphical Models. International Journal of Agricultural and Environmental Research 3:190-196. |
|
|
Bose LK, Jambhulkar NN, Pande K, Singh ON (2014). Use of AMMI and other Stability Statistics in the Simultaneous Selection of Rice Genotypes for Yield and Stability under Direct-seeded conditions. Chilean Journal of Agricultural Research 74:3-9. |
|
|
Bustos-Korts D, Malosetti M, Chapman S (2016). Modelling of Genotype by Environment Interaction and Prediction of Complex Traits across Multiple Environments as a Synthesis of Crop Growth Modelling. Genetics and Statistics. In: Yin X., Struik P. (eds) Crop Systems Biology. Springer, Cham. |
|
|
Dewi AK, Chozin MA, Triwidodo H, Aswidinnoor H (2014). Genotype x environment interaction and stability analysis in lowland rice promising genotypes. International Journal of Agronomy and Agricultural Research 5(5):74-84. |
|
|
FAO (Food and Agricultural Organization) (2015). Enhancing Crop-Livestock Systems in Conservation Agriculture for Sustainable Production Intensification. Integrated Crop Management 7:11-49. |
|
|
Frutos E, Galindo MP, Leiva V (2015). An interactive biplot implementation in R for modeling genotype-by-environment interaction. Stochastic Environmental Research and Risk Assessment 28(7):1629-1641. |
|
|
Giridhar K, Surya Kumari S, Sarada C, Naram NL (2016). Stability for Seed Yield in Ajwain based on Gentoype Selection Index. Indian Journal of Agricultural Research 50(3):244-248. |
|
|
Haruna A, Adu GB, Buah SS, Kanton RAL, Kudzo AI, Seidu AM, Kwadwo OA (2017). Analysis of Genotype by Environment Interaction for Grain Yield of Intermediate maturing Drought Tolerant Top-cross Maize Hybrids under rain-fed conditions. Cogent Food and Agriculture 3(1):1-13. |
|
|
IRRI (2009). IRRISTAT version 7.2. Tutorial manual part I and II. Crop Research Informatics Laboratory. International Rice Research Institute, Philippines. |
|
|
Kumar K, Bharagava PD, Upadhyaya SM (2014). Variability studies in Maize in Rajasthan. Indian Journal of Agricultural Science 37:293-301. |
|
|
Kumar P, Singh NK (2015). Determining Behaviour of Maize Genotypes and Growing Environments Using AMMI Statistics. SAARC Journal of Agriculture 13(1):162-173. |
|
|
Lin CS, Binns MR (1986). A superiority measure of cultivar performance for cultivar x location data. Canadian Journal of Plant Science 68:93-198. |
|
|
Malosetti M, Ribaut JM, van Eeuwijk FA (2013). The Statistical Analysis of Multi-environment Data: Modeling Genotype-by-Environment Interaction and its Genetic Basis. Frontiers in Physiology 4:1-17. |
|
|
Miah MA, Uddin MS (2016). Assessment of yield stability of maize inbred lines in Multi-Environment Trials. Bangladesh Journal of Scientific and Industrial Research 51(1):61-68. |
|
|
Mortazavian M, Reza H, Mohammad S, Sharif-al-hosseini M, Taheri M, Mahlooji M (2014). GGE Biplot and AMMI Analysis of Yield Performance of Barley Genotypes across Environments in Iran. Agricultural Science and Technology 16:609-622. |
|
|
Mustapha M, Bakari HR (2014). Statistical Evaluation of Genotype by Environment Interactions for Grain Yield in Millet (Penniisetum glaucum (L). The International Journal of Engineering and Science 3:7-16. |
|
|
Ndhlela T, Herselman L, Magorokosho C, Setimela P, Mutimaamba C, Labuschagne M (2014). Genotype x Environment Interaction of Maize Grain Yield using AMMI Biplots. Crop Science 54(5):1992-1999. |
|
|
Nzuve F, Githiri S, Mukunya DM, Gethi J (2013). Analysis of Genotype x Environment Interaction for Grain Yield in Maize Hybrids. Journal of Agricultural Science 5(11):75-85. |
|
|
Purchase JL (1997). Parametric analysis to describe G x E interaction and yield stability in winter wheat. Ph.D. Dissertation. Department of Agronomy, Faculty of Agriculture, University of the Free State, Bloemfontein, South Africa. p. 148. |
|
|
Purchase JL, Hatting H, Vandenventer CS (2000). G x E interaction of wheat: stability analysis of yield performance. South Africa Journal of Plant Science 17:101-107. |
|
|
Shiri M (2013). Grain Yield Stability Analysis of Maize (Zea mays L.) Hybrids in Different Drought Stress Conditions Using GGE Biplot Analysis. Crop Breeding Journal 3(2):107-112. |
|
|
Solomon A, Mandefro N, Zelke H (2008). Genotype-Environment Interaction and Stability Analysis for Grain Yield of Maize (Zea mays L.) in Ethiopia. Asian Journal of Plant Science 7(2):163-169. |
|
|
Sumathi P, Govindaraj M, Govintharaj P (2017). Identifying Promising Pearl Millet Hybrids Using AMMI and Clustering Models. International Journal of Current Microbiology and Applied Sciences 6(2):1348-1359. |
|
|
WARC and APARI (2007). Werer Agricultural Research Center and Afar Pastoral and Agro-pastoral Research Institute. Assessment of soil status and Topographic exploration of Western and South-western districts of Afar Regional state. Proceedings, pp. 9-36. |
|
|
Yong-Jian LIU, Chuan D, Meng-liang T, Er-liang HU, Yu-bi H (2010). Yield Stability of Maize Hybrids Evaluated in Maize Regional Trials in |
|
|
Southwestern China Using Nonparametric Methods. Agricultural Sciences in China. Chinese Academy of Agricultural Sciences 9(10):1413-1422. |
|
|
Zobel RW, Wright MJ, Gauch HG (1988). Statistical analysis of a yield trial. Agronomic Journal 80:388-389. |
|
Copyright © 2024 Author(s) retain the copyright of this article.
This article is published under the terms of the Creative Commons Attribution License 4.0


