Full Length Research Paper

ABSTRACT
A study was carried out to evaluate the effect of drought stress on pod yield and other traits of groundnut genotypes to select the ten best performing genotypes using indices. Ninety six genotypes including 90 F2:3 progenies, 4 parents and 2 checks were planted under well-watered (WW) and water-stressed (WS) conditions at the International Crops Research Institute for the Semi-Arid Tropics ICRISAT, Mali. Six selection indices including mean productivity (MP), tolerance (TOL), geometric mean productivity (GMP), stress tolerance index (STI), drought tolerance index (DTI) and reduction (%) (RED) were used. The indices were adjusted based on pod yield under WW and WS conditions. High DTI, STI, MP, and GMP values under both well-watered and water-stressed conditions were more effective in identifying high yielding cultivars under water limited conditions. Based on these indices, the F2:3 progenies ICGV-IS 13012F2-B1-297, ICGV-IS 13012F2-B1-40, ICGV-IS 13005F2-B1-46, ICGV-IS 13005F2-B1-252, ICGV-IS 13012F2-B1-29, ICGV-IS 13005F2-B1-205, ICGV-IS 13005F2-B1-287, ICGV-IS 13012F2-B1-525, ICGV-IS 13012F2-B1-576 and ICGV-IS 13005F2-B1-91 were identified as the most drought tolerant genotypes with high yield stability in the well-watered and drought stress conditions. The indices STI, MP and GMP were positively correlated with pod yield under WW and WS conditions and breeding for drought tolerance.
Key words: Groundnut, breeding, selection indices, drought stress.
INTRODUCTION
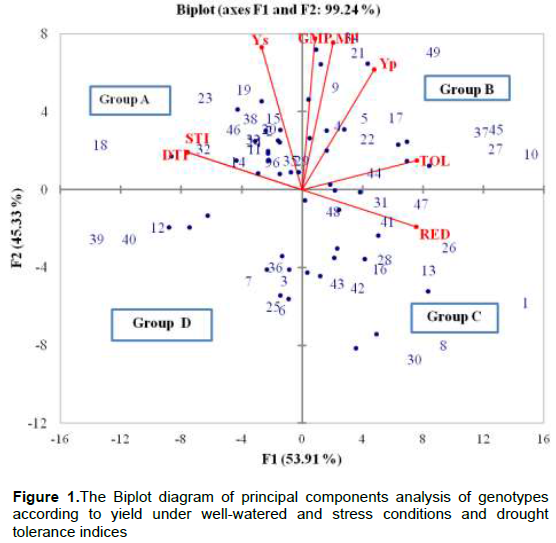
In the Sahel region, yield in groundnut is low and about 1000 kg /ha (FAOSTAT, 2015). The historical trend in groundnut production revealed that grain yield is highly affected by drought events (Debrah and Waliyar, 1998). These authors argued that drought occurs in Mali once every three years, while groundnut is the first legume crop grown in Mali with 71% of the overall legume production. However, the rain-fed groundnut production and quality are seriously challenged by drought stress. This calls for more research on groundnut concerning the climate change and its unpredictable and irregular rainfall patterns in the Sahelian region. The groundnut crop exhibits low heritability for yield and drought tolerance. Lack of effective field selection approaches limit development of resistant groundnut genotypes to environmental stress. Many selection indices are used to identify high yield genotypes under stress conditions in durum wheat (Talebi et al., 2009; Karimizadeh et al., 2011), maize (Jafari et al., 2009), mungbean (Fernandez, 1992) wheat (Sio-Se et al., 2006; Anwar et al., 2011), rice (Raman et al., 2012); and groundnut (Nautiyal et al., 2002) crops. These authors use a mathematical relation between stress- and optimum conditions to identify drought tolerant and susceptible genotypes. In the selection of Mungbean (Vigna radiata (L.)Wilczek) lines, Fernandez (1992) classified genotypes according to their performance in moisture stress and non-stress environments to four groups: genotypes with similar good performance in both environments (Group A); genotypes with good performance only in non-stress environments (Group B) or stressful environments (Group C); and genotypes with weak performance in both environments (Group D). According to Talebi et al. (2009) selection based on a combination of indices may provide a more useful criterion for improving drought resistance of crop but study of correlation coefficients is useful in finding the degree of overall linear association between any two attributes. A better approach than a correlation analysis such as Principal Component Analysis (PCA) is needed to identify the superior genotypes for both stress and non-stress environments (Porch, 2006; Talebi et al., 2009; Jafari et al., 2009; Allahdou, 2012). Information on selection of groundnut genotypes under different drought stress conditions could be relevant in Mali. This could be used to understand the genetic variation of the crop and to identify the drought tolerant cultivars. The present study aimed to assess the selection criteria for identifying drought tolerance in groundnut genotypes and to select the top 10 high yielding genotypes tolerant to drought stress using indices.
MATERIALS AND METHODS
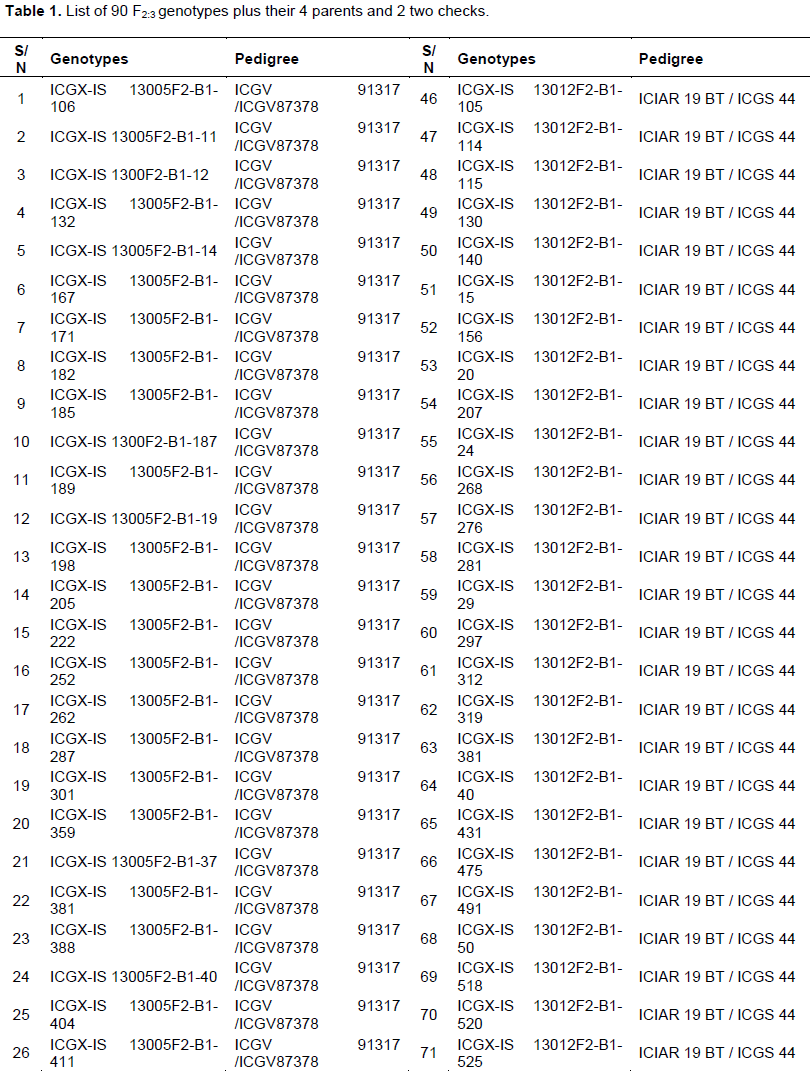
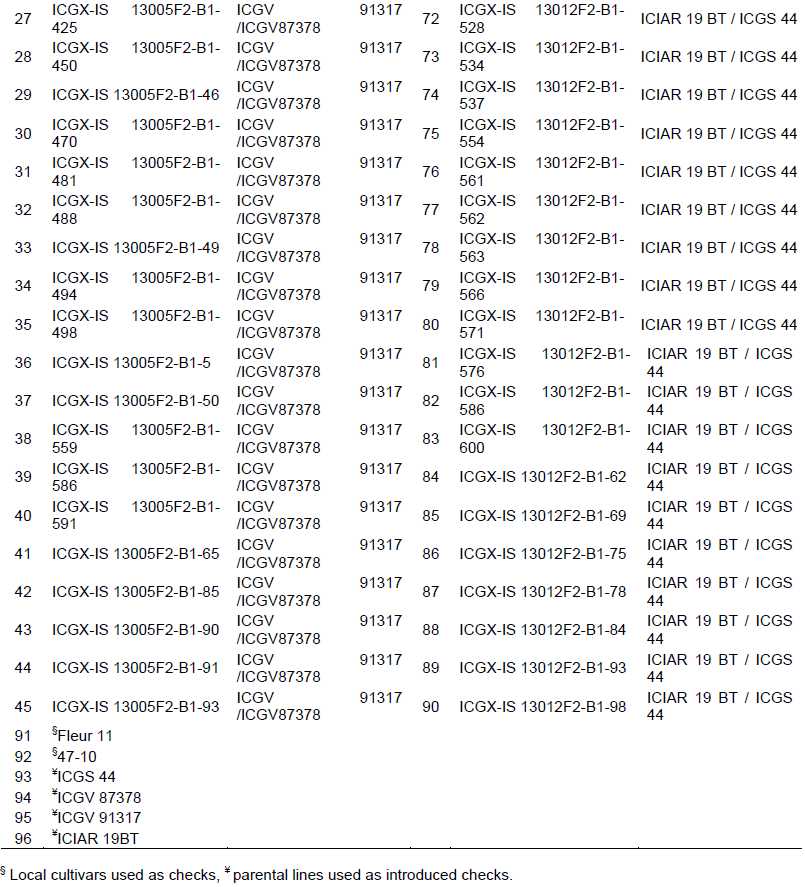
Ninety six groundnut genotypes were evaluated under drought stress and full irrigation conditions (Table 1). These genotypes were part of an on-going breeding program focused on selection of drought tolerant lines. Forty five 45 F2:3 progenies from each two of the populations (ICGX-IS 13005 and ICGV-IS 13012) were evaluated along with their 4 parental lines (ICIAR 19BT, ICGV 91317, ICGV 87378 and ICGS 44) and two local checks (Fleur11 and 47-10).
Experimental conditions
The groundnut populations were established at the International Crops Research Institute for the Semi-Arid Tropics (ICRISAT), Samanko (12°54’N and 8°4’W, 330 m above the sea) in Mali rain-free period in November 2014 to March 2015. The Samanko soil was a Ferric Lixisol clay loam with a pH of 4.5 and deficient in organic matter and total nitrogen with low fertility. Ninety-six genotypes were evaluated in Split plot where subplots (genotypes) were arranged in 9 × 11 alpha (0.1) lattices with two replications in dry season. An experimental plot consisted of a 4 m long single row, with spacing 0.2 m × 0.60 m. The irrigation water management was applied as followed: the water-stressed (WS) block, full irrigation was provided till 50 days after sowing (DAS). At 50 DAS, drought stress was imposed for 14 days and irrigation was resumed at the 15th day to bring the soil up to saturation. Then, drought stress was imposed for 10 days, followed by irrigation up to saturation. After that, drought stress was imposed for 7 days followed by irrigation up to harvest. This technique was supposed to mimic the end-of-season drought since water was withheld during the critical stage of the reproductive phase. The well-watered (WW) block received full irrigation throughout the life cycle of the crop (from sowing to harvesting period). Plants were irrigated one to two times per week with 20 mm of water until end-of-season (pod filling to pod maturity) at seven day interval depending on the prevailing weather conditions. Except for the different irrigation treatments; all field management practices were uniform for both the well-watered and water-stressed experiments. Basal fertilizer of 100 kg ha-1 Simple Super phosphate was applied before hand-planting with one seed per hill. Standard cultural practices, including hand planting, hand weeding while the first as early as 16-20 days after sowing (DAS) were followed. The average ambient temperature during the trial period (November-March) was 26.07°C, with a standard deviation STDEV= 9.55%. The average relative humidity within the same period was 27.17%, with a standard deviation STDEV of 16.56%.
Data collection
Data recorded on plot basis were number of days to 50% plants flowering [PF], pod yield [PY] (kg.ha-1) was determined from pod harvested from 15 plants in the middle of the plot after air drying to constant weight for two weeks, 100 – Sound seed weight [HSW] (g): the weight of 100 – kernels for each plant was recorded and shelling percentage [SP] (%) was recorded as the weight of seeds in 50pods/weight of 50 pods) × 100.
Statistical analysis
The analysis of variance (ANOVA) was performed using PROC GLM in SAS (SAS Institute, 2009). PROC CORR in SAS was used for correlation analysis of the selection indices. The PCA biplot was performed using XLSTAT software under Microsoft Windows. In order to apply indices, drought resistance was calculated using the following mathematical relationships:
(i) Mean productivity (MP) = (Ys+Yp)/2 (Hossain et al., 1990)
(ii) Tolerance (TOL) = (Yp-Ys) (Hossain et al., 1990)
(iii) Geometric mean productivity (GMP) = √(Ys x Yp) (Fernadez,1992)
(iv) Stress tolerance index (STI) = (Yp)(Ys)/(Ȳp)2 (Fernadez, 1992)
(v) Drought tolerance index (DTI) = Ys/Yp (Nautiyal et al., 2002)
(vi) Reduction (%) (RED) = (Yp-Ys)/Yp (Choukan et al., 2006)
Where Yp is the yield of cultivar under optimum (well-watered) environment, Ys is the yield of cultivar stress (water stress) environment, Ȳp is the mean yields of all cultivars under optimum condition.
RESULTS AND DISCUSSION
Mean squares from the ANOVA across well-watered and water stressed conditions for various traits
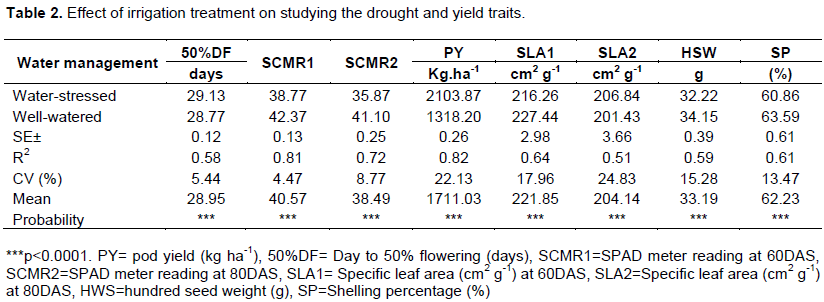
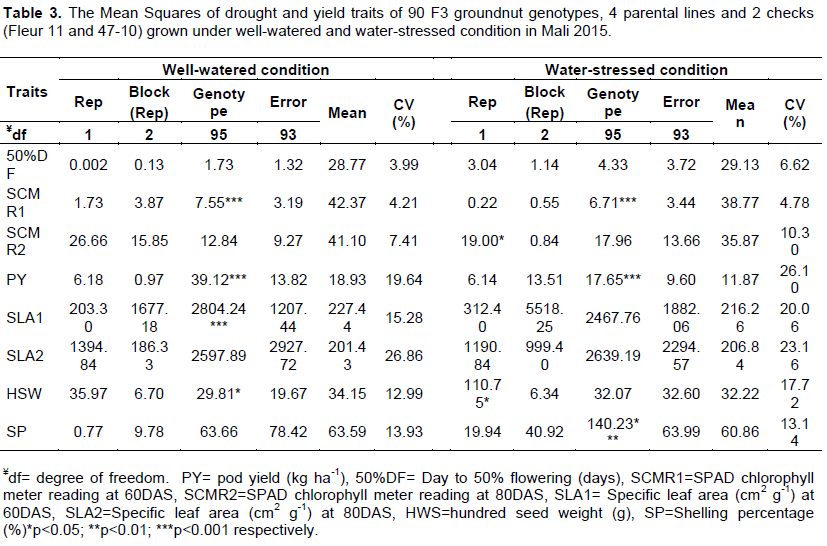
Results from the analysis of variance (ANOVA) for pod yield and other traits across environments revealed highly significant (P<0.001 and P<0.05) difference for PY among genotypes under well-watered condition while, the mean squares for genotypes were significant (P<0.05) for HSW (Table 2). Under water-stressed environment, mean squares genotypes were highly significant (P<0.001) for PY and SP traits. Combined analysis showed highly significant differences (P<0.01) for all traits (Table 3). Under water-stressed conditions, reductions in values were observed for the entire yield and yield components traits such as hundred seed weight, shelling percentage and pod yield. The overall genotype mean performance for 100-seed weight, shelling percentage and pod yield were lower under drought stress conditions than those under well-watered-conditions. Thus, significant reductions (P<0.001) in performance of traits were found for these traits both environments. Yp and Ys were the yield of cultivar under optimum environment and the yield of cultivar under stress environment, respectively.
In this study, results showed that the greater the TOL value, the larger the yield reduction under stress conditions and the higher the drought sensitivity (Table 4). Based on TOL index, the genotypes ICGX-IS 13005F2-B1-198 (1744.44 and 1644.45 kg/ha) and ICGX-IS 13005F2B1-494 (1388.89 and 1288.89 kg/ha) with low values were considered as tolerant genotypes but mostly with low values of pod yield in both environments. Thus, TOL favours genotypes with good yield under stress. These findings were in line with the work of Jafari et al. (2009) and Fernandez (1992) who reported that TOL index failed to select maize genotypes with proper yield under stress and non-stress environments. TOL index was closer to the RED since they identified tolerant genotypes but not always the top performers under well-watered condition.
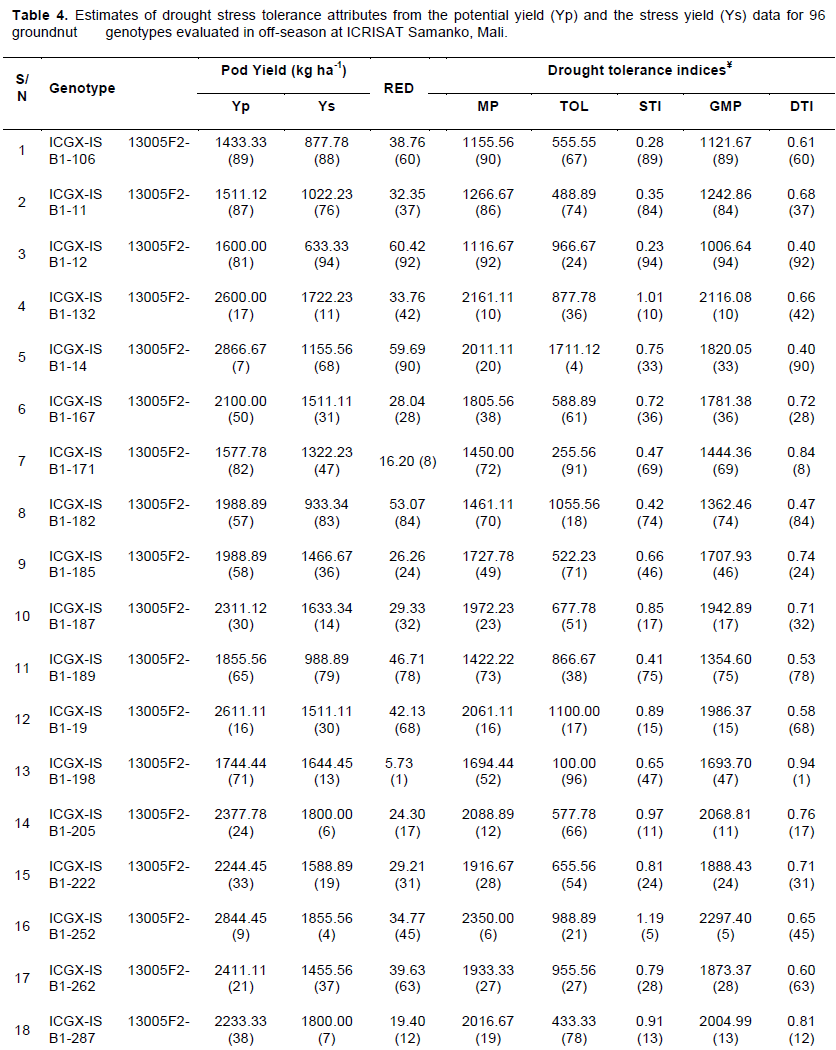
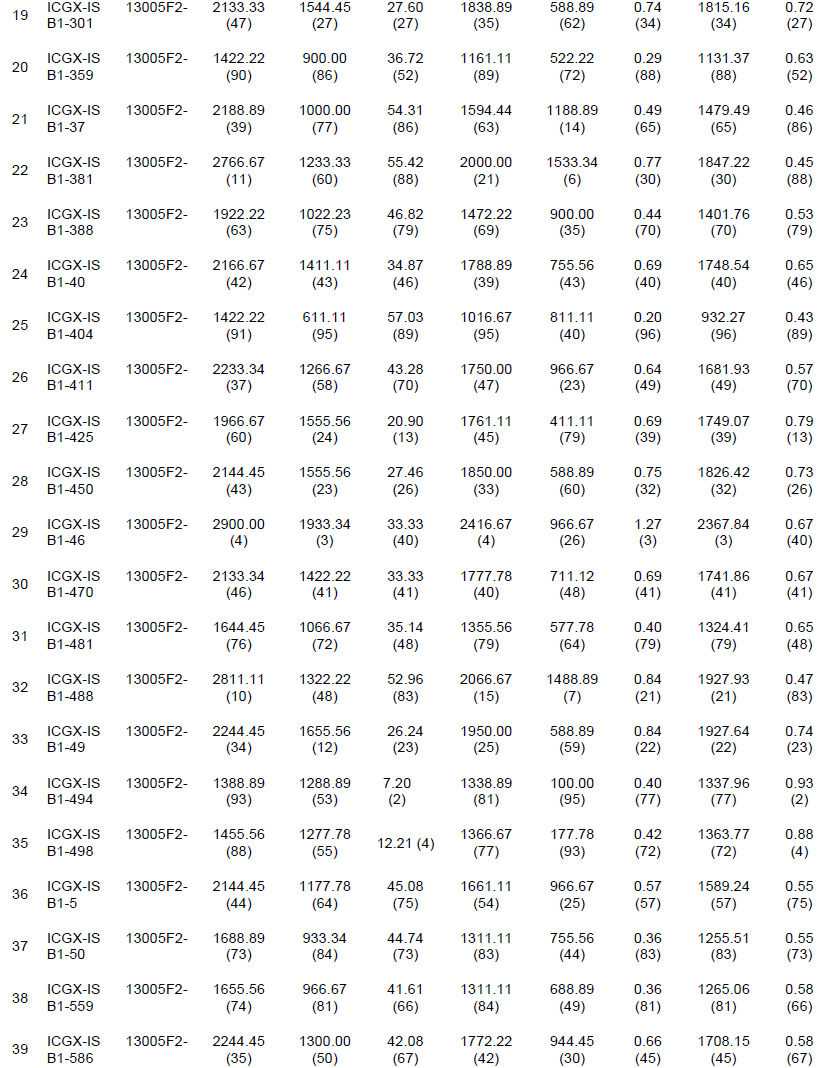
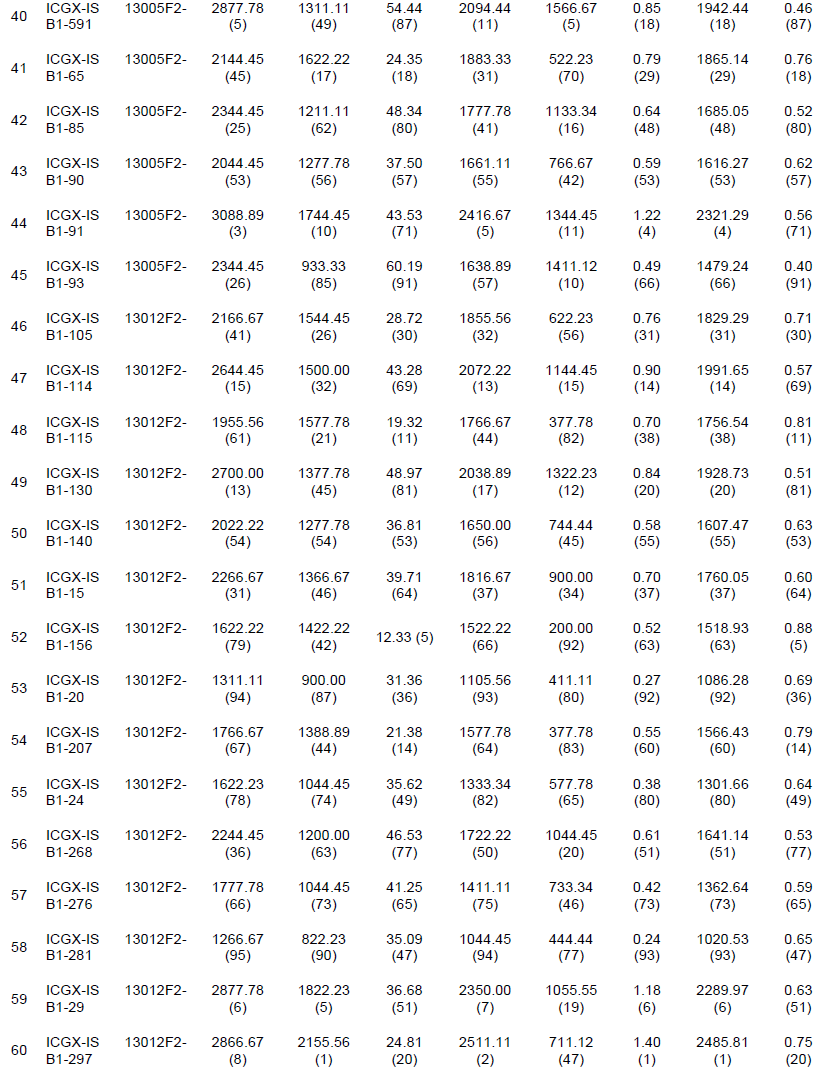
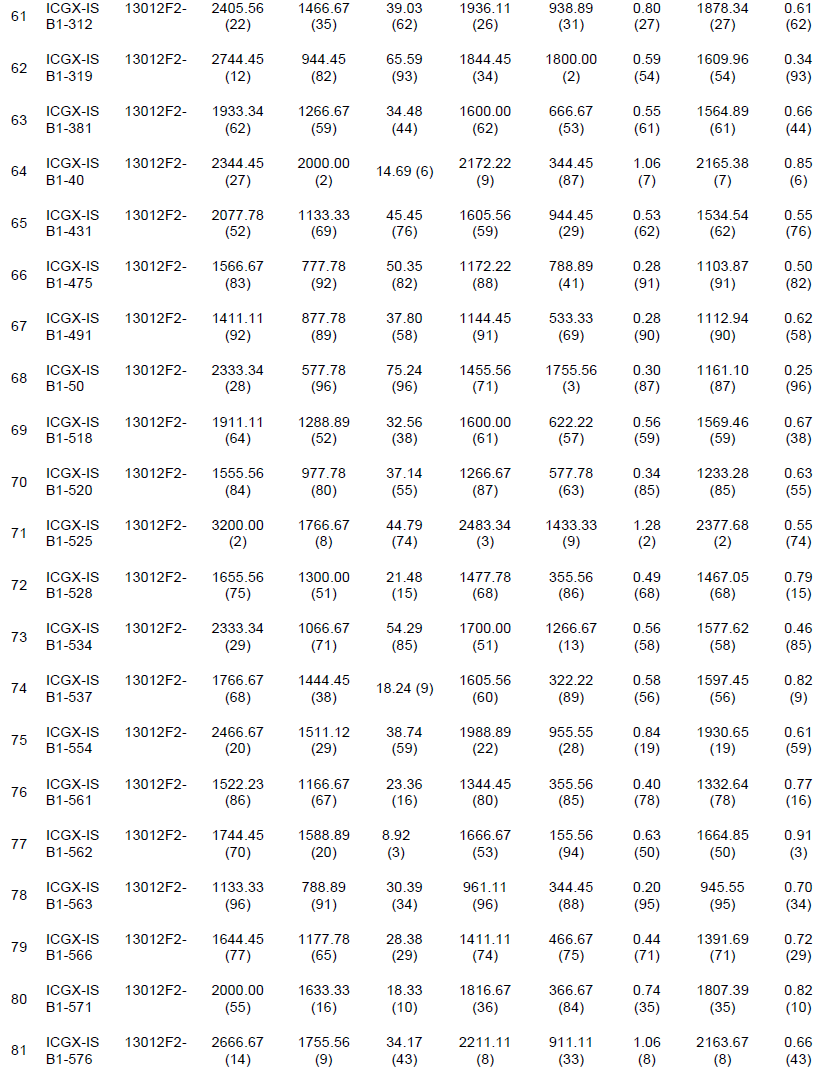
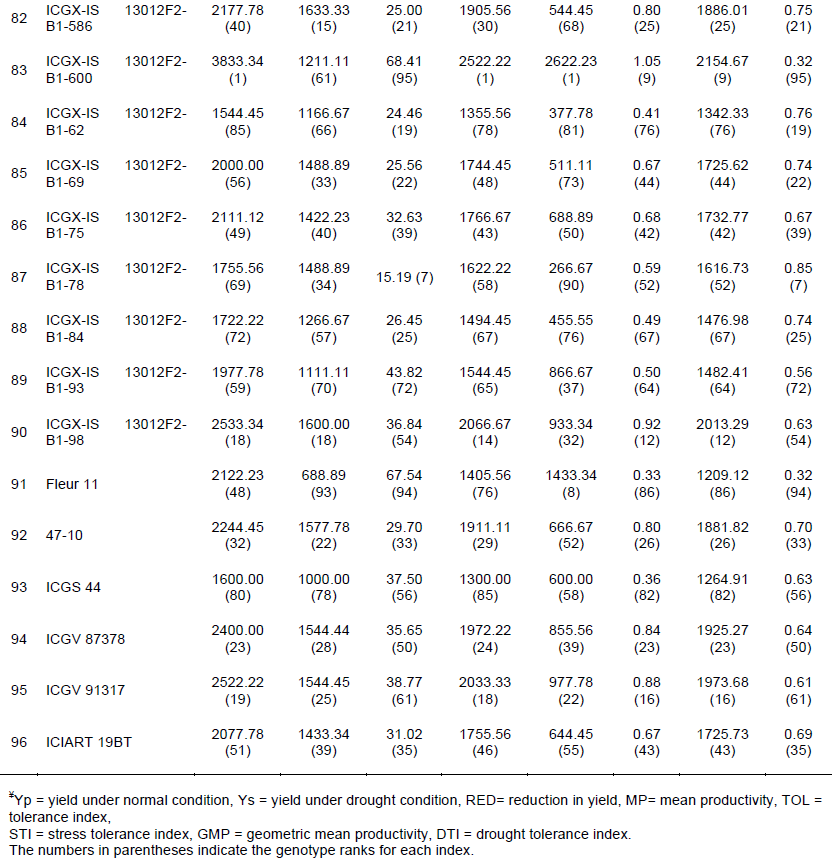
The highest Stress tolerance (STI) indices were recorded for genotypes ICGX-IS 13012F2-B1-297 (2866.67 and 2155.56 kg/ha), ICGX-IS 13012F2-B1-525 (3200.00 and 1766.67 kg/ha) and ICGX-IS 13005F2-B1-46 (2900.00 and 1933.34 kg/ha) with high values (1.27 to 1.40). They were considered as tolerant genotypes with high yield stability under both conditions (Table 4). On the contrary, the genotypes ICGX-IS 13005F2-B1-404 (1422.22 and 611.11 kg/ha), ICGX-IS 13012F2-B1-563 (1133.33 and 788.89 kg/ha) and ICGX-IS 13005F2-B1-12 (1600.00 and 633.33 kg/ha) were reported as susceptible to stress and they showed the lowest values (0.20 to0.23) of STI. Results revealed that STI indices were closer to GMP and MP in the ranking.
For the Drought tolerance index (DTI), the highest values were recorded for genotypes ICGX–IS 13005F2B1-198, (1744.44 and 1644.45 kg/ha), ICGX-IS 13005F2B1-494 (1388.89 and 1288.89 kg/ha) and ICGX-IS 13012F2-B1-562 (1744.45 and 1588.89 kg/ha), with high value (0.91 to 0.94) were found as tolerant genotypes (Table 4) while the genotypes ICGX-IS 13012F2-B1-50 (2333.34 and 577.78 kg/ha), ICGX-IS 13012F2-B1-600 (3833.34 and 688.89 kg/ha ) and Fleur 11 (2122.23 and 688.89 kg/ha) were considered as susceptible to drought with low value (0.25 to 0.32). Results showed that DTI indices were similar to reduction percentage (RED %), but the higher the DTI, the smaller the (RED) in pod yields. The MP, STI and GMP indices were closer in the ranking, and they favored the identification of tolerant genotypes with stable yield under non-stress and stress environments. The highest STI indices were recorded for genotypes ICGX-IS 13012F2-B1-297 (2866.67 and 2155.56 kg/ha), ICGX-IS 13012F2-B1-525 (3200.00 and 1766.67 kg/ha) and ICGX-IS 13005F2-B1-46 (2900.00 and 1933.34 kg/ha) with high values (1.27 to 1.40). They were considered as tolerant genotypes with high yield stability under both conditions. The use of the STI index was encouraged by Fernandez (1992) who argue that a high STI value indicate a high tolerance to stress. Sio-Se et al. (2006) agreed that these GMP, MP and STI are reliable indices in identifying stable genotypes in wheat. The RED revealed the percent loss of pod yield; and it also provided information about high performing genotypes in yield. But care should be taken when using this index since it might not always give good indication of stable and tolerant genotypes. The current study identified drought tolerant with high yielding genotypes after removing some poor genotypes with good RED indices as low RED values of a genotype could be due to less yield under optimal condition. The RED and DTI indices were opposite such that the higher the DTI, the lower the RED in pod yield. Based on DTI index, genotypes ICGX–IS 13005F2B1-198, (1744.44 and 1644.45 kg/ha), ICGX-IS 13005F2B1-494 (1388.89 and 1288.89 kg/ha) and ICGX-IS 13012F2-B1-562 (1744.45 and 1588.89 kg/ha), with high values (0.91 to 0.94) were found as tolerant and stable genotypes. This is in agreement with the work of Nautiyal et al. (2002) for groundnut. In this study, parental lines performed less than most of their offspring. The high performing parents were ICGV 87378, ICIAR 19BT and ICGV 91317, respectively. Despite large variability among the progenies, they showed the top 10 high yielding genotypes tolerant to drought. Yield loss in groundnut due to drought ranges from 44% to 85%. In our knowledge, this is the first attempt to provide genetic information and yield loss in breeding for drought tolerant groundnut varieties in Mali.
Correlation of pod yield and drought tolerance indices
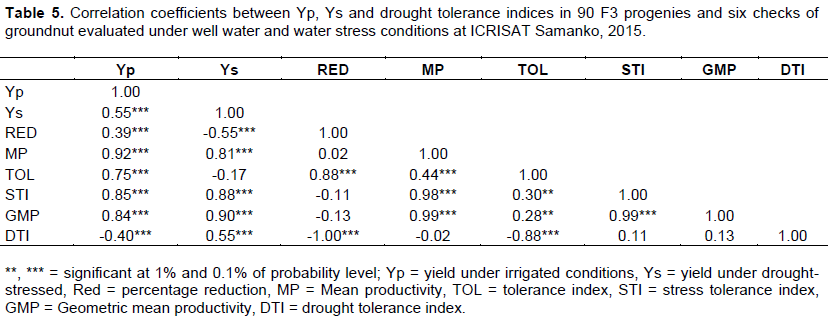
Highly significant (P<0.001) and positive correlations were found between yield under well-watered conditions (Yp) and the other five indices (Ys, RED, MP, TOL, STI, GMP, and DTI). Similarly, yield under drought stress conditions (Ys) was highly significant (P<0.001) and associated with all the selection indices except TOL (Table 5). Selection Indices including GMP, MP and STI were highly significant (P<0.001) and positively correlated with each other and to both well-watered (Yp) condition and water-stressed (Ys) condition. The observed relations were consistent with those reported by Fernandez (1992) on mungbean, Jafari et al. (2009) on maize; Talebi et al. (2009) and Allahdou (2012) on tritipyrum.
Principal component analysis of indices and traits
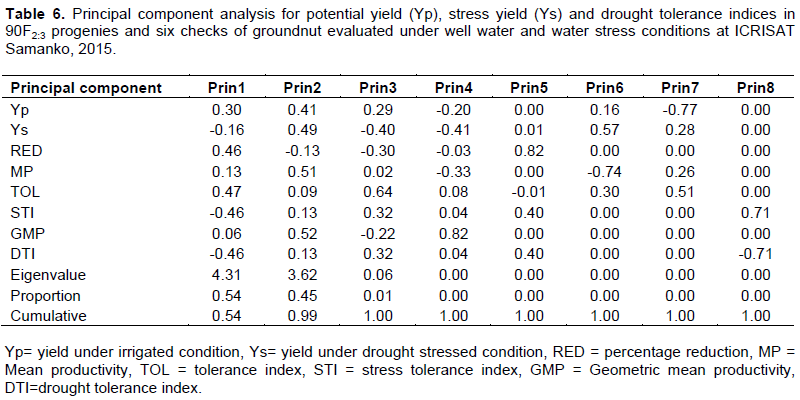
The PCA analysis showed eight axes (Prin or PCA) with their corresponding eigenvalues and the proportion of variation of each PCA (Table 6 and Figure 1). The results revealed that the first PCA explained 54% of the variation with PYWW, MP, STI, and GMP being significant (Table 6 and Figure 1). Thus, the first dimension (Prin1) can be named as the yield potential and drought tolerance. Genotypes that had high values of these indices were high yielding under both stressed and non-stressed conditions. The second PCA (Prin2) explained 45% of the total variability and correlated positively with RED and TOL but had negative correlation with DTI and pod yield under stressed conditions (PYWS) (Table 6). Therefore, the second component can be named as a stress-tolerant dimension and it separates the stress tolerant genotypes from the non-tolerant ones. The Prin1 and the Prin2 (in bold) explained 99% of the total variation (Table 6). Variables making the most important contribution to each of the two (Prin1 and Prin2) components have their loading shown in underlined bold (loading >0.3 were considered most important). Hence, selection of genotypes that have high Prin1 and low Prin2 would result in genotypes good in both stressed and non-stressed conditions. Principal component analysis (PCA) provided the degree of importance of stress indices. Groundnut is a highly self-pollinated crop where pure line selection is needed; selection should be based on individual genotypes. Talebi et al. (2009) proposed PCA analysis as a better approach than the correlation analysis to identify individual superior genotypes for both stress and non-stress conditions. Results of PCA revealed that PC1 was associated positively with Yp, RED, TOL and negatively with STI and DTI, while PC2 was associated positively with Yp, Ys, MP and GMP. Talebi et al. (2009), Karimizadeh et al. (2011) and Allahdou (2012) obtained similar results in multivariate analysis of drought tolerance. Selection indices including high STI, DTI and low RED contributed to the largest variation in identifying thigh yielding genotypes tolerant to drought stress. The top 10 F2:3 genotypes identified were ICGV-IS 13012F2-297-B1; ICGV-IS 13012F2-40-B1; ICGV-IS 13012F2-576-B1 from ICIAR 19BT/IGGS 44 and ICGV-IS 13005F2-46-B1; ICGV-IS 13005F2-252-B1; ICGV-IS 13012F2-29-B1; ICGV-IS 13005F2-205-B1; ICGV-IS 13005F2-287-B1; ICGV-IS 13012F2-525-B1 and ICGV-IS 13005F2-91-B1 from ICGV 91317/ICGV 87378. The pod yield ranged from 1744.5 kg/ha to 2155.6 kg/ha under drought-stressed conditions and under full irrigation conditions, pod yield ranged from 2233.3 kg/ha to 3200 kg/ha. These genotypes were the most tolerant with high yielding and stable yield in both environments in the current study conditions. In summary, the results from the selection indices could depend on the stress severity in reference to Blum (1996) arguing that under moderate stress conditions, potential yield greatly influences yield under stress conditions.
CONCLUSION
Low RED values and high DTI, STI, MP, and GMP values under both well-watered and water-stressed conditions were more effective in identifying high yielding cultivars under water limited conditions. Based on these indices, the F2:3 progenies ICGV-IS 13012F2-B1-297, ICGV-IS 13012F2-B1-40, ICGV-IS 13005F2-B1-46, ICGV-IS 13005F2-B1-252, ICGV-IS 13012F2-B1-29, ICGV-IS 13005F2-B1-205, ICGV-IS 13005F2-B1-287, ICGV-IS 13012F2-B1-525, ICGV-IS 13012F2-B1-576 and, ICGV-13012F2-B1-525, ICGV-IS 13012F2-B1-576 and, ICGV-IS 13005F2-B1-91 were identified as the most drought tolerant genotypes with high yield stability in the well-watered and drought stress conditions. The indices STI, MP and GMP were positively correlated with Yp and Ys, and they were useful for breeding for drought tolerance. Similarly, RED and DTI values that are highly significant and negatively correlated could be powerful in helping breeders to select tolerant genotypes with stable yield under contrasting stress environments. These indices, in combination with the STI, MP and GMP were of great importance for the selection of genotypes in this study. Crop breeders should consider the level of stress of the environments when studying an index.
CONFLICT OF INTERESTS
The authors have not declared any conflict of interests.
REFERENCES
|
Allahdou M (2012). Evaluation of resistance to drought in Tritipyrum lines using drought tolerance indices. International Research Journal for Applied and Basic Science 3(3):461-465. |
|
|
Anwar J, Subhani GM, Hussain M, Ahmad J, Hussain M, Munir M (2011). Drought tolerance indices and their correlation with yield in exotic wheat genotypes. Pakistan Journal of Botany 43(3):1527-1530. |
|
|
Blum A (1996).Crop responses to drought and the interpretation of adaptation. Plant Growth Regulation 20:135-148. |
|
|
Choukan R, Taherkhani T, Ghannadha MR, Khodarahmi M (2006). Evaluation of drought tolerance in grain maize inbred lines using drought tolerance indices. Iran Journal of Agricultural Science 8(1):79-89. |
|
|
Debrah SK, Waliyar F (1998). Groundnut production and utilization in West Africa: Past trends, projections, and opportunities for increased production. In: Proceedings of the Fifth Regional Groundnut Workshop for Western and Central Africa, 18-21 Nov 1996, Accra, Ghana (in En, Fr) International Arachis Newsletter no.18. (Eds. Waliyar, F. and Umeh, V.C.).Supplement. 82pp. Andra Pradesh, India: ICRISAT. ISSN 1010-5824. |
|
|
FAOSTAT (2015). Statistical Database of the Food and Agriculture of the United Nations. |
|
|
Fernandez GCJ (1992). Effective selection criteria for assessing plant stress tolerance. In: Proceedings of the international symposium on adaptation of vegetable and other food crops in temperature and water stress. - Taiwan, pp. 257-270. |
|
|
Hossain AB, Sears AG, Cox TS, Paulsen GM (1990).Desiccation tolerance and its relationship to assimilate partitioning in winter wheat. Crop Science 30:622-627. |
|
|
Jafari A, Paknejad F, AL-Ahmadi MJ (2009). Evaluation of selection indices for drought tolerance of corn (Zea mays L.) hybrids. International Journal of Plant Production 3(4):1735-8043. |
|
|
Karimizadeh R, Mohammadi M, Ghaffaripour S, Karimpour F, Shefazadeh MK (2011). Evaluation of physiological screening techniques for drought-resistant breeding of durum wheat genotypes in Iran. African Journal of Biotechnology 10(56):12107-12117. |
|
|
Nautiyal PC, NageswaraRao RC, Joshi YC (2002). Moisture-deficit-induced changes in leaf-water content, leaf carbon exchange rate and biomass production in groundnut cultivars differing in specific leaf area. Field Crops Research 74:67-79. |
|
|
Porch TG (2006). Application of Stress Indices for Heat Tolerance Screening of Common Bean. Journal of Agronomy and Crop Science 192:390-394. |
|
|
Raman A, Verulkar SB, Mandal NP, MukundVariar M, Shukla VD, Dwivedi JL, Singh BN, Singh O.N, Swain P, Mall A (2012). Drought yield index to select high yielding rice lines under different drought stress severities. Rice 5:31. |
|
|
SAS Institute (2009). SAS Proprietary Software Release 9.3. SAS Institute, Inc., Cary, NC. |
|
|
Sio-Se MA, Ahmadi A, Poustini K, Mohammadi V (2006). Evaluation of drought resistance indices under various environmental conditions. Field Crop Research 98:222-229. |
|
|
Talebi R, Fayaz F, Naji AM (2009). Effective selection criteria for assessing drought stress tolerance in durum wheat (Triticum durumDesf.). General and Applied Plant Physiology 35(1-2):64-74. |
|
Copyright © 2024 Author(s) retain the copyright of this article.
This article is published under the terms of the Creative Commons Attribution License 4.0


