ABSTRACT
Thirty-two faba bean genotypes were evaluated for their yield and yield components in verstisol areas of Hashenge and Aiba in 2015. Alpha lattice design with two replications was used for the experiment. The Analysis of Variance showed highly significant differences (P<0.01) for thousand seed weight over locations. Based on this, genotype EH 06007-2 scored highest 1000 seed weight (1111 g) followed by EH 06088-6 (971.5) and EH 06007-4 (938.5 g) over locations. Least thousand seed weight was obtained from the local genotype (505.5 gm) followed by the standard check Walki (587.3) and ET 07017-bulk (648.0 g). Grain yield showed significant differences (p<0.05) at Aiba location but no significant differences in Hashenge. At Aiba, genotype ET 07013-1 gave the highest grain yield (59.31 qt/ha) followed by genotype ET 07005-1 (57.85) and EH 06088-1 (54.77 qt/ha). Significant positive correlations were recorded between TSW with DM (0.624), number of seeds per pod (0.567) and NTPP (0.427) but it was negatively correlated with NPPP (-0.487). Grain yield was significantly and positively correlated with plant height (0.49) and NPPP (0.369). The highest distance (0.692) was between cluster V and IV, which suggested that the members of these clusters diverge on most of the studied traits and could be used in breeding programs. Principal component (PC) analysis revealed that the first four PCs explained 83.7% of the total variation. The variance explained by PC1 was mostly due to traits related to DM, TSW, NSPP and NTPP, whereas PC II was mostly related to grain yield, plant height, NPPP and thousand seed weight traits. The PC analysis ultimately showed the amount of variability for the traits that could be used for the improvement of large seed sized faba bean genotypes.
Key words: Large seed size, genotypes, grain yield, faba bean Vicia faba, vertisols
Faba bean (Vicia faba) has been grown in various parts of the world including Ethiopia, which is the 2nd largest producer after China (Biruk, 2009). According to the CSA (2013), faba bean grows in the highland areas of northern and central Ethiopia and the total cultivated area and average yield of the crop in 2008/2009 was 538, 820.5 ha and 12.92 qt/ha, respectively. Regional shares of faba bean production area are 4.11%, 48.05%, 37.46%, and 10% for Tigray, Amhara Oromia, and SNNPR regions, respectively.
Faba bean (V. faba L.) is one of the major pulse crops grown in the highlands (1800 – 3000 m asl) of Ethiopia (Temesgen and Aemiro, 2012). Faba bean is a valuable protein-rich leguminous crop cultivated and consumed as human food in the specified areas. In addition, its straw is used as animal feed. With a cheap protein source, it partly compensates for the large deficiency in animal protein sources. Faba bean plays a significant role in improving the productivity of soil by fixing atmospheric nitrogen and is a suitable rotation crop for cereals as well as in interrupting disease and insect pest cycles (Barri and Shtaya, 2013).
Vertisols cover 10.3% (about 12.7 million ha) of the Ethiopian land mass and are the fourth most abundant soils after Histosols, Cambisols and Nitosols. It is estimated that Vertisols comprise about 24% of the country’s cropped highland soils (Tekalign et al., 2002). Vertisols are potentially among the most productive soils of sub-Saharan Africa, but they are agriculturally underutilised within the traditional farming practices due to water logging during heavy rains. High moisture level limits faba bean production on vertisol as the crop is highly sensitive to water logged conditions (Getachew et al., 2003). Moreover, the problem of black root rot (Fusarium solani) is widely present in the vertisols (Beniwal and Dereje, 1987).
The highland area of Southern Tigray is suitable for the production of not only faba bean but also other pulse crops. In spite of this, however, faba bean production and productivity is by far below the genetic potential of the crop (MoARD, 2008). Low access of improved varieties and susceptibility of the available varieties of faba bean to water logging becomes the most important constraint in this region. The problem of water logging has resulted in the outbreak of not only root rot but also to chocolate spot and ascochyta blight (Couchman and Hollaway, 2016). The objective of this study was to evaluate faba bean genotypes for agronomic performance in vertisol areas of southern Tigray.
Description of study area
The experiment was conducted at Hashenge and Aiba, located in the southern zone of Tigray Region and 148 and 102 km south of Mekelle (capital city of Tigray), respectively. These locations have an altitude of 2420 and 2700 m above sea level, respectively, and the soils are vertisols. The study areas were selected based on their suitability for faba bean production and presence of water logging condition.
Experimental materials
The materials used in this experiment comprised of 32 large seed size Faba bean genotypes (New, EK 05024-2, EK 05023-1, EK 05014-3, EK 05027-5, EK 05002-3, EK 05005-4, ET 07002-1, ET 07002-2, ET 07002-bulk, ET 07005-1, ET 07005-2, ET 07005-3, ET 07005-bulk, ET 07013-1, ET 07017-bulk, ET 07019-bulk, EH 06007-2, EH 06007-4, EH 06088-1, EH 06031-3, EH 06023-4, EH 06022-4, EH 06022-1, EH 06028-1, EH 06070-3, EH 06007-6, EH 06022-3, EH 06088-6 as well as Hachalu. Walki and local). These materials were sourced from Holleta Agricultural Research Center in 2014. The experiment was conducted using Alpha Lattice Design with two replications and plots of 2 m long and 2.4 m wide and inter- and intra-row spacings of 40 and 10 cm, respectively. Four rows were harvested for yield and yield component evaluation. DAP fertilizer at the rate of 100 kg/ha was applied at planting. During growth, data were recorded on various agronomical traits including days to maturity, stand count at harvest, plant height, number of pods per plant, number of seeds per pod, grain yield, thousand seed weight, and diseases reaction.
Statistical analysis
Data collected from the experiment were analyzed using SAS (1999) for the analysis of variance and Minitab Version 14 (Minitab 1998) for Multivariate analysis (cluster analysis) statistical packages. Analysis of variance (ANOVA) and Pearson correlation analyses were performed according to the methods described by Gomez and Gomez (1984). All the quantitative and qualitative data were used for principal component analysis (PCA) and cluster analyses. The mean data were standardized prior to multivariate analysis to eliminate the effects resulting from using different scales. To separate the 32 genotypes into groups and to evaluate the patterns of similarity and dissimilarity, the data were subjected to cluster analysis according to Gower distance (Gower 1971), using PAST software version 2.15 (Hammer et al., 2001). Principal component analysis (PCA) of the correlation matrix was performed with the same software to determine the sources of variation among genotypes.
Seed size and disease reaction of faba bean genotypes
Since seed size, grain yield and disease reaction are the most important traits for pulse crops in general and faba bean crop in particular, analysis was focused to these characters, Based on this, there was highly significant difference (P<0.01) for thousand seed weight at Hashenge and Aiba locations. Genotype EH 06007-2 scored highest 1000 seed weight (1111 g) followed by EH 06088-6 (971.5) and EH 06007-4 (938.5 g) over locations. On the other hand, least seed size was recorded from the local (505.5 gm) genotype followed by the standard check Walki (587.3) and ET 07017-bulk (648.0 g) genotypes. From the tested genotypes, about 25 genotypes scored more 1000 seed weight than the standard check (Hachalu) but the other standard checks (Walki and local) showed least seed weight (Table 1).
The most important diseases affecting faba bean at Aiba and Hashenge locations are Chocolate spot, Ascochyta blight and Faba bean gall (Teklay et al., 2014). In 2015, these diseases did not occur at Hashenge. For this, disease severity scoring was taken only at Aiba location for Chocolate Spot and Ascochyta Blight (Table 1).
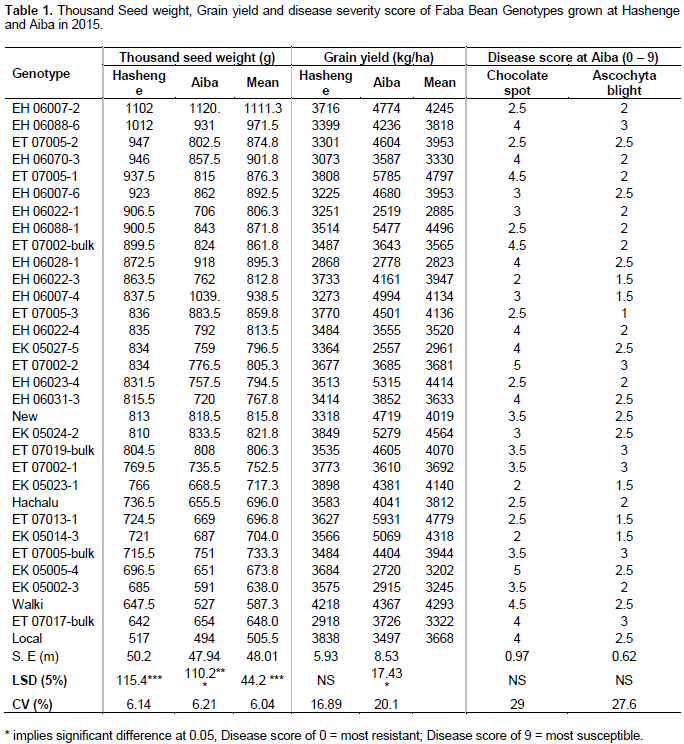
As indicated in Table 1, the analysis of variance for disease reaction has shown non-significant difference. Accordingly, although the severity scores of chocolate spot for all the genotypes were slightly higher than those for ascochyta blight, the scores were in the range of 1 to 5 for both diseases thus indicating resistant to moderately resistant disease reaction.
Variations of faba bean genotypes for grain yield
The analysis of variance for grain yield has showed significant difference (p<0.05) among genotypes at Aiba location but no significant difference in Hashenge. At Aiba location, 15 genotypes gave statistically more grain yield than the first standard check of walki (43.66 qt/ha). Accordingly, genotype ET 07013-1 gave the highest grain yield (59.31 qt/ha) followed by genotype ET 07005-1 (57.85) and EH 06088-1 (54.77 qt/ha).
Even though no statistical significant difference has showed for grain yield at Hashenge, the above genotypes (ET 07013-1, ET 07005-1 and EH06088-1) scored higher grain yield as 36.27, 38.08 and 35.14 qt/ha in that order. In this location, the highest grain yielder gave 42 18 qt/ha, which indicated a very similar in yielding potential with the highest yielder genotype. In general, the genotypes that showed significant yield difference at Aiba had also higher and reasonable grain yield at Hashenge location (Table 1).
Correlation analysis
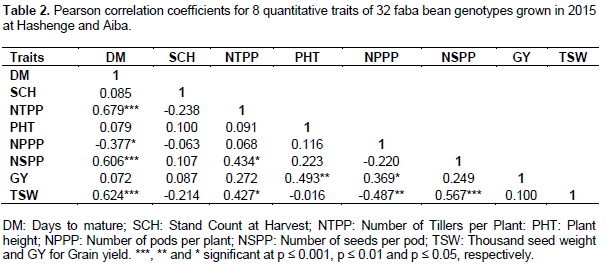
Pearson correlation coefficients between different pairs of characters were computed and are shown in table 2. The correlation coefficients of the 1000 seed weight trait showed that it was positively and significantly correlated (P<0.01) with days to maturity (0.624), number of seeds per pod (0.567) and number of tillers per plant (0.427). On the other hand, thousand seed weight was highly and negatively correlated with number of pods per plant (-0.487). As pods of faba bean per plant increases, seed size decreased to accommodate more pod clusters in a node. Similarly, highest and positive significant correlations were found between number of tillers per plant and days to maturity (0.679), number of seeds per pod and days to maturity (0.606).and grain yield with plant height (0.49). These results reflected the importance of days to maturity, number of seeds per pod and number of pods per plant in the determination of thousand seed weight in faba bean. Al Barri and Shtaya (2013) reported the importance of number of seeds per pod and number of pods per plant on 100 seed weight determination.

Cluster analysis
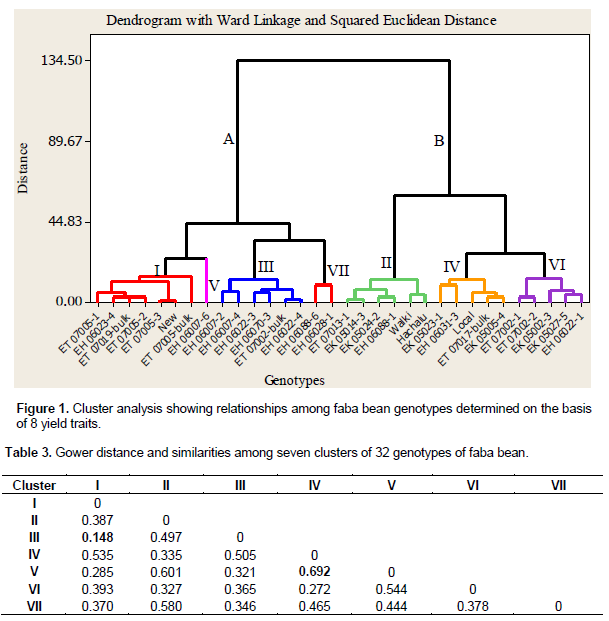
Cluster analysis was used to further investigate the inter-relationships of the genotypes using eight agronomic traits (days to maturity; stand count at harvest; number of tillers per plant: plant height; number of pods per plant; number of seeds per pod; thousand seed weight and grain yield). The genotypes were grouped into two main clusters (A and B). Main cluster A was also divided into four sub clusters and cluster B was divided in to three sub clusters (Figure 1).
Among the seven clusters, cluster I comprised of 7 genotypes (ET 07005-1, EH 06023-4, ET 07005-3, ET 07019 - -bulk, New, ET 07005-bulk and ET 07005-2) that have similar maturity time and number of tillers per plant. From this cluster, genotypes ET 07005-3 and New had the lowest dendrogram distance (1.21). Cluster II comprised six genotypes, including two standard checks and they were characterized by relatively early maturation, high number of pods per plant and more grain yield but lower thousand seed weight. The third cluster that consisted of six genotypes had highest thousand seed weight, more number of seeds per pod and late matured varieties. The genotypes in the fourth cluster were characterized by lowest thousand seed weight and lowest number of seeds per pod. The local check with its lowest seed size was included in this cluster. Cluster V that consisted of only one genotype (ET 06007- 6) has showed late maturation, poor in stand establishment but highest in tillering capacity. This cluster has more dendrogram distance (24.18) than others. On the other hand, cluster VI, comprising of five genotypes has less number of pods per plant. Finally, the lowest grain yield was recorded from the genotype in the seventh cluster. This cluster which includes only two genotypes also had low stand count at harvest and short plant height. Even though these genotypes were moderately resistant to Ascochyta blight and Chocolate spot diseases, more scores were recorded from them.
To evaluate the genetic variability or similarity of the genotypes among the clusters, the inter-cluster Gower distance and relationships were calculated using PAST software (Table 3). The highest distance (0.692) was between cluster V and IV, which suggested that the members of these clusters diverge on most of the studied traits and could be used in breeding programs. The lowest distance (0.148) was between cluster III and cluster I, suggesting that their maternal origin may be very closely related (Kumar et al., 2013).
Principal component analysis
Principal component analysis (PCA) was used to identify hidden patterns in the data and was performed to obtain more reliable information on how to identify groups of genotypes that have desirable yield traits for breeding. Eight components were extracted from the 8 studied traits by PCA analysis. But based on Diana (1999 as cited from Kaiser, 1960), factors to be retained should have more than 1 eigenvalues, at least 5% variance explained for each component, and/or more than 75% cumulative proportion of variance explained.
The results (Table 4) indicated that the first four components accounted for 83.7% of the total variation, whereas, the remaining 4 components accounted for only 16.3% of the morpho-agronomic diversity. PC I explained the most variability (36.1%), followed by PC II (22.3%), PC III (15.4%) and PC IV (10.0%). In the first principal component, DM, TSW, NSPP and NTPP were more important traits contributing more to the variation and this component was more associated with the high values of the above traits negatively.
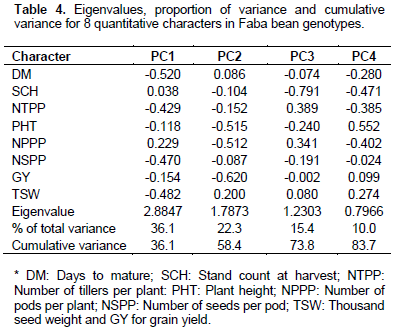
The sign indicates the direction of the relationship between the components and the characters (Yemane and Fasil, 2002). Due to more variation explained by the PC 1 (Table 4), its scores could effectively represent the genotype effect (Ali et al., 2011). In the second principal component, the observed variation (22.3%) was caused mainly by GY, PHT, NPPP and TSW and of which, TSW had positive relationship with this PC. PC III was positively dominated by the effect of number of tillers per plant and number of pods per plant and negatively by stand count at harvest. On the other hand, Plant height, stand count at harvest and number of pods per plant in the fourth principal component constituted large part of the total variation. In this experiment, the PC analysis ultimately showed the amount of variability for the traits that could be used for the improvement of large seed sized faba bean genotypes.
The combined analysis of variance for thousand seed weight indicated that there were highly significant (p < 0.01) differences among genotypes over locations. Genotype EH 06007-2 ranked highest in thousand seed weight followed by EH 06088-6 and EH 06007-4 as 1111, 971.5 and 938.5 g, respectively. The standard check (Hachalu) recorded low thousand seed weight (696 g) as compared with most faba bean genotypes under study. In addition, genotypes that out yielded the standard checks (Walki and Hachalu) in grain yield also had better seed size and lower disease reaction. In 2015, the faba bean crop was not attacked by diseases in Hashenge location and severity scores at Aiba location for Chocolate Spot and Ascochyta Blight were generally low to moderate.
Based on the inter-cluster Gower distance and relationships, the highest distance (0.692) was between cluster V and IV, which suggested that the members of these clusters diverge on most of the studied traits and could be used in breeding programs. The lowest distance (0.148) was between cluster III and cluster I, suggesting that their maternal origin may be very closely related. PCA showed that the first 4 PC accounted for 83.7% of the variability.
The authors have not declared any conflict of interest.
The author thanks Melkassa and Holleta Agricultural Research Centers for providing the faba bean genotypes as planting materials; Alamata Agricultural Research Center for providing the financial and services facilities during the research study as well as Mr Teklay Abebe, the center director and Crop Pathologist of Alamata Agricultural Research Center in his technical support in relation to his study.
REFERENCES
|
Al Barri T, Shtaya JYM (2013). Phenotypic characterization of Faba bean (Vicia faba L.) landraces grown in Palestine. J. Agric. Sci. 5(2):1916-9752.
Crossref
|
|
|
|
Ali MK, Akinci C, Donmez E (2011). Assessment of genotype x environment interaction on yield and yield components of durum wheat genotypes by multivariate analyses. Afr. J. Biotechnol. 10(15):2875-2885.
Crossref
|
|
|
|
|
Beniwal S, Dereje G (1987). Disease of Faba bean in Ethiopia EPC Newsletter.
|
|
|
|
|
Biruk B (2009). Production and marketing activity of broad bean in Ethiopia. Ethiopia Commodity Exchange Authority Report. pp. 10-11.
|
|
|
|
|
Central Statistical Agency (CSA) (2013). Report on area and production of major crops (private peasant holdings, meher season). Stat. Bull. 1(532):10-14.
|
|
|
|
|
Couchman J, Hollaway KH (2016). Victorian Winter Crop Summary 2016.
|
|
|
|
|
Diana DS (1999). Principal Component Analysis vs. Exploratory Factor Analysis.mUniversity of Northern Colorado. USA pp. 203-230.
|
|
|
|
|
Getachew A, Asnake F, Ayalew T (2003). Cropping systems, soil fertility and crop management research on cool-season food legumes in the central highlands of Ethiopia. In: Kemal Ali, Gemechu Kenneni, Seid Ahmed, Rajeandra, S, Beniwal, S., Makkouk, K.and Haiiia, M. (Eds). Food and Forage Legumes of Ethiopia: Progress and Prospects. Proceedings of the Workshop on Food and Forage legumes, 22-26 September 2003. Addis Ababa, Ethiopia. pp. 135-178.
|
|
|
|
|
Gomez KA, Gomez AA (1984). Statistical Procedure for Agricultural Research (2nd Ed.). John Wiley and Sons, New York.
|
|
|
|
|
Gower JC (1971). A general coefficient of similarity and some of its properties. Biometrics 27:857-871
Crossref
|
|
|
|
|
Hammer Ø, Harper DAT, Ryan PD (2001). PAST: paleontological statistics software package for education and data analysis (version 2.15). Palaeontol. Elect. 4:9.
|
|
|
|
|
Kumar RG, Sreewongchai T, Nakasathien S, Phumichai C (2013). Phenotypic variation and the relationships among jute (Corchorus species) genotypes using morpho-agronomic traits and multivariate analysis. Austr. J. Crop Sci. 7(6):830-842.
|
|
|
|
|
Minitab (1998). MINITAB User's guide, Released 14.0, MINITAB Inc.
|
|
|
|
|
MoARD (2008). Animal and Plant Health Regulatory Directorate: Crop Variety Register, Issue No. 12. Addis Ababa, Ethiopia.
|
|
|
|
|
SAS (1999). SAS User's guide, Released 8.2 editions. SAS Institute Inc., Cary, NC, USA.
|
|
|
|
|
Tekalign M, Richter C, Heiligtag B (2002). Phosphorus availability studies on ten Ethiopian Vertisols. Journal of Agriculture and Rural Development in the Tropics and Subtropics 103(2):177-183.
|
|
|
|
|
Teklay A, Tsehaye B, Yemane N, Assefa W (2014). The prevalence and importance of Faba bean diseases with special consideration to the newly emerging "Faba bean gall in Tigray, Ethiopia. Discourse J. Agric. Food Sci. 2(2):33-38.
|
|
|
|
|
Temesgen A, Aemiro B (2012). Genotype X Environment interaction and stability analysis of Faba bean (Vicia faba L.) varieties in North Ethiopia. Libyan J. Int. 3(4):195-200.
|
|
|
|
|
Yemane T, Fassil K (2002). Morphological diversity and geographic distribution of adaptive traits in finger millet (Eleusine coracana (L.) Gaertn. Subsp. coracana [Poaceae]) populations from Ethiopia. Addis Ababa, Ethiopia.
|
|