ABSTRACT
This paper aims to examine road fatalities using a GIS approach in Trinidad in an effort to provide recommendations on how road collisions and the number of casualties can be mitigated. In order to achieve this, the paper has examined a number of maps of Trinidad. The study examined data generated from maps of Trinidad using the Arc GIS Maps 10 software. Different variables were used to manipulate the data and these were road incidents by administrative area, municipalities, population density and socio economic status in Trinidad. The data generated represented the period 2005 to 2011 from 355 locations across Trinidad. From the data analyzed, it is clear that there is a positive correlation between the number of fatalities and the economic status of an area as well as the population of the area. From the data represented in the maps, it is clear that in regions with high population and numerous intersections such as City of San Fernando, Tunapuna, Port of Spain, San Juan, Laventille, and Diego Martin the number of road fatalities was high. The findings established in the study can allow for change in: (i) Road Traffic legislation and control measures and (ii) infrastructural redesign and implements.
Key words: Geographic information system, Trinidad, road traffic fatalities.
Road fatalities claim a significant number of lives in Trinidad and Tobago. Collisions can be attributed to human error or natural factors (Elvik, 2009). The road network is the most widely used form of transport since it is the cheapest form of transport for both goods and passengers over short distances (E.C.D, 2001). Thus road fatalities continue to remain one of the leading causes of death worldwide as it claims millions of lives across the world (Albrecht, 2011). Road transport is estimated to cause more than 1.2 million deaths annually (WHO, 2012). The fundamental aim of the analysis is to depict the usefulness of reducing road fatalities by undertaking a GIS approach to doing so. The paper will use Trinidad as the geographic location and represent key data useful for making recommendations geared toward reducing road fatalities. The findings from the maps generated from the GIS approach will be discussed with relevant inferences and recommendations.
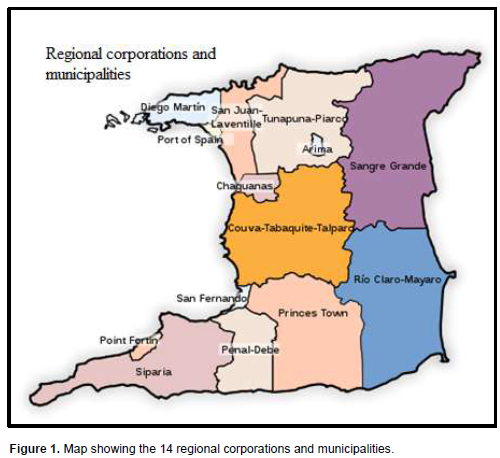
A Geographic Information System (GIS) is an information system that deals with a variety of geographical data. It is able to capture, store, analyze and manipulate this geographical data so that easier conclusions can be made. This is mainly because geographical data for specific regions is available and this data can be manipulated using GIS software in order to study a specific geographical area. GIS can be made to the researchers’ specifications and is therefore very important in analysis of data of a geographic area. Therefore GIS is an important tool in analyzing road fatalities in a given geographical area. Trinidad is made up of 14 regional corporations and municipalities. These are shown on the map in Figure 1. The map shown above demonstrates the 14 regional corporations and municipalities of Trinidad. Of the 14 regional corporations and municipalities, nine are regions while five are municipalities. These form the main administrative regions of Trinidad and will guide the basis of the research. Data for these municipalities and corporations were retrieved in order to help determine variables such as fatality by administrative area, municipality, population density and socio-economic status.
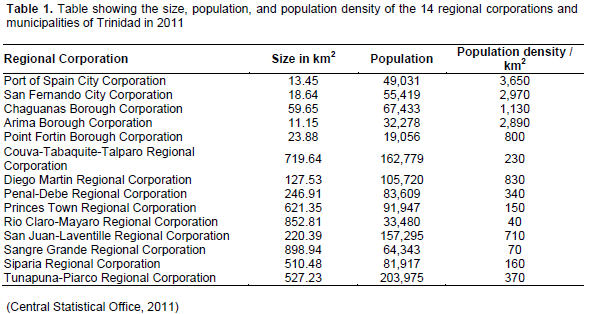
In order to determine the collision prone areas of the island, information on the locations of RTCs for the period 2000-2011 were obtained from the Central Statistical Office of Trinidad and Tobago and cross-referenced with accident reports from the Traffic and Highway Patrol Unit (Table 1). The researcher and two assistants visited each site, utilizing a handheld GIS monitor, Trimble Juno SB Outdoor Handheld GPS GIS Mapping data collector. The data were collected from 335 locations within the different Municipalities in Trinidad. The co-ordinates for each location were obtained and documented. Maps were developed using Arc GIS Maps 10. The data analyzed were collected as described above and contained information on the incidence of road fatalities. This information includes total number of road incidents and fatalities by administrative area, Municipal Corporation, population distribution and socio-economic status of the community. These factors will be used to determine the trend of collisions using Geographic Information Systems (GIS).
The results from the research is divided into different subsections as it relates to the administrative areas, municipalities and population distribution using the GIS approach in Trinidad.
Total number of fatalities by administrative area
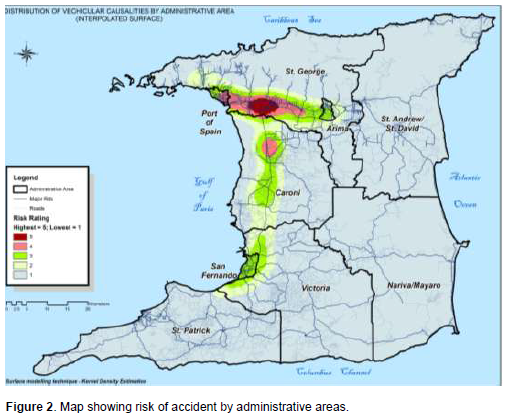
The map shown demonstrates the areas prone to collisions in different administrative regions (Figure 2).
From the map above, it is clear that the following regions that are prone to higher road traffic fatalities are Saint George, San Fernando, and Caroni administrative areas. In contrast, the Northern and Southern sections of the map have minimal collisions. This indicates that the areas that are more prone, have a higher number of road traffic casualties. On the other hand, areas less prone to collisions have few casualties. It can also be assumed that the number of vehicles in the high prone collision areas is higher as compared to the lower prone areas. This leads to an increase in the number of casualties due to collisions in the high prone areas.
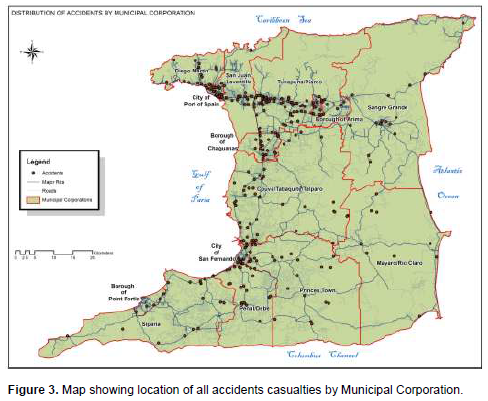
Accident casualties by Municipal Corporation
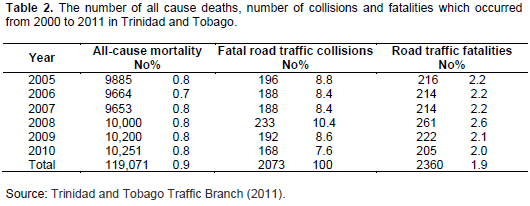
The map in Figure 3 demonstrates the number of collisions or events by Municipal Corporation. The number of collisions or events is greatly concentrated in the City of San Fernando, Tunapuna, City of Port of Spain, San Juan, Laventille and Diego Martin. The other regions have sparsely distributed road fatalities. The following is a list of the number of collisions in all regions in decreasing order; City of San Fernando, Tunapuna, City of Port of Spain, San Juan, Laventille, Diego Martin, Borough of Arima, Couva, Borough of Point Fortin, Siparia, Penal, Princes Town and Mayaro. Population distribution: Table 2 illustrates the regions with the highest population and population density in the area. All other areas have population densities that are below1000 / km2. Information on the population and size of the regional corporations and municipalities are shown in the table below. Port of Spain City Corporation, San Fernando City Corporation, Chaguanas Borough Corporation, and Arima Borough Corporation represent the four major metropolitan areas in the country and have higher amounts of traffic flow given the fact that it is more populated than other regions within the country. From the table, these regions have a population density of 3,650 / km2, 2,970 / km2, 1,130 / km2, and 2,890 / km2 respectively.

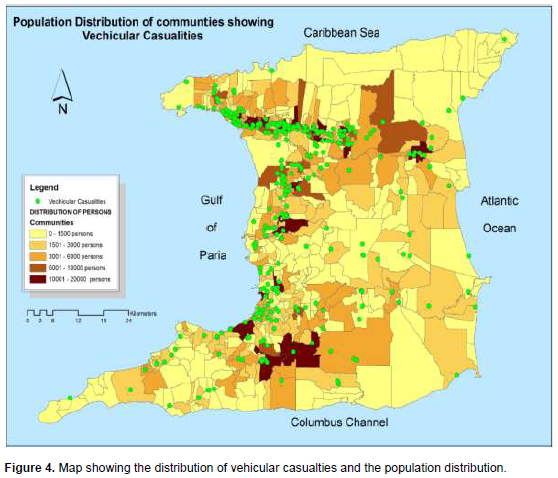
The Arc GIS 10 Map in Figure 4 shows the distribution of vehicular casualties and the population distribution. It can be seen that in regions with low population density that is 0 to 1500 people and 1501 to 3000 people, the number of collisions are low. Only a few collisions have been noted in the 0 – 1500 people region. This is especially in the Northern and Southern regions of the map. The number of vehicular collisions is greatly concentrated in regions with populations of 6001 – 10000 people and 10001 and 20000 people. This indicates that collisions are prevalent in the regions that are densely populated.
Socio-Economic status of community
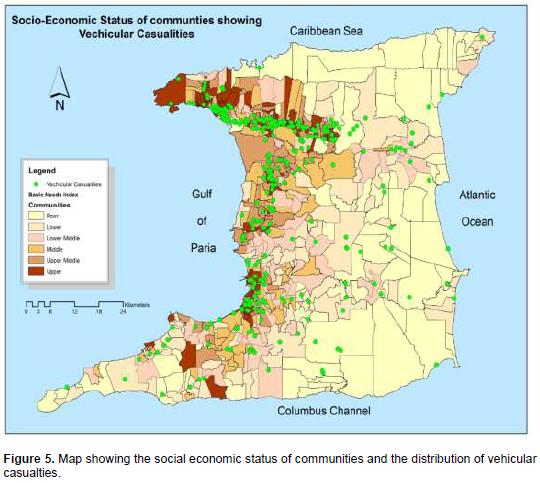
The map in Figure 5 shows the distribution of vehicular casualties and the socio-economic status of the communities. The map illustrates the regions with poor, lower and lower middle class communities the numbers of collisions are low. This is especially in the north eastern and south eastern regions of the map. The number of vehicular collisions is greatly concentrated in regions where middle class, upper middle class and upper class individuals. This is frequent for the regions that have upper class individuals. This indicates that collisions are prevalent in the regions where the population is of better socio economic status.
During the period from 2000 to 2011, 119,071 persons died from all causes in Trinidad and Tobago; of these, road fatalities accounted for 2360 deaths (≈2.0%) in 2,073 fatal collisions (≈1.1 deaths per collision) (Trinidad and Tobago Traffic Branch, 2011). The annual number of fatalities caused by road traffic collisions averaged 196.6, ranging from a low of 126 (or 1.3%) in the year 2000 to a high of 233 (or 2.6%) in 2008. The year to year variation in the number of fatal collisions was 5.6% to 10.4%. Over 56% of the collisions (1170) and 56% of the fatalities (1323) occurred during the period 2005 to 2011. By studying the data retrieved from using the Arc GIS 10 Mapping software, inferences regarding road traffic incidents in Trinidad can be made and is useful in discussing the recommendations to reduce the incidence of such. Geographical representation of data helps the researcher identify the target population to which modifying risky driving behavior can be focused on as well as the areas where these should be implemented. It can also help suggest the type of safety implements that can be made e.g. crosswalks, more pavements, traffic signs, stronger traffic warden presence, given that there were a higher amount of road traffic incidents in the metropolitan areas (Port of Spain, Arima, San Fernando and Chaguanas) in Trinidad.
According to Abdalla et al. (1997), collisions are prone to occur in highly populated areas and areas with middle and upper class economic status. This is mainly because in these areas there are high populations as well as the number of vehicles in this region are high. Based on the data analyzed from the maps, it was found that there was a positive correlation between the number of fatalities and the economic status of an area as well as the population of the area (1001-20000 persons). Therefore, it is important to ensure that recommendations are made in order to ensure that casualties are reduced in these areas. Traffic enforcement cameras or speed cameras have been an important tool that has been used by law enforcement authorities in many countries (New Zealand, 2002). Speed cameras work by ensuring that motorists stick to laid out traffic rules such as maintaining a certain speed limit, correct use of lanes and the enforcement of traffic light regulations. This would be applicable in the municipalities where the numbers of casualties are high such as Port of Spain, Arima, Chaguanas and San Fernando as well as the administrative areas such as Saint George, San Fernando and Caroni. Government policy can be used to ensure that in such areas traffic enforcement cameras are installed in order to ensure that accident casualties caused by drivers who do not stick to traffic rules are reduced (Hayes and Great Britain, 2008). Speed cameras should also be installed in areas where the population density is high, such as the City of San Fernando, Tunapuna, Port of Spain, San Juan, Laventille and Diego Martin. From the analysis carried out it can be inferred that the largest number of collisions occur in regions with the highest population. This may be due to the number of cars and commercial activity in the areas. Therefore, the installation of speed cameras in these areas will help reduce the number of collisions in this region (Pilkington and Kinra, 2005).
Automatic in-pavement lights can be installed to alert drivers of pedestrians in cases of inevitable poor visibility. Under such conditions, a driver is less likely to see a pedestrian or an oncoming vehicle leading to an accident. Increasing the visibility of road layouts can be used to reduce the number of road collisions. Drivers are involved in collisions, especially at night, for lack of proper road view (Gielen et al., 2006). This can be accomplished by using reflective surfaces to demarcate lanes. Road studs that use LED can also be used for demarcation (National Research Council (U.S.), 2000). These measures enhance the drivers’ awareness of the road layout especially at night. This will reduce head-on collisions while increasing lane discipline at the same time. The study and data generated from the GIS approach indicates that regions with high population such as City of San Fernando, Tunapuna, Port of Spain, San Juan, Laventille, and Diego Martin, the number of road intersections is high. This is mainly because these regions are highly populated and have a high number of feeder roads joining the main roads. It is evident from the data analysis carried out and the maps developed that most accident fatalities occur between the Tragarete Road location and the Mausica region, which has a high population and a large number of intersections. Road intersections are also popular for having crashes involving pedestrians (Lee and Abdel-Aty, 2005). This can be attributed to high traffic as well as overwhelming coordinating demands on the drivers’ part. This can be mitigated by replacing intersections with single-lane roundabouts (Lee et al., 2003).
Re-engineering of roadways can significantly reduce road fatalities. According to Elvik (2009) a black spot is a region on the road that a high number of collisions tend to occur due to the physical nature of the road. These spots on roads are normally known for the high number of collisions occurrence. Such spots include sudden sharp bends or congested intersections. Such places should be addressed so that technologies like markings to direct traffic at complex intersections, road signs, secure waiting areas to serve parked vehicles and sightlines can be implemented (Venglar et al., 2007). These measures can provide drivers with sufficient warnings. This reduces the number of decisions a driver has to make in collision-prone spots on the road. This in turn, reduces road fatalities resulting from collisions (Elvik, 2009). In regions with high population, multi-way stop signs can be employed where roundabouts cannot replace inter-sections (National Research Council (U.S.), 2010). These are stop signs placed where there is a junction. This helps to reduce number of accident casualties at intersections and junctions (National Research Council (U.S.), 2010). These multi-way stop signs are more effective at controlling vehicle speeds compared to two-way stop signs and traffic signal control. In addition, they will help in controlling the high population flow within the roads (National Research Council (U.S.), 2010).
In regions with high population and high economic status the conspicuity and visibility of pedestrians is important in order to reduce road fatalities. The implementation of proper measures can increase the conspicuity and visibility of pedestrians. This measure should be effective as most drivers blame poor visibility for pedestrian crashes (Elvik, 2009). The visibility of pedestrians can be increased in a number of ways. These include; crosswalk markings, increased roadway lighting intensity, bus stop relocation, warning signs with internal illumination and diagonal parking (Elvik, 2009) 1. Increased lighting illuminates pedestrians especially at night. This reduces fatalities associated with nighttime road collisions (McGee, 2013). National Cooperative Highway Research Program, American Association of State Highway and Transportation Officials and United States, 2013). According to Zegeer and Turner-Fairbank Highway Research Center (2002), such measures have been implemented in the United States in order to reduce road fatalities. Traffic calming techniques have proven to be efficient in reducing the number of road fatalities and road collisions. These techniques include; speed humps, pedestrian refuge islands, roadway curvature adjustment and lane narrowing. When implemented, these techniques reduce vehicle speeds. Consequently, crashes involving pedestrians are reduced (Elvik, 2009). Barriers and fences can also be used to channel pedestrians towards safe crossing areas. These techniques can be used on intersections where traffic is managed using signals (Day et al., 2007).
The representation of geographical data assists with planning, monitoring and program design in terms of geographic location. The paper shows how data and statistical representation can easily be depicted via the use of maps to illustrate exactly where were prone to road fatalities and areas of high incidence. The analysis focused on how a GIS approach can be used to track and monitor road fatalities with the aim of reducing its incidence rate. The findings were represented in maps generated using the Arc GIS 10 mapping software and contains key information pertinent that can be used to for program design and implementation to road traffic laws and regulations as well as communication campaigns. The data informs public health and program designers of the geographical areas that focus should be concentrated. The maps represented data on road fatalities based on municipalities, population density and socio-economic status. These factors can help devise ways to reduce road fatalities based on geographic findings and inferences.
The authors have not declared any conflict of interests.
REFERENCES
|
Abdalla IM, Raeside R, Barker D, McGuigan DR (1997). An investigation into the relationships between area social characteristics and road accident casualties. Accid. Anal. Prev. 29(5):583-593.
Crossref
|
|
|
|
Albrecht D, World Health Organization (2011). Transport (road transport): Shared interests in sustainable outcomes. Geneva: World Health Organization.
|
|
|
|
|
Central Statistical Office (2011). Trinidad and Tobago 2011 Population and Housing Census Demographic Report. Retrieved 13 June 2014.
|
|
|
|
|
Day K, Anderson C, Powe M, McMillan T, Winn D (2007). Remaking Minnie Street. J. Plann. Educ. Res. 26(3):315-331.
Crossref
|
|
|
|
|
Economic Co-operation and Development (ECD) (2001). Intermodal Freight Transport: Institutional Aspects. Paris: Organization for Economic Co-operation and Development.
|
|
|
|
|
Elvik R (2009). The handbook of road safety measures. Bingley, Trinidad: Emerald.
Crossref
|
|
|
|
|
Gielen AC, Sleet DA, DiClemente RJ (2006). Injury and violence prevention: Behavioral science theories, methods, and applications. San Francisco, CA: Jossey-Bass.
|
|
|
|
|
Hayes M, Great Britain (2008). Widening the reach of road safety - emerging practice in road safety in disadvantaged communities: Practitioners' guide. London: Dept. for Transport.
|
|
|
|
|
Lee C, Abdel-Aty M (2005). Comprehensive analysis of vehicle–pedestrian crashes at intersections in Florida. Accid. Anal. Prev. 37(4):775-786.
Crossref
|
|
|
|
|
Lee JC, Robinson B, Kidd BD, Scarbrough W (2003). Roundabouts: An Arizona case study and design guidelines. Phoenix, Ariz: Arizona Dept. of Transportation.
|
|
|
|
|
McGee HW (2013). National Research Council (U.S.) National Cooperative Highway Research Program, American Association of State Highway and Transportation Officials, & United States.. Practical highway design solutions.
|
|
|
|
|
National Research Council (U.S.) (2000). Design speed, operating speed, and sight distance issues. Washington, D.C: National Academy Press.
|
|
|
|
|
National Research Council (U.S.) (2002).Statistical methodology: Applications to design, data analysis, and evaluation. Washington, D.C: Transportation Research Board.
|
|
|
|
|
National Research Council (U.S.) (2009). Pavement management systems and other pavement design issues. Washington, D.C: National Academy Press.
|
|
|
|
|
National Research Council (U.S.) (2010). Highway design, 2010. Washington, D.C: Transportation Research Board of the National Academies.
|
|
|
|
|
National Research Council (U.S.). (2000). Design speed, operating speed, and sight distance issues. Washington, D.C: National Academy Press.
|
|
|
|
|
New Zealand (2002). Bringing down the road toll: The speed camera programme : report of the Controller and Auditor-General, Tumuaki o te Mana Arotake. Wellington, N.Z: Audit Office.
|
|
|
|
|
Pilkington P, Kinra S (2005). Effectiveness of speed cameras in preventing road traffic collisions and related casualties: systematic review. BMJ 330(7487):331-334.
Crossref
|
|
|
|
|
Road safety and speed management (2005). London, England: Trinidad. Dept. for Transport. Commission for Integrated Transport. Motorists Forum.
|
|
|
|
|
Saito M, Lowry M (2005). Evaluation of four recent traffic and safety initiatives: Volume I: Developing guidelines for roundabouts. Salt Lake City, UT: Utah Dept. of Transportation, Research and Development Division.
|
|
|
|
|
Thomas R, Parliamentary Advisory Council for Transport Safety (Great Britain) (2011). Road safety: Towards 2020. London: Local Transport Today in association with Parliamentary Advisory Council for Transport Safety.
|
|
|
|
|
Trinidad (2005). Interpretation of the European Agreement concerning the International Carriage of Dangerous Goods by Road (ADR): Prohibition on smoking during the carriage of class 1 dangerous goods by road. Geneva: UN.
|
|
|
|
|
Trinidad and Tobago Traffic Branch (2011). Accident fatalities for the period 2005-2011.
|
|
|
|
|
United Nations Human Settlements Programme (2007). Enhancing urban safety and security: Global report on human settlements 2007. London: Earthscan.
|
|
|
|
|
Vachal KJ, Malchose D, Benson L (2011). Upper Great Plains Transportation Institute. Using laws, enforcement, and sanctions to increase seat belt use on rural roads. Fargo ND.: Upper Great Plains Transportation Institute, North Dakota State University.
|
|
|
|
|
Venglar SP, Obeng-Boampong KO (2007). Texas & Texas Transportation Institute. Applying techniques to increase warning of signals beyond vertical curves. College Station, Tex: Texas Transportation Institute, Texas A & M University System.
|
|
|
|
|
World Health Organization (WHO) (2009). Global status report on road safety time of action. pp. 1-3.
|
|
|
|
|
World Health Organization (WHO) (2012). World report on Road Traffic injury prevention. Chapter 3 Risk Factors.
|
|
|
|
|
Zegeer CV (2002). Turner-Fairbank Highway Research Center Pedestrian facilities users guide: providing safety and mobility. McLean, Va: U.S. Dept. of Transportation, Federal Highway Administration, Research, Development and Technology, Turner-Fairbank Highway Research Center.
|
|