Full Length Research Paper

ABSTRACT
This research has demonstrated conflicting findings related to how environmental factors may affect the spread of tuberculosis (TB). A better understanding of this may have implications for health planning given the changing world climate. This study examines environmental factors, specifically elevation and temperature, demographic and income covariates and their association with TB incidence within the Appalachian region. County-wide TB incidence data were collected from the thirteen states within the Appalachian region for the most recent year available, 2017 or 2018, along with data from the American Community Survey for the corresponding year. A correlation analysis was performed followed by multiple negative binomial regression models to find models with the best fit. The analyses identified clusters of incident TB cases distributed throughout the Appalachian region. Hot spots (that is, highly positively autocorrelated geographic locations) utilizing Getis-Ord Gi* were found within the Southern portion of the Appalachian region while clusters utilizing Anselin local Moran’s I were more spread throughout the region. Temperature was found to be significantly associated with TB incidence in all models, but ethnic distribution explained some of the variation. Future research could benefit from replicating this study with longitudinal data to assess how temperature changes over time affect TB incidence.
Key words: tuberculosis, Appalachia, temperature, elevation.
INTRODUCTION
While tuberculosis (TB) incidence has declined, it remains one of the top ten leading causes of death globally with an estimated 10 million cases and 1.4 million deaths worldwide in 2019 (World Health Organization [WHO], 2020).
However, the distribution of cases is not uniform and certain areas and nations are disproportionately affected. The effect that temperature and elevation may have on TB transmission is a particularly pertinent question given concern that the rapidly changing world climate may effect disease transmission (Caminade et al., 2019) and may introduce organisms to higher elevations than previously seen (Pauchard et al., 2016). A greater understanding of how elevation and TB transmission potentially interact may allow researchers to predict new areas of spread and assist in the prevention and treatment planning. These questions may particularly benefit the Appalachian region, a region where 15.8% of residents live below the poverty line (Pollard and Jacobsen, 2020) and the supply of physicians is 12% lower than the national average (Appalachian Regional Commission, 2017) making it particularly vulnerable to infectious diseases such as TB.
Historically, higher geographic elevations have been presumed to be ideal treatment locations for individuals with active TB (Amrein, 1921, 1929) due to lower temperature, lower barometric pressure, and high levels of sunshine which were thought to assist individuals to heal (Amrein, 1921). However, these historical studies have generally focused on the effect elevation has on the treatment process once an individual is infected and less emphasis has been placed on the effect that altitude may have on the incidence of disease. Recent research into elevation and TB incidence have focused on how TB may spread within samples at differing elevations (Eisen et al., 2013) as well as examining covariates associated with clinical records (Pérez-Guzmán et al., 2014) government-provided incidence rates (Sun et al., 2015), and imputing incidence in data-limited settings (Tadesse et al., 2018).
Recent studies have also shown conflicting information regarding temperature's effect on TB incidence. While some studies have shown a negative association between temperature and TB incidence (Li et al., 2019; Mollalo et al., 2019; Zhang and Zhang, 2019; Huang et al., 2020; Xu et al., 2020) other studies have shown positive associations between increasing temperatures and both TB notification (Bonell et al., 2020) and poor TB treatment outcomes (Alene et al., 2019). In addition, a recent systematic review of nine articles demonstrated that TB notification increases with lowering altitude and higher temperature (Gelaw et al., 2019). Other studies have shown non-significant results overall (Jaganath et al., 2019; Kirolos et al., 2021) while sub-group analyses revealed both positive and negative associations depending on the sub-group (Kirolos et al., 2021). However, while these studies have focused on various populations, only one of these analyses took place within the United Stated and to our knowledge this is the first study to investigate the effect of both temperature and elevation on TB incidence within the Appalachian region.
In this research, the primary objectives were to 1) determine covariates associated with TB incidence by constructing multiple negative binomial regression models and 2) determine geolocations of potential intervention sites for treating TB in the Appalachian region of the United States by generating a hot spot analysis.
MATERIALS AND METHODS
The Appalachian region is a section of the United States spanning over 530,000 square kilometers and 420 counties and consists of a population of 25.7 million individuals as of 2018 (Appalachian Regional Commission, n.d.-a). The region spans thirteen states consisting of portions of twelve states in addition to the entirety of West Virginia which is contained completely (Appalachian Regional Commission, n.d.-a). Much of the region is rural with 107 of the counties classified as such (defined as non-metropolitan counties not adjacent to metropolitan areas) and the Appalachian mountains contained within the region (Appalachian Regional Commission, n.d.-a). The majority of the Appalachian population identifies as Non-Hispanic, White (81.0%) with higher minority populations concentrated in the larger metropolitan areas (Appalachian Regional Commission, n.d.-a). The mean income of Appalachian households was 80% that of the national average in 2018 and the percentage of individuals living in poverty was 15.8%, over 1% point higher than the national percentage of 14.1% (Appalachian Regional Commission, n.d.-a).
County-wide TB incidence data were obtained through individual State Health Department websites for all thirteen states located within the Appalachian region (Alabama Public Health, 2019; Georgia Department of Public Health Tuberculosis Control Program, 2019; Kentucky Public Health, 2018; Maryland Department of Health, 2018; Mississippi State Department of Health, n.d.; New York State Department of Health, 2019; Ohio Department of Health, 2019; Pennsylvania Department of Health, n.d.; South Carolina Department of Health and Environmental Control, 2018; Tennessee Department of Health TB Elimination Program, 2019; Virginia Department of Health Tuberculosis Program, 2018; West Virginia Department of Health and Human Resources: Bureau of Public Health, 2018). While all thirteen states within the Appalachian region legally require TB cases to be reported to local health authorities, selection bias cannot be completely ruled out since individuals who may not have access to healthcare providers may not be accounted for. County data was collected for the most recently available year by state, 2017 for Kentucky and West Virginia counties and 2018 for the remaining counties. Covariate and population data were then obtained for the corresponding incidence year. Population estimates for standardization were obtained from the 5-year estimates for the United States Census Bureau’s American Community Survey at the county level. County incidence and covariate data were merged into a Microsoft Excel spreadsheet and connected by standard Federal Information Processing System (FIPS) codes. County designation within the Appalachian region was designated by the Appalachian Regional Commission (n.d.-b) and counties not included within this designation were removed from the dataset.
Due to variations in state reporting groupings, incidence data were imputed in two separate and distinct ways. Maryland incidence data were originally grouped into cities and an aggregate “rural counties” which contained data for the three counties within the Appalachian region. To facilitate comparison, 5-year population estimate data were utilized from the U.S. census’ American Community Survey to impute an adjusted incidence estimate. As a result, the estimated rates for these three counties were by nature identical and allow only for comparison with counties outside of Maryland. South Carolina, Georgia, and Pennsylvania de-identified low incidence numbers between 1 to 4 and designated them collectively as “<5”. To allow for comparison, three distinct models were developed within the analyses. The first model, designated “Only Accurate”, excluded counties with the designation “<5”. The second model assumed a low estimation for these counties equal to one case per county, “Low Estimates Assumed”. Likewise, the third model assumed a high incidence equal to four cases per county, “High Estimates Assumed”. Apart from counties with the incidence designation of “<5”, all other county incidence numbers are the originally reported numbers and are identical in all models.
Age, sex, race, ethnicity, and the percentages of households receiving supplemental nutrition assistance program benefits (SNAP) or food stamps were extracted at the county level from 5-year estimates of the United States Census Bureau’s American Community Survey (United States Census Bureau, 2017; United States Census Bureau, 2018). Age was examined separately as median age per county and percentage of age groups categorically. Average temperature data were extracted from NOAA National Centers for Environmental information (NOAA National Centers for Environmental Protection, 2021) data at the county level for each of the thirteen included states. Average temperatures were taken for the period of January-December 2017 or 2018 dependent on TB incidence data for that state. The average elevation of each county was found using the Geographic Names Information System (GNIS) query tool provided by the U.S. Geological Survey (USGS) (1990-2016) to find elevation on the centroid location of county polygons. These elevation estimates varied in year of collection from 1990 to 2016 across counties and states.
A regression analysis using SAS version 9.4 was undertaken with the aim to identify whether elevation and temperature in combination with demographics and income factors are independently significant predictors of TB incidence at the county level. Statistical significance was defined as an obtained alpha level of 0.05 or lower. Prior to regression analysis, a correlation analysis using the “proc corr” procedure was conducted to ensure multicollinearity would not impair the projected models. After assessing the correlation matrix, models were assessed for overdispersion and a negative binomial model was decided upon for the regression rather than a Poisson model due to the significance of the overdispersion. After selecting model type, preliminary negative binomial regressions were fitted by covariate category and incidence rate ratios (IRR) were generated by exponentiating given coefficients. The incidence rates include TB incidence counts for one year and are assumed to be uniform for all observed counties. IRRs reflect the ratio of annual TB incidence at a given value of a predictor divided by the predicted TB incidence at a value of one less for the predictor.
A correlation analysis was undertaken with a cut-off value for correlations of positive or negative 0.30 such that all covariates with larger correlations than the cut-off value were not placed within the same model. Due to the nature of the outcome variable being a count, Poisson regression and negative binomial models were considered for fit. Due to concerns of the TB incidence counts being potentially skewed toward higher populations and cities, the log of the total population was used as an offset within the model to obtain regression estimates based upon incidence rates. Upon fitting the negative binomial model, it was discovered that the data was significantly over dispersed (p<0.01 for all models) and a negative binomial model was selected.
The authors ran two racial models to examine the effect of race, one including the county percentages of non-Black individuals (that is, white and “other” racial designation) individuals and one model including the county percentages of non-white individuals (that is, all races excluding white). Subsequently, a comparison of Akaike Information Criterion (AIC) values was completed to decide which model fit the data better. For modeling TB incidence with only exact data (no high and low values imputed for areas with de-identified data), the AIC was roughly the same for the two groups (Excluding white: 578.1411; excluding black: 578.1922) and it was decided to keep the model excluding white individuals due to its higher likelihood of illuminating racial disparities within the models and its slightly lower AIC value.
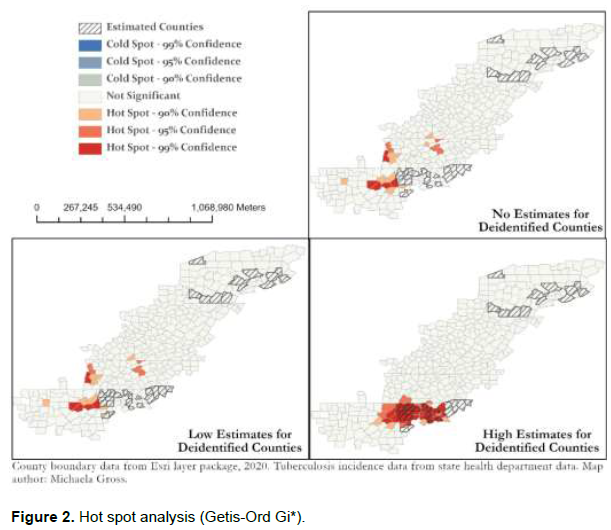
After this preliminary statistical assessment within SAS, a spatial cluster and outlier analysis using Anselin Local Moran’s I and a hot spot analysis using the Getis-Ord Gi* statistic were conducted within ArcGIS Pro version 2.5. After joining the data, the global Moran’s I test for spatial autocorrelation was run at distances of 55,000 to 125,000 meters in increments of 5,000 for each of the three TB rate estimates (only accurate, low, and high estimates assumed for deidentified counties) to establish the best distance band for the underlying data. Based on the first corresponding z-score peaks, a fixed distance band of 75,000 meters was chosen for the data without imputation and for low estimates assumed while a band of 85,000 was chosen for the high estimate data.
The hot spot and cluster and outlier analyses were performed using a False Discovery Rate (FDR) correction for both dependent and independent variables and with a fixed distance band. The fixed band was chosen because the data will be either the TB rate per 100,000 citizens (in the case of incidence) or average (in the case of temperature) for the entire county and fixed distance bands ensure a consistent scale of analysis. This was done to assess whether statistically significant hot spots and cool spots for TB incidence visually correspond with hot spots and cool spots for elevation and temperature as well as race, ethnicity, age, sex, and SNAP usage. A total of 9,999 permutations were run to identify statistically significant outliers for both dependent and independent variables and to provide a sufficient amount of precision within the analysis. This high number of permutations was chosen after an assessment of lower numbers of permutations was compared.
RESULTS
Table 1 demonstrates the obtained IRR values for the univariate models. In a univariate model containing only average elevation in meters, it was found that elevation was a non-significant predictor for TB incidence (IRR: 0.9988, p=0.0513) although borderline significance at the 0.05 level was achieved when data without low or high estimates were included. When TB incidence did have low estimates imputed for de-identified counties, elevation was a significant predictor (IRR: 0.9988, p<0.05) although this was not true for TB incidence with high estimates imputed (IRR: 0.9991, p=0.0779). Conversely, average temperature was a highly significant predictor in all univariate models containing only temperature (IRR: 1.1126, p<0.0001) regardless of how deidentified TB incidence data was estimated. Table 1 gives full details of these findings.
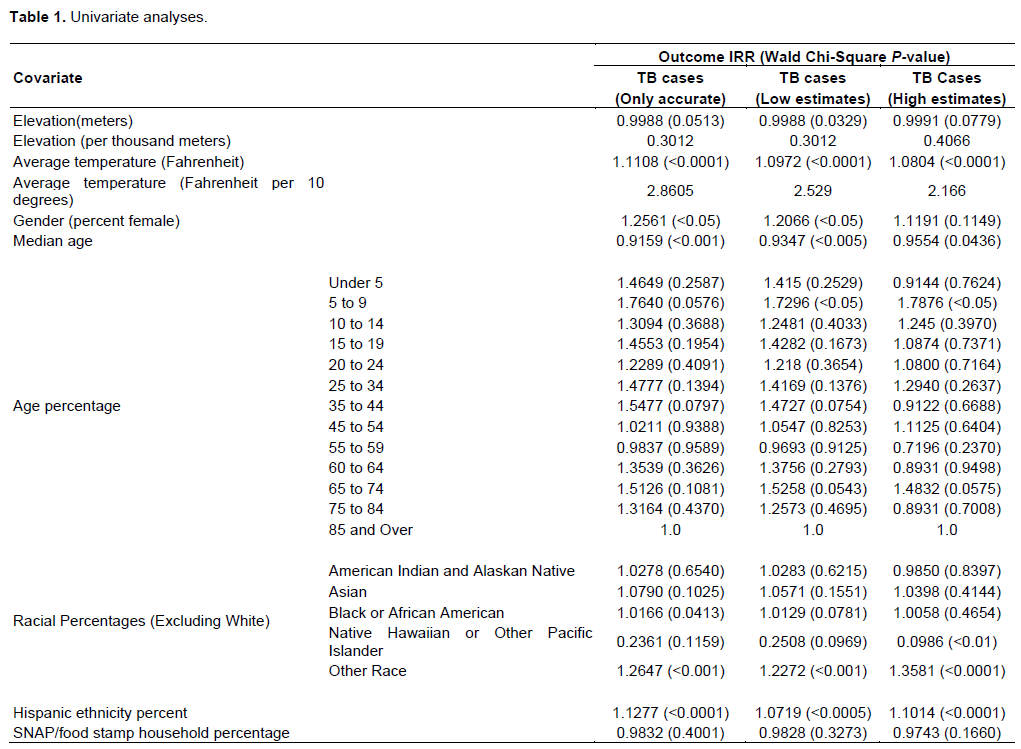
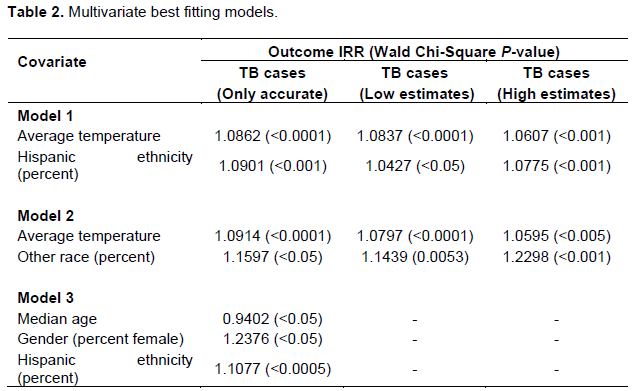
After preliminary examination of covariate groups, several models were additionally fitted to the data according to which variables were not heavily correlated within the previous assessment. AIC and BIC values were then utilized to assess best fitting models using backwards stepwise regression by deleting the most non-significant covariate from the model until a parsimonious model was reached. Results of the best fitting model assessment can be found in Table 2. It was found that the best fitting models found TB incidence was significantly predicted by both temperature and Hispanic ethnicity or a model containing temperature and Other Race. This was true for all three models, regardless of how deidentified data was handled (no estimation, low estimates, or high estimates).
After this preliminary statistical assessment within SAS, a spatial cluster and outlier analysis using Anselin Local Moran’s I was conducted within ArcGIS Pro version 2.5. For this analysis, a fixed distance band was utilized and a False Discover Rate (FDR) correction was applied. To increase efficiency, cluster models using 9999 permutations were the final choice and can be seen in Figure 1 for no estimates, low estimates, and high estimates for deidentified TB rates. These revealed similar cluster structures with a total of three to four High-Low outlier counties and several Low-High outliers and Low-Low clusters identified clusters throughout the Appalachian region. High-Low outlier counties indicate areas that experience statistically significantly high clustering as compared with surrounding counties while Low-High indicate the opposite and Low-Low clusters indicate areas with statistically low clusters of cases.
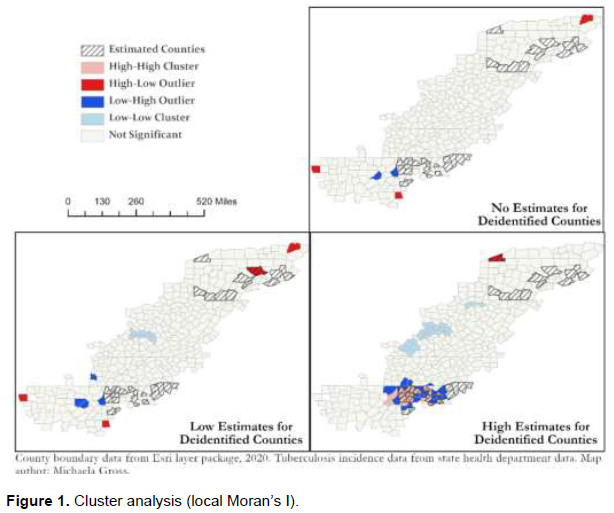
Within the high estimates, many counties were clustered around estimated value counties indicating this spatial clustering may be a false effect based on the imputation method. Specific counties are identified in supplemental Table 1.
Subsequent to the cluster and outlier analysis, a hot spot analysis utilizing Getis-Ord Gi* statistic was conducted and results can be seen in Figure 2. This revealed differing areas generally concentrated toward the Southern end of the Appalachian region for hot spots. Specifically identified counties can be found in Supplemental Table 2. No cold spots were identified which may reflect the number of counties with no reported TB cases for the time period. Additionally, in the model where de-identified TB incidence were assumed to be on the higher end of possible incidence numbers (four cases per county), hot spots were grouped around de-identified counties indicating these estimates may be partially to do with the resulting hot spots. However, areas surrounding this area to the West and East were statistically significant hot spots in both the model with no estimates and low estimates for de-identified counties indicating these areas may still be of concern due to their close proximity although this cannot be reliably determined without knowing the exact estimates.
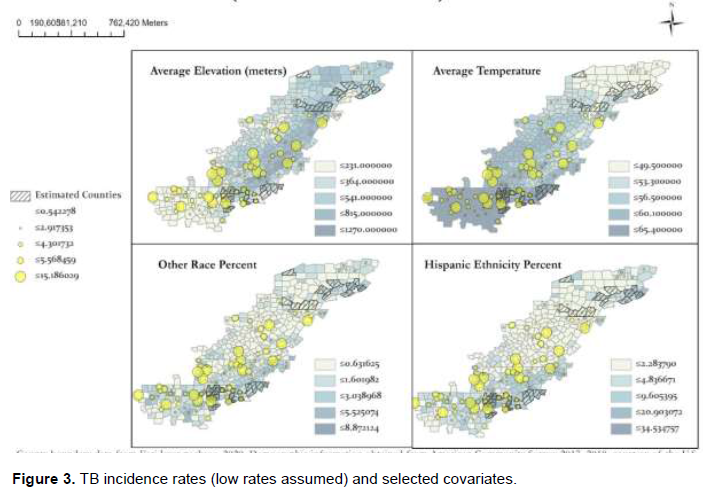
Finally, choropleth maps were developed for the previously mentioned covariates that were found to be statistically significantly associated with increasing TB rate incidence within the negative binomial models. These were then overlaid with graduated point markers increasing in size with TB incidence to visually display these associations. A visual examination of this data within Figure 3 reinforces the previous findings as very little association can be seen between elevation and TB incidence while a stronger association is indicated for temperature and TB incidence. Other covariates of “other” racial designation and Hispanic ethnicity demonstrate the slight associations previously seen within the negative binomial models.
DISCUSSION
This study examined the relationship between TB incidence and both environmental and demographic characteristics within the Appalachian region. During statistical assessment, univariate models suggested there may be a negative association between average elevation and TB cases suggesting that as elevation in meters goes up reported TB incidence tends to go down. However, these coefficients were only statistically significant in models with low imputed values and borderline significance was achieved when no imputation was undertaken. Accordingly, it is unclear whether elevation is a strong predictor for TB incidence and future research would benefit from more exact data than is publicly available. However, average temperature was highly significant in all univariate models regardless of how deidentified data was handled within the analysis and, importantly, this relationship was positive indicating that as average temperatures rise TB cases tend to rise as well.
This finding of rising temperature as a significant predictor of rising TB incidence may have vital implications for health planning. While only one other study has examined similar environmental predictors on TB notification within the United States, these authors did notably find the opposite effect that rising minimum temperature was protective and posited that this may be due to individuals living in colder temperatures also potentially living in closer proximity with each other allowing the disease to spread more readily (Mollalo et al., 2019). Future research would benefit from inclusion of covariates related to average number of household members which may help to examine whether living in closer quarters may explain some of the effect that temperature plays in predicting the spread of TB.
While the cluster and hot spot analyses revealed different areas that may be at higher risk for TB within the Appalachian region, these findings are not at odds with each other and may both be valuable for different kinds of health planning. While cluster analysis using the Anselin local Moran’s I statistic compares each county to its neighboring counties looking for statistically significant high and low values in relation to these surrounding counties, hot spot analysis using the Getis-Ord Gi* statistic indicates where high and low values cluster spatially. As a result, the hot spot maps demonstrate areas that may be particularly prone to TB within the entire region while the cluster maps reveal areas that may have atypically high numbers of incident TB cases considering the number in the surrounding counties. As can be seen in supplemental Table 2, many of the hot spots actually have zero cases reported but due to their close proximity to counties with higher incidence values, they are still of concern and are statistically significant hot spots. Health planners within the Northern Appalachian region may find it useful to use these cluster maps for resource allocation while the hot spot maps offer a perspective of areas of concern for the region overall.
In addition, there was considerable crossover between the hot spot and cluster counties identified for those with no estimates for deidentified counties and those identified within the low estimates for deidentified counties. Given the low number of absolute cases in many of the counties, this may imply that these two maps of clusters and hot spots may provide the most accurate representations. However, this is impossible to know without having exact data for these areas and, as such, all three estimates are provided such that researchers who do have access to this information can make health planning choices based on their additional knowledge.
The model which excluded counties with the designation of “<5” with no imputation contained a total of 395 counties out of the total 420 within the Appalachian region. As a result, while the population number is relatively low in absolute terms, the completeness of the available data does allow for a relatively complete dataset at the county level. However, given the small numbers of incidence rates at the county level within the Appalachian region (mean of 0.80 per 100,000 for non-imputed group) this does unfortunately inherently underpower this study and future research would benefit from access to more localized data that would allow for a more thorough examination at a lower spatial level and may illuminate further disparities.
There may also be factors specific to the Appalachian region that may affect how TB spreads there. For example, other studies outside of the United States have also demonstrated a significant association between rising temperature and rising incidence and have suggested that rising temperatures may affect the efficacy of drugs used for TB treatment and may thereby indirectly perpetuate the spread of TB within communities by making treatment more difficult (Alene et al., 2019). If so, it seems reasonable to expect that this effect would be seen more prominently in more rural communities like the Appalachian region where access to care may be more difficult and medications may need to be transported longer distances. In addition, while pollution particulates have been found to influence the association between rising temperatures and TB incidence (Zhang and Zhang, 2019), the current and historical industry of coal mining within the Appalachian region may also produce a similar effect and may factor into how the disease spreads within these communities.
CONCLUSION
CONFLICT OF INTERESTS
The authors have not declared any conflicts of interests.
REFERENCES
|
Alabama Public Health (2019). Annual tuberculosis morbidity report for 2018 by county and case rate. |
|
|
Alene KA, Viney K, Gray DJ, McBryde ES, Wagnew M, Clements ACA (2019). Mapping tuberculosis treatment outcomes in Ethiopia. BMC Infectious Diseases 19(1):474. |
|
|
Amrein O (1921). High altitude and tuberculosis. Tubercle 3(1):580-583. |
|
|
Amrein O (1929). The high altitude treatment of pulmonary tuberculosis. British Medical Journal 2(3599):1188-1191. |
|
|
Appalachian Regional Commission (n.d.-a). About the appalachian region. |
|
|
Appalachian Regional Commission (n.d.-b). Counties in Appalachia. |
|
|
Appalachian Regional Commission (2017). Creating a culture of health in Appalachia: disparities and bright spots. |
|
|
Bonell A, Contamin L, Thai PQ, Thuy HTT, van Doorn HR, White R, Choisy M (2020). Does sunlight drive seasonality of TB in Vietnam? A retrospective environmental ecological study of tuberculosis seasonality in Vietnam from 2010 to 2015. BMC Infectious Diseases 20(1):1-11. |
|
|
Caminade C, McIntyre KM, Jones AE (2019). Impact of recent and future climate change on vector-borne diseases. Annals of the New York Academy of Sciences 1436(1):157-173. |
|
|
Eisen S, Pealing L, Aldridge RW, Siedner MJ, Necochea A, Leybell I, Evans CA (2013). Effects of ascent to high altitude on human antimycobacterial immunity. PLoS One 8(9):e74220. |
|
|
Gelaw YA, Yu W, Magalhaes RJS, Assefa Y, Williams G (2019). Effect of temperature and altitude difference on tuberculosis notification: a systematic review. Journal of Global Infectious Diseases 11(2):63-68. |
|
|
Georgia Department of Public Health Tuberculosis Control Program (2019). Tuberculosis cases and case rates per 100,000 population by county, Georgia 2017-2018. |
|
|
Huang K, Yang XJ, Hu CY, Ding K, Jiang W, Hua XG, Zhang XJ (2020). Short-term effect of ambient temperature change on the risk of tuberculosis admissions: Assessments of two exposure metrics. Environmental Research 189:109900. |
|
|
Jaganath D, Wobudeya E, Sekadde MP, Nsangi B, Haq H, Cattamanchi A (2019). Seasonality of childhood tuberculosis cases in Kampala, Uganda, 2010-2015. PLoS One 14(4):e0214555. |
|
|
Kentucky Public Health (2018). Final report: Kentucky tuberculosis (TB) case incidence and rates for 2017 by county and development district. |
|
|
Kirolos A, Thindwa D, Khundi M, Burke RM, Henrion M Y, Nakamura I, MacPherson, P. (2021). Tuberculosis case notifications in Malawi have strong seasonal and weather-related trends. Scientific Reports 11(1):1-9. |
|
|
Li Q, Liu M, Zhang Y, Wu S, Yang Y, Liu Y, Guo X (2019). The spatio-temporal analysis of the incidence of tuberculosis and the associated factors in mainland China, 2009-2015. Infection, Genetics and Evolution 75:103949. |
|
|
Mollalo A, Mao L, Rashidi P, Glass GE (2019). A GIS-based artificial neural network model for spatial distribution of tuberculosis across the continental United States. International Journal of Environmental Research and Public Health 16(1). |
|
|
Maryland Department of Health (2018). Maryland tuberculosis incidence (general public use): new cases and rates per 100,000 population by jurisdiction and demographic features (2013-2018). |
|
|
Mississippi State Department of Health (n.d.). Mississippi tuberculosis cases 2018. |
|
|
New York State Department of Health (2019). Communicable disease in New York State cases reported in 2018. |
|
|
NOAA National Centers for Environmental Protection (2021). Climate at a Glance: County Mapping. |
|
|
Ohio Department of Health (2019). Ohio TB morbidity by county and seven major cities, 2014-2018. |
|
|
Pauchard A, Milbau A, Albihn A, Alexander J, Burgess T, Daehler C, Kueffer C (2016). Non-native and native organisms moving into high elevation and high latitude ecosystems in an era of climate change: new challenges for ecology and conservation. Biological Invasions 18(2):345-353. |
|
|
Pennsylvania Department of Health (n.d.). Pennsylvania communicable diseases (other than STDs): Crude/age-specific rates per 100,000. |
|
|
Pérez-Guzmán C, Vargas MH, Arellano-Macías MR, Hernández-Cobos S, García-Ituarte AZ, Serna-Vela FJ (2014). Clinical and epidemiological features of extrapulmonary tuberculosis in a high incidence region. Salud Publica de Mexico 56(2):189-196. |
|
|
Pollard KJ, Jacobsen LA (2020). The Appalachian region: a data overview from the 2014-2018 american community survey chartbook. |
|
|
South Carolina Department of Health and Environmental Control (2018). South Carolina tuberculosis incidence rates by county, 2014-2018. |
|
|
Sun W, Gong J, Zhou J, Zhao Y, Tan J, Ibrahim AN, Zhou Y (2015). A spatial, social and environmental study of tuberculosis in China using statistical and GIS technology. International Journal of Environmental Research and Public Health 12(2):1425-1448. |
|
|
Tadesse S, Enqueselassie F, Gebreyesus SH (2018). Estimating the spatial risk of tuberculosis distribution in Gurage zone, southern Ethiopia: a geostatistical kriging approach. BMC Public Health 18(1):783. |
|
|
Tennessee Department of Health TB Elimination Program (2019). Tennessee TB cases and rates by region and county-2018. |
|
|
United States Census Bureau (2017). American Community Survey Data. |
|
|
United States Census Bureau (2018). American Community Survey Data. |
|
|
U.S. Geological Survey (USGS) (1990-2016). National Atlas of the United States: North America elevation 1-kilometer resolution, query form for the United States and its territories. |
|
|
Virginia Department of Health Tuberculosis Program (2018). Number of reported TB cases and rates per 100,000: 2014-2018. |
|
|
West Virginia Department of Health and Human Resources: Bureau of Public Health (2018). West Virginia TB profile: annual report 2017. |
|
|
World Health Organization (WHO) (2020). Tuberculosis [Key Facts]. |
|
|
Xu M, Li Y, Liu B, Chen R, Sheng L, Yan S, Hu P (2021). Temperature and humidity associated with increases in tuberculosis notifications: a time-series study in Hong Kong. Epidemiology and Infection 149. |
|
|
Zhang CY, Zhang A (2019). Climate and air pollution alter incidence of tuberculosis in Beijing, China. Annals of Epidemiology 37:71-76. |
|
Copyright © 2024 Author(s) retain the copyright of this article.
This article is published under the terms of the Creative Commons Attribution License 4.0


