ABSTRACT
To determine the effects of inclusion, at different levels of Moringa oleifera leaf meal (MOLM) in growing pig diets on pig’s daily feed intakes (DFI), growth performance, feed conversion efficiency (FCE), haematology and plasma lipid indices, a total 24 pigs aged 2.5 months old were selected and assigned to 4 treatment diets (T) containing: 0% (T1), 3% (T2), 6% (T3) and 12% (T4) MOLM concentrations, each with 2 replications of 3 pigs. The DFI and weekly pig weights were monitored for 7 weeks, after which 2 sets of blood samples were drawn from 2 pigs per replication for haematology and serum lipid determination. The DFI for the T4 (3.16 kg) was significantly higher than T1 (2.90 kg), T2 (2.61 kg) and T3 (2.54 kg). Pigs in T2 had significantly higher daily weight gains (0.836 kg) compared to T1 (0.807 kg), T3 (0.810 kg) and T4 (0.810 kg) groups. Furthermore, pigs in T2 and T3 had significantly higher FCE (31.57 and 31.23% respectively) compared to T4 (28.05%) and T1 (30.31%). Inclusion of MOLM in the diet significantly increased haemoglobin concentration only to the level of T3 (14.70 g/dL) after which there was a reduction in T4 (12.70 g/dL). Higher mean corpuscular volume was also observed for T1 (60.0 fL) compared to T3 (52.30 fL). MOLM diet also improved the white blood cell counts; 16.70×10⁹/L in T2 compared to 14.50×10⁹/L from T1. Total cholesterol in T2 (2.80 mg/mL) were significantly reduced compared to T1 (3.90 mg/mL). This implies, MOLM at lower levels (<6%) in the diet improves haemoglobin concentration, white blood cell counts and exhibits hypocholesterolemic effects, thereby improving growth performance of the animals.
Key words: Growth, haematology, Moringa oleifera, total cell count, total cholesterol, pigs
Pig production is gaining importance in societies that currently are undergoing a shift from ruminant to non-ruminant livestock production in Kenya. However, increasing feed costs, especially the protein sources, have limited the expansion and profitability of the pig enterprise (FAO, 2012). As a result, farmers have adopted a variety of feed ingredients perceived to be cheaper without taking cognizance of their influences on the animals’ body systems (Etim et al., 2014).
MO is a plant in the family Moringaceae introduced in East Africa in the 20th century from India and Pakistan (Foidl et al., 2001). Due to its rich nutritional value, the plant has been used for numerous purposes such as human food, animal feeds as an alternative growth promoter and medicinal purposes (Richter et al., 2003; Sanchez et al., 2006; Nkukwana et al., 2014; Babiker et al., 2017; Caturao et al., 2017). Nutritionally, MO leaves contain between 19.3 and 28.0% crude protein, 2.2% ether extracts, 19.2% crude fibre, 7.1% ash, 42.0% nitrogen free extractives, 0.3% phosphorus and 8.6% calcium (Foidl et al., 2001; Aregheore, 2002; Ferreira et al., 2008; Mustapha and Babura, 2009; Nuhu, 2010; Madukwe et al., 2013; Gakuya et al., 2014).
Haematological values can serve as baseline information for comparing conditions of nutrient efficiency, physiology and health status of farm animals (Ameen et al., 2007; Togun et al., 2007; Isaac et al., 2013; Etim et al., 2014). The phytochemicals from MO seeds, roots and leaves have been shown to have some effects on the haematological and plasma lipid profiles in humans and animals. For instance, El Tazi and Tibin (2014) recorded improved red blood cell indices in broiler chickens fed on MOLM diets. MOLM seed extracts also exerted blood hypocholesterolemic effects in chicken, mice and dogs (Fahey, 2005; Ghebreselassie et al., 2011; Garcia et al., 2015). However, Gakuya et al. (2014) reported that the plant leaves did not have any effects on total cholesterol and total triglycerides in chicken.
Despite the increased use of the plant as a nutritional supplement in humans and animals, there have been varied results on the effects of its inclusion at different concentrations in animal diets on growth performance, haematology and plasma lipids and thus, the need for the study. This study was therefore designed to determine the effects of inclusion of MOLM at varying levels in pig’s diet on growth performance, feed conversion efficiency, haematological parameters and plasma lipid profiles in growing pigs.
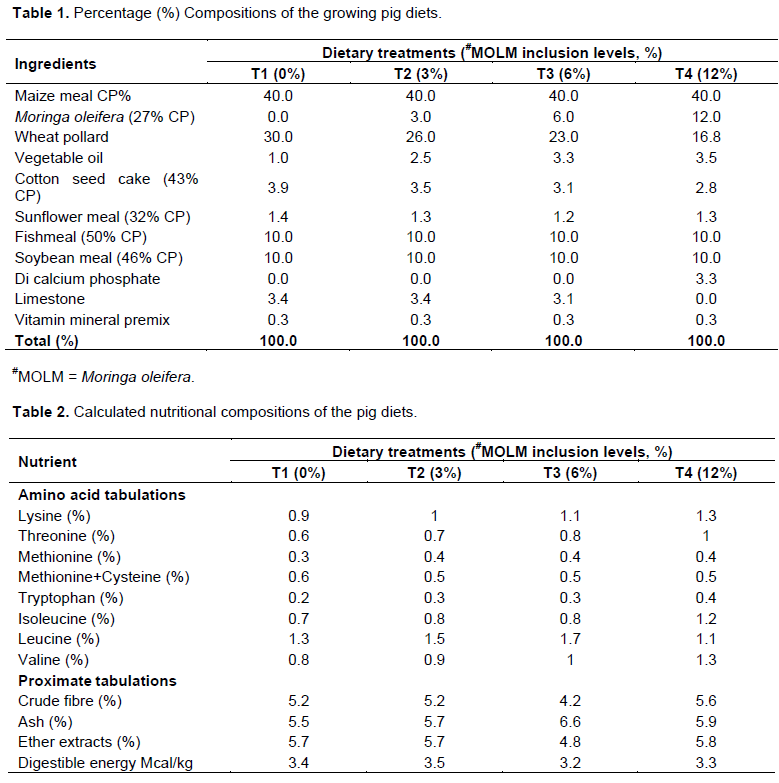
This study was conducted at the University of Nairobi, College of Agriculture and Veterinary Sciences, located in Nairobi County. The area receives an average of 869 mm annual rainfall with average daily temperature of 19°C. Growing pig diets were formulated using the NRC (2012) guidelines using maize meal, wheat pollard and vegetable oil as energy sources while MOLM, cotton seed cake, sunflower cake, fish meal and soybean meal served as protein sources. Vitamin mineral premix, Di calcium phosphate and limestone were also included as vitamin and mineral sources (Table1). The nutritional compositions of the treatment diets are shown in Table 2.
This study was conducted in accordance with the University of Nairobi Faculty of Veterinary Medicine Research Animal Use and Ethics guidelines. Twenty four (24) large white growing pigs (2.5 months old) were selected and assigned to four treatment diets (T): 0% (T1) as the control, 3% (T2), 6% (T3) and 12% (T4) MOLM, each with 2 replicates of 3 pigs in a concrete floor housing system using the design of Reese et al. (2010).
Feeds were weighed each morning and fed in 3 portions to minimize wastage. At the end of the day, feed left in the troughs were weighed and subtracted from the total weight of feed provided for the day to get the daily feed intake. Average daily feed intake for each of the treatment groups was calculated for the entire experimental period. Water was provided ad libitum.
At the start of the experiment, each pig was weighed followed by weekly weighing for a total of 7 weeks. At the end of the experiment, pigs were starved for 12 h, with provision of drinking water only. Four pigs from each treatment were randomly selected and 2 sets of blood (5 ml each) drawn from jugular vein using 9 ml vacutainers; one treated with anticoagulant (EDTA) and the other with serum clot activator. Red blood cells, total white blood cell counts, granulocyte, lymphocyte and mid-range absolute count (MID) and differential counts were determined in the laboratory using an automated haematology analyser. Serum lipid profiling was undertaken after centrifuging blood for 15 min at 3,000 rpm (Li and Kim, 2014). Serum triglycerides, total cholesterol, HDL and LDL were analysed using the serum lipid profiling Kits.
Data on pigs’ voluntary daily feed intake, weekly weights, haematological and lipid profiles were entered into Ms excel and exported to Statistical Analysis Software version 9 (SAS Inc, 2002) for descriptive statistics and analysis of variance (ANOVA). Tukey’s test was used to determine whether there were significant differences between the means of the treatment groups.
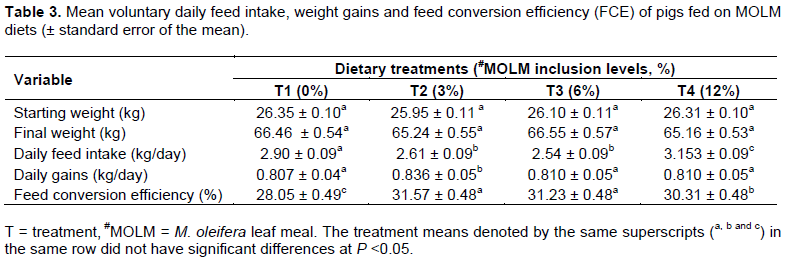
MOLM used in formulating pig diets had 27.37% crude protein (CP), 8.90% crude fibre (CF), 46.01% nitrogen free extractives (NFE), 5.73% ether extract (EE) and 11.91% ash on dry matter basis.In the feed trials, pigs from T4 registered a higher (P <0.05) daily voluntary feed intakes than those in T1, T2 and T3 groups. T1 group on the other hand had higher (P <0.05) daily feed intakes compared to T2 and T3 groups. The T2 group had a higher (P <0.05) average daily weight gains compared to T1, T3 and T4.
Furthermore, feed conversion efficiency (FCE) was higher in T2 and T3 compared to T1 and T4 (Table 3). All the blood parameters measured in this study (haematological and serum lipid profiles) were within the normal range for T1, T2, T3 and T4.
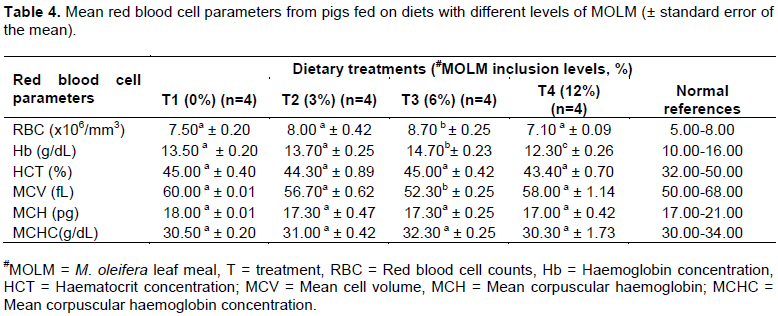
However, there were variations in haematological parameters and serum lipid profiles with variations of MOLM levels in the diet. From the study, the red blood cell (RBC) and haemoglobin concentration (Hb) was higher (P <0.05) in T3 group compared to T1, T2 and T4 (Table 4). Mean cell volume (MCV) was lower (P <0.05) in T3 compared to T1, T2 and T4; mean corpuscular haemoglobin (MCH) and mean corpuscular haemoglobin concentration (MCHC) on the other hand did not vary (P >0.05) with the diet (Table 4).
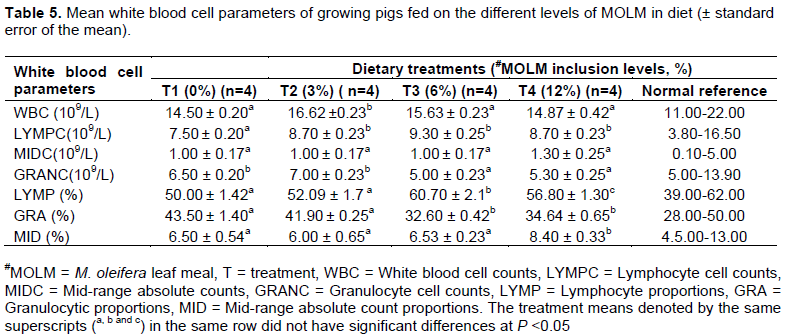
The T2 group had a higher (P = 0.05) concentration of white blood cells compared to T1, T4 and T3 treatment groups. There was also an increase in lymphocytic concentration with increase in MOLM in diet Table 5. Granulocyte cell concentration was, on the other hand, lower (P <0.05) in the MOLM treatment groups compared to the control (T1) groups. Differential cell counts showed that granulocyte proportions declined with increased MOLM in diet, but started to rise again with increased MOLM in T4 (12% MOLM). The mid-range absolute counts (MID) cell proportions further increased (P <0.05) with increase in MOLM in the diet and similarly for the lymphocytes (LMP).
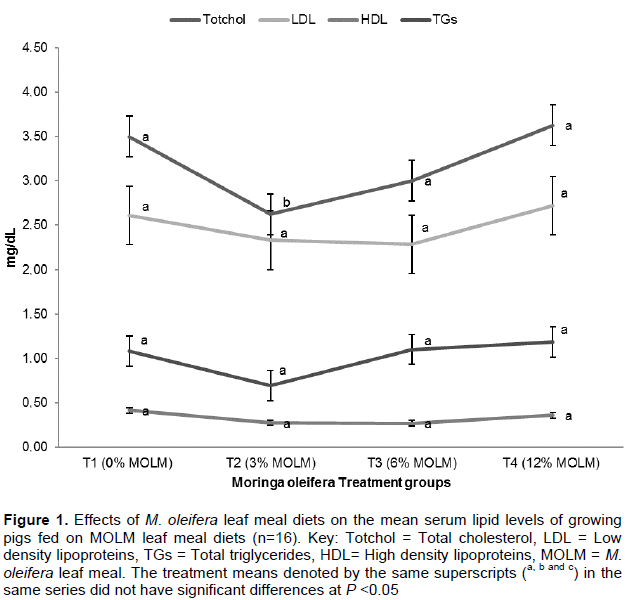
Total cholesterol reduced (P <0.05) with the increase in MOLM in the diet but increased again at the higher levels of dietary MOLM (T3 and T4). T1 group also had the highest level of LDL (2.89 mg/ml) compared to T2 (2.27 mg/ml), T3 (2.26 mg/ml) and T4 (2.5 mg/ml), though not statistically significant. TGS and HDL however did not vary significantly with the diet(Figure 1).
The treatment means denoted by the same superscripts (a, b and c) in the same row did not have significant differences at P <0.05.
The crude protein levels of MOLM in this study were close to 27.51% reported by Oduro et al. (2008), and 29.55% recorded by Nuhu (2010) in Ghana but higher than 23.30% reported by Gakuya et al. (2014), in Kenya. This could be attributed to differences in ecological zones and the physiological stage of harvesting where younger fresh materials could have had higher protein levels, NFE and lower crude fibre contents (Samkol et al., 2005; Gakuya et al., 2014).
The MOLM diets in all treatment groups were well tolerated by the pigs and no mortalities were recorded. MO has shown a high safety margins both in human and animal research (Stohs and Hartman, 2015). Tolerance of MOLM has also been reported by Gakuya et al. (2014) in chicken, Nuhu (2010) in rabbits and Adedapo et al. (2009) in rats. The higher pig feed intake recorded in T1 and T4 groups may be attributed to limited nutrient availability in the diets as well as higher fibre contents which might have increased the rate of passage in the gut (Afuang et al., 2003). The highest average daily weight gain recorded in T2 was close to that of Mukumbo et al. (2014) who recorded the highest pig weight gain at 5% MOLM, attributed to high protein content from MOLM and higher digestibility. Nkukwana et al. (2014) reported the highest weight gains among broiler chicken fed on MO based diets attributing this to enhanced nutrient utilization. However the average daily gain weight in this study was different from that of Acda et al. (2010) who reported that MOLM up to 10% could substitute commercial pig pre-starter diets and Caturao et al. (2017) Who reported enhanced growth of Oreochromis niloticus by inclusion of 10% dried MO in the diet.
Diet has been found to influence haematological parameters (Etim et al., 2014). MOLM improved the red blood cell counts and haemoglobin concentration in blood to a level of 6% after which the levels declined significantly. These results were similar to those of El Tazi and Tibin (2014) who recorded higher levels of Hb in broiler chickens fed on MOLM diets. This has been attributed to higher levels of protein and minerals, mostly iron, which are responsible for the formation of haemoglobin in the MO plant (Madukwe et al., 2013; El Tazi and Tibin, 2014). The higher the haemoglobin concentration the better the oxygen circulation in the body, hence, better performance of the animal (Olugbemi et al., 2010). At higher levels (greater than 6% MOLM) however, haemoglobin concentration declined and could possibly be due to the potential toxicities by high levels of flavanoids and tannins in the plant leaves (El Tazi and Tibin, 2014). Increased MOLM (12% MOLM) led to increased MCV implying that there might have been increased release of immature RBC or increased iron or folic acid levels that enhanced red blood cell formation (Fahey, 2005). This therefore implies that MOLM should be used in moderation since high levels may lead to toxicity and reduced efficiency in oxygen transportation in the body, hence, reduced performance. Higher levels of MCV could further imply existence of chronic liver diseases hence inefficiency of liver detoxification. This also could be as a result of increased levels of flavonoids which might have led to impairment of liver function at the highest MOLM in the diet (Fahey, 2005).
The T2 group had the highest white blood cell counts followed by T3 and T4 while T1 had the least counts. These results were similar to those of Gupta et al. (2012) which implied that higher vitamin and protein concentrations in MOLM may have led to improved immune system in animals; indicated by higher body defence cell levels. This is important since the treatment groups would be able to fight diseases compared to controls, hence, minimizing drug usage and thereby reducing the cost of production and subsequently, increasing the safety of pork (Pascoal et al., 2012). MID cells increased with increased MOLM in the diet, implying that the white blood cell precursors had increased therefore enabling the animal to readily counter any infections that may arise. These findings support those of Gaikwad et al. (2011) and Stohs and Hartman (2015) who documented that MO stimulate both cellular and humoral immune systems. This Immunomodulatory potential of M. oleifera leaves could be attributed to the presence of flavonoids, polyphenols and terpenoids which may modulate immune-mechanisms. Granulocytes in most instances are responsible for the immune defense against bacterial infections. In this case, MOLM antimicrobial properties may have led to suppression of the pathogenic microbes hence resulting decline in granulocyte levels.
Fahey (2005) and Ghebreselassie et al. (2011) reported that, MOLM exerts hopocholesterolemic effects when taken in the diet. This has also been supported by this study. Increased MOLM reduced cholesterol levels significantly, perhaps by lowering the serum concentrations of LDL by β-sitosterol; the bioactive phytoconstituents isolated from M. oleifera (Ghasi et al., 2000). However, pigs on the highest concentration of MOLM showed increased cholesterol levels therefore necessitating further studies to establish reasons for the increased cholesterol levels.
CONCLUSION AND RECOMMENDATIONS
This study therefore concludes that low levels of MOLM in the pig’s diet could enhance haemoglobin and WBC formation which, could increase efficiency in oxygen circulation in the body and boost animal’s immunity and enhance better performance. However, higher levels beyond 6% could interfere with the normal haematological parameters and subsequently affect negatively the pig’s performance. MOLM also at lower levels in diet has hypocholesterolemic effect which could reduce predisposition to cardiovascular diseases associated with higher levels of LDL and total cholesterol. Further studies however, ought to focus on the actual immune response in relation to specific infectious agents in pigs.
The authors have not declared any conflict of interests.
REFERENCES
|
Acda SP, Masilungan HGD, Moog A (2010). Partial substitution of commercial swine feeds with malunggay (Moringa oleifera) leaf meal under backyard conditions. Philipp. J. Vet. Anim. Sci. 36(2):137-146.
|
|
|
|
Adedapo AA, Mogbojuri OM, Emikpe BO (2009). Safety evaluations of the aqueous extract of the leaves of Moringa oleifera in rats. J. Med. Plants Res. 3(8):586-591.
|
|
|
|
|
Afuang W, Siddhuraju P, Becker K (2003). Comparative nutritional evaluation of raw, methanol extracted residues and methanol extracts of moringa (Moringa oleifera Lam.) leaves on growth performance and feed utilization in Nile tilapia (Oreochromis niloticus L.). Aquac. Res. 34(13): 1147-1159.
Crossref
|
|
|
|
|
Ameen SA, Adedeji OS, Akingbade AA, Olayemi TB, Oyedapo LO and Aderinola A (2007). The effect of different feeding regimes on haematological parameters and immune status of commercial broilers in derived savannah zone of Nigeria. Proceed. Annu. Confer. Niger. Soc. Anim. Prod. 32:146-148.
|
|
|
|
|
Aregheore EM (2002). Intake and digestibility of Moringa oleifera-batiki grass mixtures for growing goats. Small Rumin. Res. 46:23-28.
Crossref
|
|
|
|
|
Babiker EE, Juhaimi FA, Ghafoor K, Abdoun KA (2017). Comparative study on feeding value of Moringa leaves as a partial replacement for alfalfa hay in ewes and goats. Livest. Sci. 195:21-26.
Crossref
|
|
|
|
|
Caturao RD, Atilano MR, Urbina RB (2017). The Suitability of Moringa oleifera Leaf Meal Supplementation to Commercial Diets on the Growth and Survival of Oreochromis niloticus Fry. JPAIR Multidisciplinary Research. 27(1).
Crossref
|
|
|
|
|
El Tazi SMA, Tibin IM (2014). Performance and blood chemistry as affected by inclusion of Moringa Oleifera leaf meal in broiler chicks diet. J. Vet. Med. Anim. Prod. 5(2):58-65.
|
|
|
|
|
Etim NN, Williams ME, Akpabio U, Offiong EE (2014). Haematological parameters and factors affecting their values. Agr Sci. 2(1):37-47.
|
|
|
|
|
Fahey WJ (2005). Moringa oleifera: A review of the medical evidence for Its nutritional, therapeutic, and prophylactic properties. Tree Life J. 15(1):1-15.
|
|
|
|
|
Ferreira PM, Farias DF, Oliveira JTA, Carvalho AFU (2008). Moringa oleifera: bioactive compounds and nutritional potential. Revista de Nutrição 21(4):431-437.
Crossref
|
|
|
|
|
Foidl N, Makkar HPS, Becker K (2001). The potential of Moringa oleifera for agricultural and industrial uses. In: What development potential for moringa products? Dar Es Salaam October 20th-November 2nd 2001.
|
|
|
|
|
FAO (Food and Agricultural Organisation) (2012). Pig Sector Kenya. FAO Animal Production and Health Livestock Country Reviews, Rome. P 3.
|
|
|
|
|
Gaikwad SB, Mohan GK, Reddy KJ (2011). Moringa oleifera leaves: Immunomodulation in Winstar Albino Rats. Int. J. Pharm. Sci. 3(5):426-430.
|
|
|
|
|
Gakuya DW, Mbugua PN, Kavoi B, Kiama SG (2014). Effect of supplementation of Moringa oleifera leaf meal in broiler chicken feed. Int. J. Poult. Sci. 13(4):208-213.
Crossref
|
|
|
|
|
Garcia CA, Malabanan NB, Flores MLS, Marte BRG, Rodriguez EB (2015). Hematologic profile and biochemical values in adult dogs given cholesterol with or without nanoliposome-encapsulated malunggay (Moringa oleifera) administration. Philippine J. Vet. Anim. Sci. 41(1):41-48.
|
|
|
|
|
Ghasi S, Nwobodo E, Ofilis JO (2000). Hypocholesterolemic effects of crude extract of the leaves of Moringa oleifera Lam. in high-fat diet fed Wistar rats. J. Ethnopharmacol. 69(1):21-25.
Crossref
|
|
|
|
|
Ghebreselassie D, Mekonnen Y, Gebru G, Ergete W, Huruy K (2011). The effects of Moringa stenopetala on blood parameters and histopathology of liver and kidney in mice. Ethiop. J. Health Dev. 25(1):51-57.
Crossref
|
|
|
|
|
Gupta A, Gautam MK, Singh RK, Kumar MV, Rao CV, Goel RK, Anupurba S (2012). Immunomodulatory effect of Moringa oleifera Lam. extract on cyclophosphamide induced toxicity in mice. Indian J. Exp. Biol. 48(11): 57-60.
|
|
|
|
|
Isaac LJ, Abah G, Akpan B, Ekaette IU (2013). Haematological properties of different breeds and sexes of rabbits. Proceed. Of 18th Annu. Confer. Anim. Sci. Assoc. Niger. pp. 24-27.
|
|
|
|
|
Li J, Kim IH (2014). Effects of levan-type fructan supplementation on growth performance, digestibility, blood profile, faecal microbiota, and immune responses after lipopolysaccharide challenge in growing pigs. J. Anim. Sci. 91(11):5336-5343.
Crossref
|
|
|
|
|
Madukwe EU, Ugwuoke AL, Ezeugwu JO (2013). Effectiveness of dry Moringa oleifera leaf powder in treatment of anaemia. Int. J. Med. Med. Sci. 5(5):226-228.
|
|
|
|
|
Mukumbo FE, Maphosa V, Hugo A, Nkukwana TT, Mabusela TP, Muchenje V (2014). Effect of Moringa oleifera leaf meal on finisher pig growth performance, meat quality, shelf life and fatty acid composition of pork. South Afr. J. Anim. Sci. 44(4):388-400.
Crossref
|
|
|
|
|
Mustapha Y, Babura SR (2009). Determination of carbohydrate and β-Carotene content of some vegetables consumed in Kano Metropolis, Nigeria. Bayero J. Pure Appl. Sci. 2(1):119-121.
|
|
|
|
|
Nkukwana TT, Muchenje V, Masika PJ, Hoffman LC, Dzama K (2014). The effect of Moringa oleifera leaf meal supplementation on tibia strength, morphology and inorganic content of broiler chickens. South Afr. J. Anim. Sci. 44(3):228-239.
Crossref
|
|
|
|
|
NRC (2012). Nutrient requirements of swine. Eleventh revised edition. National Academic Press, Washington, D.C. 20418 USA.
|
|
|
|
|
Nuhu F (2010). Effect of moringa leaf meal (MOLM) on nutrient digestibility, growth, carcass and blood indices of weaner rabbits. MSc thesis Kwame Nkrumah University of Science and Technology, Ghana.
|
|
|
|
|
Oduro I, Ellis WO, Owusu D (2008). Nutritional potential of two leafy vegetables : Moringa oleifera and Ipomoea batatas leaves. Sci. Res. Essays. 3(2):57-60.
|
|
|
|
|
Olugbemi TS, Mutayoba SK, Lekule FP (2010). Effect of Moringa oleifera inclusion in cassava based diets fed to broiler chickens. Int. J. Poult. Sci. 9(4):363-367.
Crossref
|
|
|
|
|
Pascoal LAF, Maria CT, Pedro HW, Urbano SR, Pascoal JM, Ezequiel B, Amorim AB, Daniel E, Masson GI (2012). Fibre sources in diets for newly weaned piglets. Revista Brasileira de Zootecnia 41(3):636-642.
Crossref
|
|
|
|
|
Reese ED, Eskridge KM, Stroupe WW (2010). How to conduct on farm pig experiments. University of Nebraska Linciloln Extension. Revised in October, 2010.
|
|
|
|
|
Richter N, Perumal S, Klaus B (2003). Evaluation of nutritional quality of moringa (Moringa oleifera Lam.) leaves as an alternative protein source for Nile tilapia (Oreochromis niloticus L.). Aquaculture 217:599-611.
Crossref
|
|
|
|
|
Samkol P, Bun Y, Ly J (2005). Physico-chemical properties of tropical tree leaves may influence its nutritive value for monogastric animal species. Revista Computadorizada de Producción Porcina. 12(1):31-34.
|
|
|
|
|
Sanchez NR, Ledin S, Ledin I (2006). Biomass production and chemical composition of Moringa oleifera under different management regimes in Nicaragua. Agrofor. Syst. 66(3):231-242.
Crossref
|
|
|
|
|
SAS Institute Inc (2002). SAS v 9.0. Cary, NC.
|
|
|
|
|
Stohs SJ, Hartman MJ (2015). Review of the safety and efficacy of Moringa oleifera. Phytother. Res. 29(6):796-804.
Crossref
|
|
|
|
|
Togun VA, Oseni BSA, Ogundipe JA, Arewa TR, Hameed AA, Ajonijebu DC, Oyeniran A, Nwosisi I, Mustapha F (2007). Effects of chronic lead administration on the haematological parameters of rabbit - a preliminary study. Proceed. Confer. Agric. Soc. Niger. 41:341.
|
|