Full Length Research Paper

ABSTRACT
The aim of the present study was to assess the impact of irrigation adoption on farmer’s welfare measured by consumption expenditure and food consumption pattern. The paper was based on cross sectional farm household data collected in 2015 from a sample of 200 households in rural Eastern Cape of South Africa. The study used a stratified random sampling method to select farming households from three district municipalities of the province. A Propensity Score Matching method was adopted for data analysis. Estimates of the Average treatment of the treated (ATT) suggests that irrigation participation decrease food expenditures, increases consumption and income significantly at 5% level. The study concludes that irrigation participation is one of the viable solutions to increase farmer’s welfare in the study area. Therefore this study recommends a continued public and private investment in irrigation schemes in Eastern Cape.
Key words: Irrigation technology, smallholder farmers, propensity score matching, consumption, South Africa.
INTRODUCTION
In recent years, a significant progress towards generating new ideas and technologies to deal with technical and institutional constraints facing African agriculture has been made and notably the impressive growth rates of 7% and more per annum in some instances. But extreme poverty persists and Sub-Saharan Africa has been regarded as the worst undernourished (International Fund for Agricultural Development, 2014). For this reason, many African governments have put agricultural transformation top of their developmental agenda. The Comprehensive African Agricultural Development Program (CAADP) launched in 2003 has driven the commitment by 42 African governments to increase public spending on agriculture by 10% (Forum for Agricultural Research in Africa, 2013). Each country was to adopt an inclusive strategy to boost agricultural growth and speed transformation. This was to be achieved through public-private partnerships in smallholder value chain development and youth employment creation in value chains (Burney and Naylor, 2012).
Similarly, South Africa since the end of Apartheid era have made large investments of resources to build up their smallholder sectors as a response to the strong belief that agriculture will drive much of inclusive economic growth (Rukuni, 2011). These programmes include the Land reform programme comprising tenure reform, land redistribution and restitution, a Massive Food Production Programme in the Eastern Cape, and the Micro Agricultural Financial Institution of South Africa (MAFISA). Sadly, these efforts have not produced the desired results, and poverty has deepened (Water Research Commission, 2014). There was the expectation that enhanced access to productive resources such as land and technical support would translate into increased agricultural productivity for the black farmers who make up the bulk of the smallholders in the country (Water Research Commission, 2014). However, the transformation of the smallholder farming practiced in the former independent homelands of Eastern Cape remains virtually stagnant at best (Vongai and Thamaga-Chitja, 2018).
In the face of climate changes and drought, the majority of smallholder farmers depend on rainfed agriculture for food production which leads to low productivity (Patrick et al., 2015). Commentators have noted that fresh water is becoming a scarce and over-exploited natural resource (UNESCOWWAP, 2006; Ridoutt and Pfister, 2010). As a result, agriculture is under intense pressure to reduce depletion of water sources, the pollution of water systems and its contribution to soil infertility and erosion (FAO, 2010). Fanadzo et al. (2010) and Mnkeni et al. (2010) noted that the decline in available freshwater resources in South Africa is caused by ignorance, and improper measurement and monitoring of water use in smallholder irrigation schemes. Some impact assessment studies that were conducted following implementation of such irrigation schemes reported positive direct and indirect effects of irrigation adoption on the farm households. The question that can be asked is: What is it that is odd to the South African smallholder agricultural sector that all these initiatives by government targeting smallholder farmers have not achieved desired results? Thus, the aim of the present study was to assess the impact of irrigation adoption to household welfare in Eastern Cape, South Africa.
Characteristics that differentiates smallholder farmers from commercial farmers
The primary characteristics of smallholder agriculture in semi-arid developing countries are its diversity in space, its variability through time, and its multidimensionality in terms of the ways it operates and survives (Cousins, 2013). This is largely because dry land smallholders must be highly responsive to a varied, changeable and hazardous environment. Thus, their operations are very different from those of large-scale farms driven by commercial goals, equipped with credits and efficiency oriented technologies and covered by insurance systems against hazards and losses. This diversity, variability and multidimensionality mean that each particular system must be approached with careful attention to its unique mix of characteristics. Smallholder farmers in most parts of the world, especially developing nations are ‘rational allocators of available resource’ but have limited technical and economic opportunities. As a consequence, these farmers remain ‘poor but efficient’. In addition, Pauw (2005) noted that due to poverty, smallholder farmers often struggle to support themselves with inadequate income from agricultural activities. Hence, they rely on other sources of income such as wage remittances and pension as well as government transfer or non- agricultural labour income.
According to the National Department of Agriculture (2008), the major characteristics of production systems of smallholder farmers are of simple, outdated technologies, labour intensity, high seasonal fluctuations and women playing a vital role in production. Smallholder farmers differ in individual characteristics, farm size, resource distribution between food and cash crops, livestock and off- farm activities, their use of external inputs and hired labour, the proportion of food crops sold and household expenditure patterns. These differences highlighted above are even considered to be constraints that smallholder farmer’s face and are the typical characteristics of smallholder farmers in the Eastern Cape province of South Africa. Smallholder agriculture is the main source food for the rural populations as well as an income generating occupation because it is the main activity for many rural parts of developing countries. This implies that smallholder agricultural productivity is very crucial in alleviating poverty and hunger (Pote, 2008). In recognizing this potential of the role of smallholder farmers, it is necessary to have a deeper insight into their key characteristics that differentiates smallholder farmers from commercial farmers which include the following:
Outdated technologies
The smallholder farm sector of South Africa is characterized by rudimentary production technology (Limpopo Department of Agriculture, 2008). Kalibwani (2005) argues that smallholder farmers in Southern Africa mainly use traditional production techniques and production levels are often low. Given this condition, a narrow production base often characterize smallholder farming. The rudimentary technology status can be explained by the fact that the sector is also labour intensive with minimal usage of machinery (Cousins, 2005).
High seasonal fluctuation
Smallholders are further differentiated from high-input commercial farmers by their need to manage multiple risks. Almost all of their inputs and outputs are subject to large variation and uncertainty, such as labour, which is often the most critical variable. Another critical risk arises from the high variability in rainfall, which itself has two major consequences as far as sequestration is concerned.
One is variation in the timing of bio productivity, which means that planting and harvesting (and most other agricultural and non-agricultural activities) may have to be readjusted rapidly, sometimes within a season, and often between seasons. For example, fallows that appeared secure for years may have to be cleared after a particularly poor season. The other consequence is variability between fields, some of which may receive sufficient rainfall, and some of which may not. There are other risks that have similar consequences. These include: attacks by pests (against which pesticides are too expensive); illness, resulting in the unavailability of labour at some critical point in the season; and variability regarding prices of inputs such as seed, labour, food, and of outputs, mainly crops.
Labour intensity
The smallholder agriculture in South Africa is characterised by intensive use of labour which is mainly derived from family members. Smallholder farmers do the farming work themselves with the help of their family members. It is sometimes the cases that some family members such as siblings or grown up children are paid in order to help out on the farm. In this case, there is limited usage of external inputs such as machinery and fertilizers. Use of labour in smallholder farming is in some case a form of self- exploitation arising from the fact that the majority are poor hence cannot afford external farm inputs and cost of labour, hence they have to do with family labour.
Subsistence
Production in smallholder farming is mainly for subsistence purposes and to a lesser extent marketable surplus (Limpopo Department of Agriculture, 2008). Cousin (2005) also confirms this characteristic by asserting that output from smallholder farming for some rural households constitutes a greater proportion of their total livelihoods. Given this picture, production in smallholder farming is mainly to meet household subsistence/survival needs. In fact, it is because of such low production levels that there are calls by researchers and policy makers alike, for smallholder farmers to produce beyond subsistence in order to meet national food security goals.
Democratization of Agriculture in South Africa
Obi (2006), observed that government has changed the direction of agrarian policy to explicitly support black population with a view to fully integrating them into the mainstream economy since the advent of self-rule in 1994. The concern of government since then is how to empower the black farmers by providing them with the enabling environment which will allow them to participate in the agricultural economy. Among these empowerment programmes include, rural development programs, Settlement Land Acquisition Grant (SLAG), revitalization of irrigation schemes, the land Re-distribution for Agricultural Development (LRAD), Proactive Land Acquisition Strategy(PLAS), Farm Equity Schemes, the land restitution programme (LRP), Comprehensive Agricultural Support Programme (CASP), Municipal Commonage Programmes (Aliber and Hall, 2009).
In the modern day agriculture, accessing market with ease is the best form of support that can be given to smallholder farmers. The strategy of unlocking the market potentials of these farmers into the country agricultural economy is the priority of the National Department of Agriculture (DoA, 2001). Roe (2003), Magingxa (2006), Pote (2008), Obi and Pote (2011) were among many experts that have a similar view. In view of this, the government of South Africa has started on the veritable idea which will enhance market development for smallholder farmers. Along with various reforms on markets, government has come up with a range of policies that are tailored towards strengthening the deprived black farmers, not minding if they are producing for subsistence purpose or making attempt at operating on commercialize level (FANRPAN, 2012). However, the recent assessment of government efforts at reforming markets for smallholder farmers has not yielded any tangible outcome. These measures have not produced any improvement in the issue of rural smallholder farmers whose conditions have remain stagnated (Aliber and Hart, 2009). According to Obi (2011) smallholders, especially in less developed countries, have encountered several challenges in gaining access to market. Market access includes the ability to obtain necessary farm inputs and farm services and the ability to deliver farm products to buyers. From the outcome, the measures introduced to liberalize the local food markets and the strategy to integrate the economy of the country into an international system have hurt the poor smallholder farmers living in the former homelands of South Africa rather than being a source of help to them (Makhura and Mokoena, 2003; Van Schalkwyk et al., 2003). In addition, Pauw (2005) and Pote (2008) said that the remarkable success recorded both on macro economy and the commercial agricultural sector did not get to smallholder farmers because they were mainly the victims of discriminatory and harsh policies used under apartheid.
The homestead food gardeners
Going down memory lane, people formed, established and then depended on subsistence homestead food gardens in the former homelands of South Africa due to betterment planning and homeland settlement policies and lastly apartheid (McAllister, 2010). Perry (2012), described a homestead as a very old concept, where the Bantu settlers in the Eastern Cape Province designed their homesteads as a function of their location to natural resources especially water resources. These people were mostly agro pastoral farmers with little enthusiasm. The uniqueness of this arrangement was that it accommodated both livestock rearing and crop production. Communal efforts were used in performing some farming tasks such as planting, ploughing, weeding and even harvesting thereby reducing the cost of production considerable, further to all these their farming work depended greatly on nature. Till date some of the local cultural practices still stand amongst these rural smallholder farmers in the Eastern Cape and the indigenous knowledge used then on how to know seasons and time, still evolve among most villagers.
MATERIALS AND METHODS
Description of study areas
Amathole is a rich region lying between longitude 27.3616° E and latitude 32.5842° S. The land area covered is 21,595 km2. Rainfall on the high ground is around 1000 mm per annum whereas it is much lower in the valley bottom (600 mm) where it can only support limited rain fed cultivation (Figure 1). The district has an estimated population of 892,637, representing 14.7% of the Eastern Cape’s population.
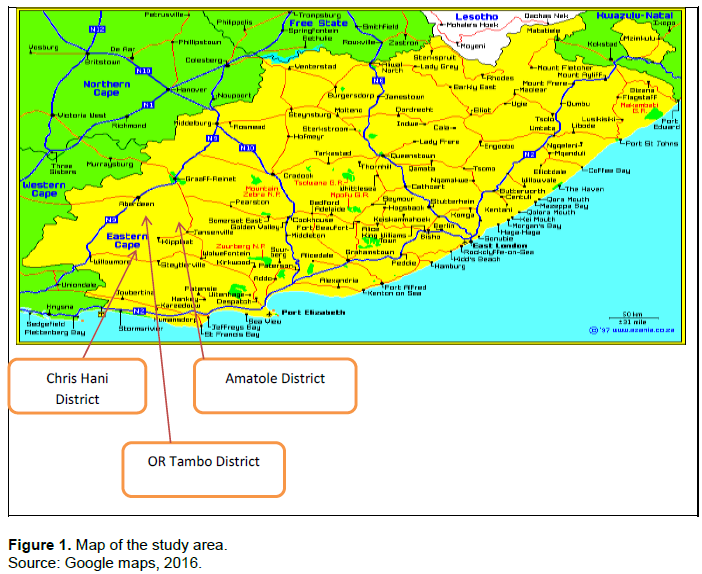
Chris Hani
Chris Hani is a rich region lying between longitude 26.7968° E and latitude 31.8743° S. The district population is predominantly Xhosa speaking and has a population of 795 461 people. The district covers area of 36,144 km², which is mostly Grassland and Subarid Thorn Bushveld vegetation types. The maximum temperature often exceeds 40°C during summer and it’s a frost region during winter. The rainfall varies between 200mm and 300mm.
OR Tambo
OR Tambo lies between 31.4632° S and 29.2321° E coordinates. The district population is predominantly Xhosa speaking and has a population of 1,364,943 people. The district covers area of 12,096 km², which is grasslands and thicket to forests and bushveld. OR Tambo is characterized by moderate, humid and subtropical coastal climate from an average maximum of 25°. The annual rainfall varies between 1100 and 1400 mm per annum.
Research design
This study used a cross sectional survey design where data were collected at a single point in time. The method is less costly, less time consuming, and reliable.
Sampling technique and sample size
For the purpose of the study, stratified sampling was used to select farmers in the study areas. The farmers were stratified into two strata: irrigation users and non-users. From each stratum, random sampling was done to obtain 100 irrigators and 100 non-irrigators. Data collection was done through structured surveys using a full administered questionnaire. Since the number of household heads in the two groups is proportional, equal number of sample were drawn from each group that is 100 household heads will be selected from each group. In total, 200 household heads were interviewed. Relevant secondary data was obtained from reports from central statistics office, ministry of agriculture, extension officers, and the meteorology station.
Impact evaluation and econometric framework
The common impact evaluation problem is the inference of causal connection between the treatment and the outcome. The two specific problems with regards to impact evaluation of an intervention to targeted individuals are (i) the selection bias problem and (ii) the problem of missing data for the counterfactual. The selection bias problem emanates from the fact that most program interventions are targeted at specific groups with specific characteristics and that the intervals targeted are not randomly selected whilst the missing data problem is caused by the fact that it is not possible to measure the impact on the same individuals as at each moment in time each individual is either under the intervention being evaluated or not and thus he or she cannot be in both. Therefore, one cannot observe the outcome variable of interest for the targeted individuals had they not participated at the same time. However, there is extensive literature describing developments in addressing such problems. For example, empirical literature categorises evaluation methods in five categories (i) The pure randomised experiments (ii) the natural experiment (iii) the matching method (iv) the selection or instrumental variable model which relies on the exclusion restriction and (v) the structural simulation model.
This study assessed the impact of irrigation adoption on consumption expenditure and pattern using non-experimental data. As consequence, we follow from the work of Ravallion (2001), Godtland et al. (2004) and Bernard et al. (2007) by applying the Average Treatment Effect on the Treated (ATT). Accordingly, the study assessed whether or not the adoption of irrigation brings change to household income, total expenditures and household consumption patterns. The present study developed stochastic model following:

Where, Yi is the dependent variable meaning household welfare (household income, total expenditure and household consumption pattern, Xi’s are the independent variables of the study (for example social grants, involvement in crop production and sales, Livestock ownership, Non-farm activities and remittances).
In this case, there is an endogeneity problem since irrigation is one of the observed characteristics. The question is to estimate the treatment effect of this observational (non-experimental) study by comparing the average treatment effect between adopters and non-adopters. And it can be expressed as follows:

Where, ATT = Estimation of Average Treatment Effect between the treated and control using predetermined variable (Xi); Y1i and Y0i = Potential outcomes of the treated and untreated.
Since there might be bias problem, the study used propensity score matching wherein it selects a control group that do not adopt to resemble them with the treated group on the basis of similarity in the observed data. Because, the ATT might not be observed for some respondents, propensity matching method sets a conditional independency assumption that all relevant differences between the two groups be captured by their observable variables (Xi). Both adopters and non-adopters are matched on the basis of propensity scores.

The propensity match can use different models to estimate the propensity score. The study uses the probit model because adopting irrigation technology is not random rather affected by observed, unobserved or both factors. The model estimates the adoption level and can be expressed as follows:

Where, Ï• denotes the normal cumulative distribution function and f(Xi) represents a specification of the respondent adopted (Di = 1) for those who adopted irrigation) determinants (Xi) of which includes all the observed covariates as linear terms without interaction of higher orders terms that have effect on the tendency to adopt and household welfare. Every sampled adopters and non-adopters have an estimated propensity score, which is a continuous variable and can be expressed as follows:

The difference between the average outcomes of the two groups is the estimated effect of the adoption if the resemblance is satisfactory (Caliendo and Kopeinig, 2008). For the matching of adopters to non-adopters on the basis of the propensity score, the study assumed two alternatives: nearest-neighbour and kernel matching which were used to calculate a weight for each matched adopters to non-adopters set.
Accordingly, the impact of the irrigation is the mean difference in the outcomes between the treated and untreated group for each stratum. In each stratum or block, the average difference between outcomes of treated observations and control observations is estimated as follows:

Where, ADsq is the average difference block q, I(q) is the set of units in a bloc q;  are the number of treated control units in the block (q).
Consequently, the estimator of ATT is computed as an average of each AD (UNDP, 2009) and is given by the following equation: where, Q is the total number of blocks.

The kernel matching method used weighted averages of all individual in the comparison group to make the counterfactual effect. The weights are calculated based on the distance between each individual from the comparison group and the treated observation of which the counterfactual is estimated (Caliendo and Kopeining, 2008). The Kernel matching ATT estimator is given by:
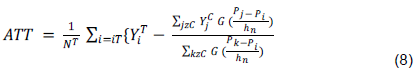
Where, G, is the Kernel function and  is a bandwidth parameter. The choice of bandwidth parameter is more important because it defines the fitness and the variance between the estimated and true underlying the density function. The researcher needs considered the variance and the bias of the estimation at the same time while choosing the bandwidth parameter. After the matching process and producing significant propensity scores, the study compared the average outcomes of the matched respondent groups (treated vs control) based on some comparable variables (such as total expenditures, consumption patterns, and household incomes) to estimate whether there is a statistically significant effect of the treated on the outcome.
Ethical consideration
An ethical clearance was sought for from the university. Furthermore, permission was asked from governmental agencies and local leaders before gathering all the farmers in the community. The respondents for this research were not subjected to any risk that could harm them physically or mentally. Lastly, respondents were notified that there are no monetary benefits and rewards from participating in the study
Trustworthiness
The results of this study were triangulated with other sources such as relevant published reports and articles, and the feedback meetings also helped to validate the findings.
RESULTS AND DISCUSSION
In this section, descriptive statistics of the variables and the estimation results of the probit regression are presented. The results will facilitate to identify the factors that influence a decision to participate on irrigation schemes.
Descriptive analysis of the household endowment by adoption status
Household endowments are normally used to measure the wealth of farming households and can reveal the living conditions. An assumption is that, a well-endowed household would better adopt technology than otherwise. A comparison of assets for adopters and non-adopters was made to check if irrigation has any effect on household assets. The results analysis is presented in Table 1.
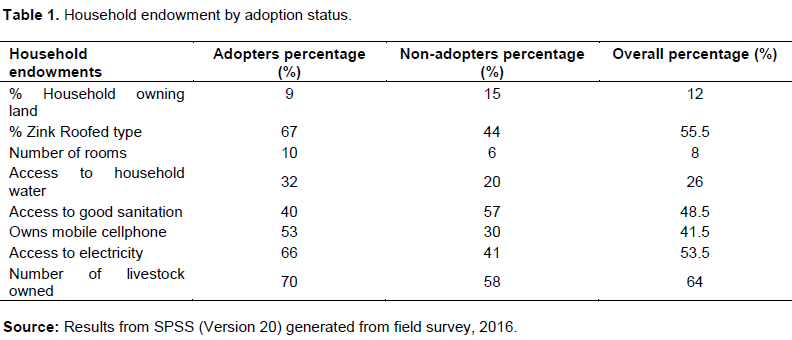
The results indicated that, in overall, the few (12%) farmers in the study area owned land. Only 9% of adopters and 15% of adopters owned the land. This suggests that, access to land in the study areas is still a problem which could limit production and adoption of irrigation for farming.
Livestock ownership is used as a supplemental household’s income especially during off season. The analysis revealed that about 70 and 58% of adopters and non-adopters owned livestock respectively. Household’s assets such as ownership of cellphone and access to electricity were regarded as important means of accessing information about new technologies and were assumed to have influenced irrigation adoption. Only 30% of non-adopters had access to cellphones compared to 53% of adopters. In terms of access to electricity, only 41% of non-adopters and 66% of adopters had access to electricity. Therefore, access to electricity could be one amongst the factors affecting adoption.
Household endowments such as type of a house, type of roofing, number of rooms, good sanitation and access to water, all combined could improve the well-being of a household and consequently encourage adoption of irrigation technology. Not many households were endowed in terms of these assets. This was observed by only 20 and 32% of non-adopter and adopters had access to water for household consumption. The adopters seemed to be better off in terms of roofing type and the number of rooms as a larger number (67%) used zink and had 10 rooms.
Descriptive analysis of the impact of irrigation adoption by farmers
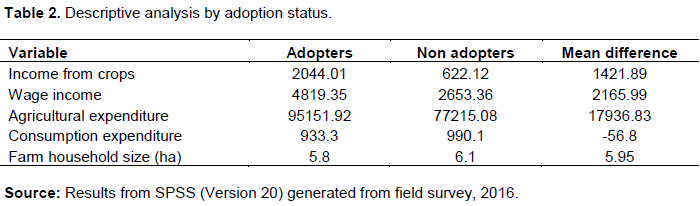
Table 2 presents the descriptive statistics of the impact of irrigation adoption on income from crop production, total agricultural expenditure, and consumption expenditure and farm size. The average area under cultivation by all the farmers was 5.95 ha, while the difference test showed that the area cultivated by non-adopters (6.1 ha) was significantly higher than that of adopters (5.8 ha). However, despite the higher area cultivated by non-adopters, they seem not better off in terms of household income from crop production. For instance, the adopters had a significantly higher income from both the production and wage income than non-adopters. Consequently, adopters were able to spend more on agriculture (95151.92) than non-adopters (R77215.08).
In terms of the impact of irrigation on welfare status of farmers, a comparison was done between adopters and non-adopters. Per capital expenditure reflects the effective consumption of households and therefore provides welfare information. The results revealed that consumption expenditure of adopters (9877.71) was higher than that of non-adopters (9588.92). This implies that adopters had a better welfare than non-adopters.
Types of crops grown in Eastern Cape
Farmers in both groups appeared to have different goals for engaging in crop and vegetable production. Table 3 shows the different crops cultivated by households in the sample in 2014/2015. Large plots of smallholder farmers in the area planted maize, beans, potatoes, butternut and vegetables with an average of 65%. Comparing the two groups, irrigators grew mostly maize (77%), potato (75%), vegetables (61), butternut (53%) and beans (48%) while non-irrigators grew mostly maize (76%), potato (72%), vegetables (70%), butternut (68%) and beans (54%). The results are presented in Table 3.
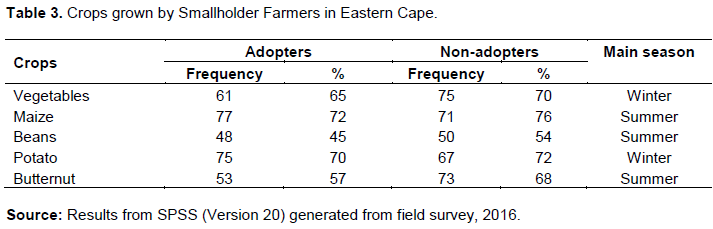
Although most of the selected crops are grown throughout the year, most of vegetables are grown during winter season especially potatoes and maize with beans in summer. Farmers in the study area do crop rotation, where they grow maize and beans from October end to December and usually harvest during winter season around May. Vegetable crops such as potatoes, spinach and cabbages are grown during May to the end of August (Cousins, 2013).
In general, irrigating households tend to produce cash crops and vegetables for the market. A portion of the produce was consumed at home while the bulk of production was sent to the market. These results confirm findings by De Cock et al. (2013) that households produce for both home consumption and the market. These findings endorse statements that agriculture plays a major role in the livelihoods of rural people. It was, however, difficult to assess the true contribution of own food production as households did not keep records. They could not recall the exact quantities that were taken for home consumption and marketing.
Econometric analysis of the Impact of adoption on household welfare
As indicated above, the PSM model was used because of its strength to minimise selection bias which may arise as a result of unobservable. In the process of running the model, the balancing property was selected in estimating propensity scores to ensure that the two group’s characteristics are distributed equally. Heckman et al. (1996a) encouraged dropping treatment observations with weak common support as inferences can be made about causality only in the area of common support. In addition, all standard errors were bootstrapped with 1000 repetitions following Smith and Todd (2005), Dillon (2011) and Sinyolo (2013).
The nearest neighbour and Kernel matching methods were used to estimate the impact of irrigation participation on farm income from crop production. Table 4 presents results from the PSM model that was estimated for comparison purposes with the treatment effect model results. The matching results indicate that irrigation has a positive significant impact on the livelihoods status of irrigators. Two matching estimators, the Nearest neighbouring and the Kernel based matching algorithms were employed as robustness checks.
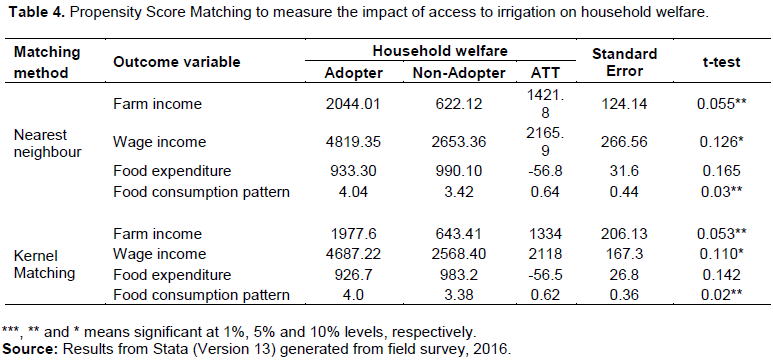
Table 4 indicates that both the nearest neighbour and Kernel matching methods point to the fact that irrigation access has a positive impact on total farm income. The nearest neighbour matching method indicated that irrigator received high farm income (R2044.01) and non-irrigating farmers (R622.12). There is no much difference in terms of the incomes generated using Kernel Matching method. These positive results indicate that participating on irrigation helps to improve farm incomes of households and is significant at 5% level. This is consistent with the findings of previous studies (Tesfaye et al., 2008; Gebregziabher et al., 2009; Bacha et al., 2011; Kuwornu and Owusu, 2012; Senyolo et al., 2009; Sithole et al., 2014).
The result for wage income are positive both in the case of NNM and KM, indicating that adopting irrigation farming leads to high wages in the household. The wage incomes are high for irrigating farmers compared to counter parts in both methods. This could be as a result of the fact that irrigation also creates jobs for their members. The ATT on total food expenditure was negative both in the case of NNM and KM algorithms, indicating that participation on irrigation can decrease the expenditure levels on food from (R933.30) to (R926.70). This could be due to the fact that irrigating farmers grew up enough for home consumption than non-irrigators. Food consumption pattern was positive and significant in both case of NNM and KM, indicating that participation on irrigation farming increases food consumption patterns per week. Food was categorised into vegetables, fruit, meat, eggs and dairy. Food consumption patterns for irrigator was high at an average of (4 times per week) compared to (3 times a week) for non-irrigators.
CONCLUSIONS
The overarching goal of African agricultural development programmes and policies is increasing productivity for accelerated economic growth. An example of these programmes is CAADP which was launched in 2003 to address agricultural and food security issues in Africa praising irrigation as one step towards achieving this goal. Recognizing this, South Africa government under CASP has undergone rehabilitation and revitalization of irrigation schemes, however progress of the impact of such programme is not known. This study has tried to assess the impact of irrigation technology on welfare among the crop farmers in Eastern Cape. Among the many findings, the results indicated that adoption of irrigation significantly impacted total household expenditure. The impact on all the outcomes of interest was also higher among the female headed households than the male headed households. In conclusion, improved agricultural technology adoption can lead to the much desired increase in productivity, ensure households food security and can also be away out of the menace of rural poverty in Eastern Cape.
RECOMMENDATIONS
Based on the above findings, the study recommends that efforts should be geared toward making adequate irrigation schemes available to the rural farmers in order to meet welfare status.
1) There is a need for increased access to credit and information that will ultimately increase diffusion and level of technology adoption.
2) The provincial department of agriculture should consider giving a special attention in strengthening the capabilities of the existing extension system by assigning additional extension agents as well as equipping them with the necessary technologically appropriate equipment such as smart pens, cars and cell phones to name the few.
CONFLICT OF INTERESTS
The authors have not declared any conflict of interests.
ACKNOWLEDGEMENTS
The authors would like to thank DAAD-NRF and Water Research Commission for funding the research, farmers, district agriculture office workers, and all those who contributed during data collection.
REFERENCES
|
Aliber M, Hall R (2009). The case for re-strategizing spending priorities to support small-scale farmers in South Africa‖, IDASA Conference, Governance and Small-scale Agriculture in South Africa' 9-11 November 2009. |
|
|
Bacha D, Namara R, Bogale A, Tesfaye A (2011). Impact of Small-Scale Irrigation on Household Poverty: Empirical Evidence from the Ambo District in Ethiopia. Journal of Irrigation and Drainage 60:1-10. |
|
|
Bernard T, Gabre-Madhin EZ, Seyoum Taffesse A (2007). Smallholders commercialization through cooperatives: A diagnostic from Ethiopia. IFPRI Discussion Paper no. 722. International Food Policy Research Institute, Washington, DC. |
|
|
Burney JA, Naylor RL (2012). Smallholder irrigation as a poverty alleviation tool in Sub-Saharan Africa. World Development 40:110-123. |
|
|
Caliendo M, Kopeinig S (2008). Some practical guidance for the implementation of propensity score matching. Journal of Economic Surveys 22(1):31-72. |
|
|
Cousins B (2013). Smallholder Irrigation Schemes, Agrarian Reform and Accumulation from Above and from Below' in South Africa. Journal of Agrarian Change 13(1):116-139. |
|
|
De Cock N, D'Haese M, Vink N, van Rooyen CJ, Staelens L, Schonfeldt HC, Haese LD (2013). Food security in rural areas of Limpopo province, South Africa. Journal of Food Security 5:269-282. |
|
|
Department of Agriculture (2008), Land and Agrarian Reform Project – The Concept Document. |
|
|
Department of Agriculture (2001). The Strategic Plan for South African Agriculture, Department of Agriculture, Government of South Africa, Pretoria. |
|
|
Dillon A (2011). The effect of irrigation on poverty reduction, asset accumulation, and informal insurance: Evidence from Northern Mali. World Development 39(12):2165-2175. |
|
|
Fanadzo M, Chiduza C, Mnkeni PNS (2010). Overview of smallholder irrigation schemes in South Africa: Relationship between farmer crop management practices and performance. African Journal of Agricultural Research 25:3514-3523. |
|
|
Food and Agriculture Organization (FAO) (2010) FAOSTAT online database. URL: |
|
|
Gebregziabher G, Namara R, Holden S (2009). Poverty reduction with irrigation investment: An empirical case study from Tigray, Ethiopia. Agricultural Water Management 96:1837-1848. |
|
|
Godtland E, Sadoulet E, de Janvry A, Murgai R, Ortiz O (2004). The Impact of Farmer Field School on Knowledge and Productivity: A Study of Potato Farmers in the Peruvian Andes. Economic Development and Cultural Change 53(1):63-92. |
|
|
Heckman J, Ichukuma H, Smith J, Todd P (1996a). Sources for selection Bias in Evaluating Social programs: An interpretation of Conventional Measures and evidence on the effectiveness of matching as a program evaluation method, proceedings of the National Academy of Sciences 93:13416-13420 |
|
|
Kuwornu J, Owusu E (2012). Irrigation access and per capita consumption in farm households: Evidence from Ghana. Journal of Development and Agricultural Economics 4(3):78-92. |
|
|
Magingxa LL (2006). Smallholder Irrigators and the Role of Markets: A New Institutional Approach, Unpublished PhD Thesis, Department of Agricultural Economics, University of the Free State. |
|
|
Makhura M, Mokoena M (2003). Market Access for Small-Scale Farmers in South Africa‖, in L. Nieuwoudt and J. Groenewald (eds.) The Challenges of Change: Agriculture, Land and the South African Economy, Natal, University of Natal Press. |
|
|
Mnkeni PNS, Chiduza C, Modi AT, Stevens JB, Monde N, Van der stoep I, Dladla RW (2010). Best manage¬ment practices for smallholder farming on two irrigation schemes in the Eastern Cape and KwaZulu-Natal through participatory adaptive research. WRC. WRC Report No. TT 478/10, Water Research Commission, Pretoria, South Africa. |
|
|
Obi A, Pote P (2011). Technical constraints to market access for crop and livestock farmers in Nkonkobe Municipality, Eastern Cape province: Book Title: Unlocking markets to smallholders: Book Subtitle: Lessons from South Africa: Pages pp 91-112: |
|
|
Obi A (2011). Institutional constraints to small farmer development in Southern Africa. Wageningen Academic Publishers: The Netherlands ISBN: 978-90-8686-132-3: e-ISBN: 978-90-8686-704-2: |
|
|
Obi A (2006). "Trends in South African agricultural land prices", PhD thesis, University of The Free State, South Africa. |
|
|
Pauw K (2005). Quantifying the Economic Divide in South African Agriculture: An Income-Side Analysis, Provide Project Working Paper 3, 2005, Elsenburg. |
|
|
Perry A (2012). Rural homestead design and permaculture, South Africa‖, Sustainable Settlements Articles P 6. |
|
|
Pote PPT (2008). Technical constraints to smallholder farming‖, Master's Dissertation, Department of Agricultural Economics and Extension, University of Fort Hare, Alice, South Africa. |
|
|
Ravallion M (2001). Growth, Inequality and Poverty: Looking Beyond Averages. World Development 29(11):1803-1815. |
|
|
Ridoutt BG, Pfister S (2013). A new water footprint calcula¬tion method integrating consumptive and degradative water use into a single stand-alone weighted indicator. The International Journal of Life Cycle Assessment 18:204-207. |
|
|
Rukuni M (1984). Cropping patterns and productivity on smallholder irrigation schemes. In: Blackie, M.J. (editor) African regional symposium on smallholder irrigation. University of Zimbabwe. |
|
|
Senyolo GM, Chaminuka P, Makhura MN, Belete A (2009), 'Patterns of access and utilization of output markets by emerging farmers in South Africa: A factor analysis approach', African Journal of Agricultural Research 4:208-214. |
|
|
Sinyolo S (2013). The impact of smallholder irrigation and water security on household welfare: The case of Tugela Ferry irrigation scheme in KwaZulu-Natal, South Africa. Published MSc Thesis, University of KwaZulu-Natal Pietermaritzburg, RSA. |
|
|
Sithole NL, Lagat JK, Masuku MB (2014). Factors Influencing Farmers Participation in Smallholder Irrigation Schemes: The Case of Ntonjeni Rural Development Area. Journal of Economics and Sustainable Development 5(22):2014. |
|
|
Smith J, Todd P (2005). Does matching overcome LaLonde's critique of nonexperimental estimators? Journal of Econometrics 125(1-2):303-353. |
|
|
Tesfaye A, Bogale A, Namara R, Bacha D (2008). The impact of small-scale irrigation on household food security: The case of Filtino and Godino irrigation schemes in Ethiopia. Irrigation Drainage Systems 22(2):145-158. |
|
|
United Nations Development Programme (UNDP) (2009). Handbook on Planning, Monitoring and Evaluating for Development Results, UNDP, New York, US. |
|
|
UNESCO-WWAP (2006). Water: A shared responsibility. The United Nations World Water Development Report 2. URL: |
|
|
Van Schalkwyk HD, Groenewald J, Jooste A (2003). Agricultural Marketing in South Africa‖, in L. Nieuwoudt and J. Groenewald (eds.) The Challenges of Change: Agriculture, Land and the South African Economy, Natal, University of Natal Press 291. |
|
|
Vongai GM, Thamaga-Chitja JM (2018). Livelihood assets and institutions for smallholder irrigation farmer market access in Limpopo, South Africa, International Journal of Water Resources Development 34(2):259-277. |
|
Copyright © 2024 Author(s) retain the copyright of this article.
This article is published under the terms of the Creative Commons Attribution License 4.0


