ABSTRACT
The interaction between genotypes and environments results in significant differences in the performance of genotypes when tested in various environments. Fifteen soybean [Glycine max (L.) Merr.] genotypes were evaluated for yield and protein content in Kenya aiming to quantifying and identifying high yielding genotypes for human food and livestock feed. The study was conducted in Eldoret (0° 35¢N, 35°18¢E), Lanet (0°18¢S, 36° 09¢E), Nakuru West (0° 33’S, 36° 0’E) and for two seasons at Njoro (0° 20¢S, 35° 56¢E). The results indicated significant (p ≤ 0.01) effects due to genotype, environment and genotype ´ environment interaction for days to flowering harvest maturity, plant height, number of pods per plant, number of nodes per plant, seed yield, oil and protein content. The mean seed yield was 1267.8 kg ha-1. Genotype Nyala produced the highest yield across environments. The mean protein content ranged from 40.3% for genotype TGX 1740-2F (DPSB 19) to 35.2% for genotype 931/5/34 across the five test environments with the highest mean protein being recorded at Njoro and the lowest at Nakuru West. Genotype Nyala and SBH 7/1/1 may be recommended for production for their relatively high grain yield across the sites.
Key words: Soybean, yield, genotype, environment, protein.
Soybean [Glycine max (L.) Merr.] is an important legume grown as source of vegetable oil and proteins as well as for feed and industrial uses (Wan et al., 2005). Soybean cultivation in Kenya is expected to gain popularity in the near future because of the increasing need for food and fodder (Mugendi et al., 2010). Livestock feed consumption accounts for over 90% of soybean utilization in Kenya and 60% of all livestock feed is compounded with soybean (Chianu et al., 2008.). Soybean improves soil fertility by fixing atmospheric nitrogen and some varieties fix 44 to 103 kg N ha-1 annually (Sanginga et al., 2003). This can reduce the need for application of nitrogenous fertilizers that are detrimental to the environment (Zhang et al., 2003). Biological nitrogen fixation is environmental friendly and ideal for sustainable agriculture (Cheng, 2008). Soybean biomass is a source of feed, green manure and mulch (Chianu et al., 2008). Soybean farming is one of most cost effective ways smallholder farmers can maintain soil fertility and reap other benefits from subsequent crops (Osunde et al., 2003). Multi-environment trials are carried out to identify superior and stable soybean genotypes and to understand the effects of genotype and environments on soybean performance. The interaction between genotypes and environments results in significant differences in the performance of genotypes when tested in various environments (Gauch and Zobel, 1997). The genotype × environment (G × E) interaction plays a major role in the performance of any genotype and in the success of any breeding program for the development of genetic material, adapted to varying environments.
Quality aspects are affected by interactions between genotypes and the environment. Three aspects that affect soybean quality are seed appearance, protein and oil content and the chemical components of protein and oil (Liu et al., 1995). Primomo et al. (2002) investigated G × E interaction for soybean fatty acids and found that genotype × year interaction was significant for all fatty acids. Due to varying regional ecological conditions in Kenya, it is extremely important to select suitable cultivars for adaptability to specific as well as across environments.
Objectives of this study were to identify genotypes with high grain yield and related agronomic traits, protein and oil content for human food and feed consumption.
Experimental sites
The study was conducted in Njoro (0° 20¢S, 35o 56¢E) for two seasons (Njoro I and Njoro II), Eldoret (0° 35¢N, 35o18¢E), Nakuru West (0° 33’S, 36° 0’E) and Lanet (0°18¢S, 36° 09¢E). Njoro (2185 m above sea level) is situated about 200 km West of Nairobi in Nakuru County and experiences an average daily minimum temperature of 9.5°C and maximum temperature of 24.2°C with an average precipitation of 1032 mm (average of 21 years 1992-2012 weather station number 9035021; Jaetzold et al., 2010). The soils are mollic andosols in eco-zone III (Jaetzold et al., 2010). Eldoret [2154 m above sea level (m.a.s.l.)] is located in Uasin Gishu County (FAO/UNESCO, 1994) and the soils are predominantly acidic (pH 4.7) rhodic ferrasols that are low in organic matter and deficient in nitrogen (N) and phosphorus (P). Lanet is 16 km South East of Nakuru town at an altitude of 1920 m.a.s.l. and experiences a bimodal rainfall pattern with an annual mean of 800 mm. The minimum and maximum temperatures that prevail in this site are 10 and 26°C, respectively (http://www.kalro.org). Nakuru West is elevated to an altitude of 2003 m.a.s.l. and is on the wind ward side overseeing Lake Nakuru.
Genotypes
Fifteen soybean genotypes obtained from Kenya Kenya Agricultural and Livestock Organization, Food Crops Research Centre (KARLO-Njoro) were used in this study. Eight of these were coded SBH (soybean hybridization) lines (SBH 10/5/6, SBH 1/12/9, SBH 7/1/1, SBH 4/4/4, SBH 10/2/3, SBH 4/6/6, SBH 6/6/6/2, SBH 3/8/4/1). Genotype EAI 3600, a stable genotype, was used as a check. Genotypes Nyala and Gazelle are medium maturing while genotype 931/5/34 gives high oil content. Genotype TGX1835-10E (DPSB 3) is resistant to Asian soybean rust disease [Phakopsora pachyrhizi (H. Sydow and Sydow)]. Genotypes TGX 1895-33F (DPSB-8) and TGX 1740-2F (DPSB-19) are promiscuous and have high biomass, trait that aids in improvement of poor soils and provision of feed to livestock.
Experimental procedure
The seedbed was prepared in order to become suitable for planting soybean. Planting was done on 13th June 2011 at Njoro in first season (Njoro I), 22nd June 2011 at Nakuru West, 8th July 2011 at Lanet, 14th June 2011 at Eldoret and on 15th July 2011 at Njoro in second season (Njoro II). The experiment was laid out in a randomised complete block design (RCBD) with three replicates. In all locations, the genotypes were planted in six row experimental units of 3 m × 2.7 m. Seeds were planted at a spacing of 45 cm × 10 cm and at an average depth of 5 cm. At planting time diammonium phosphate fertilizer (DAP) was applied to supply 22 kg of N ha-1 and 57.5 kg of P ha-1. A pre-emergent herbicide (Metribuzin) was applied at the rate of 360 g ha-1 immediately after planting in order to control weeds. Weeding was done manually when weeds appeared after the waned effect of the herbicide. Foliar fungal diseases were controlled by applying Tebuconazole at the rate of 250 g ha-1 weekly from flowering until the beginning of maturity (stage R7) (Fehr and Caviness, 1977). The crop was grown fully under rain fed conditions.
Data collection
Evaluation was done at vegetative and reproductive growth stages as described by Fehr and Caviness (1977). Days to 50% flowering was taken when there was at least one flower in 50% of all plants in the plot. Days to harvest maturity were observed when 95% of the pods had reached their mature pod colour (stage R8). At maturity, plant height, number of nodes plant-1 and number of pods plant-1 were determined from five plants of each genotype in the four middle rows. Mean seed count from twenty pods was observed as the number of seeds pod-1. Seed yield was determined by weighing as the seed weight from four centre rows. The weight of 100 seeds was recorded by weighing a random sample of 100 seeds. Seed protein content was estimated using Near Infra red Refractometer (NIR) machine (Infratec TM 1241 Grain Analyzer ISW 3.20: Foss Analytical AB, Sweden).
Data analysis
Analysis of variance to estimate the effect of genotype, environment and G × E interaction on yield and protein content was done using the statistical analysis systems (SAS) general linear mode (GLM) procedure (SAS Institute, 2000 release 8.1). Means of genotypes were separated using least significant difference (LSD) test.
Agronomic performance of the soybean genotypes across the environments
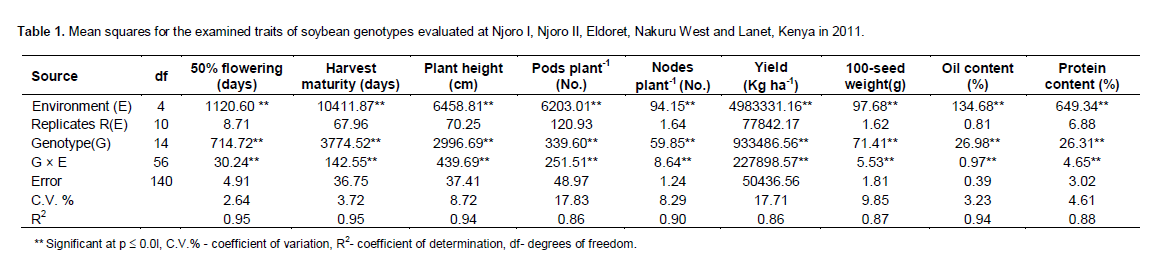
The analysis of variance indicated that there was significant (p ≤ 0.01) effects due to genotype (G), environment (E) and genotype × environment interaction (Table 1) for all the traits studied. Variation among genotypes was observed in mean values of traits (Table 2). Days to 50% flowering ranged from 74 (DPSB 19) to 101 (DPSB 3). The contribution to the sum of squares was 59% by genotypes, 26% by the environment while genotype by environment interaction (GEI) contributed 9% for the days to 50% flowering.
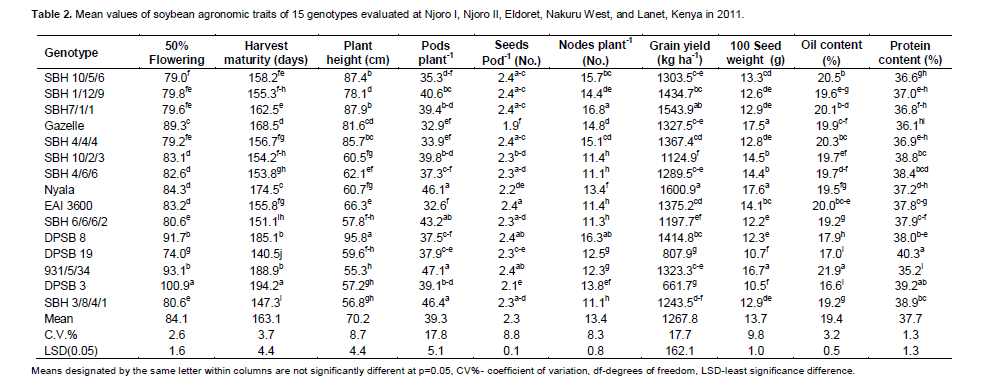
The SBH lines were medium maturing with a range of 147-163 days while the TGX genotypes had the earliest maturing genotype ranging from 141 (DPSB19) to 194 days (DPSB 3). The check variety (EAI 3600) was medium in maturity. Genotype 931/5/34 had the highest number of pods plant-1 and the shortest in height. Genotypes with pods plant-1 above the mean of 39.3 were SBH 1/12/19, SBH 7/1/1, SBH 10/2/3, Nyala, SBH 6/6/6/2, SBH 3/8/4/1 and 931/5/34. There was minimum variation on seeds pod-1 since 30% of the genotypes (Gazelle, SBH 10/2/3, Nyala, DPSB 19, DPSB 3) had significantly different number of seeds pod -1. Genotypes SBH 7/1/1 and DPSB 8 had the highest plant height and number of nodes plant-1 while genotypes SBH 3/8/4/1, SBH 4/6/6, SBH 6/6/6/2, EAI 3600 and SBH 10/2/3 had significantly lower number of nodes plant-1. Genotype Nyala had the highest mean grain yield across sites with the highest yield observed at Njoro in the second season (2397 kg ha-1) while genotype DPSB 3 yielded the least (Table 2).
There were significant differences in seed weight among the genotypes. Genotypes Nyala had the highest seed, weight; however, this was not significantly different from Gazelle and 931/5/34. Only 40% of the genotypes (Gazelle, SBH 10/2/3, SBH 4/6/6, Nyala, EAI 3600, 931/5/34) observed seed weight above the mean (Table 2). Protein content was highest on genotype DPSB 19 while genotype 931/5/34 had the least. The contribution of environment sum of squares to yield, oil content, protein content, seed weight, maturity and pods plant-1 was 37, 52, 70, 20, 38 and 48%, respectively while the genotype contributed 24, 37, 10, 51, 49, and 9%, respectively. The G × E interaction contributed 24, 5, 7, 16, 7 and 27% respectively. Based on their contribution, it is evident that protein and oil content are influenced by environment compared to other traits.
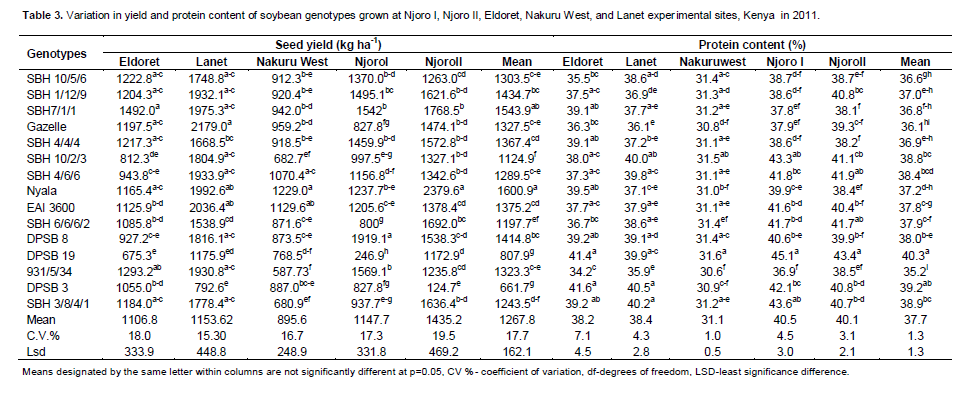
Performance of the genotypes in individual test environments
There was considerable variation in the performance of genotypes in individual test environments (Table 3). At Eldoret, genotype SBH 7/1/1 yielded highest while DPSB 19 yielded least (Table 3). Highest seed yield was observed at Lanet. Protein content was marginally higher at Njoro in the first season (Njoro I) compared to second season (Njoro II) (Table 3). The highest protein content (45%) was observed on genotype 931/5/ DPSB 19 at Njoro in the first season. Variability in the protein content among the genotypes was least in Nakuru west.
Significant genotype and G × E interactions for all the traits studied suggested that genotypes responded differently to environments and there was G × E interaction, allowing for selection of genotypes for specific eco-zones. However, contribution to the total sum of squares differed depending on the trait. In a combined analysis of variance, Pfeiffer et al., (1995) observed that soybean genotypes differed significantly for seed yield and seed composition, however the genotype by environment interaction was not significant for seed yield but was significant for seed composition. The mean plant height range observed in the current study agrees satisfactorily with that observed by Aditya et al. (2011) while testing 31 soybean genotypes. A study by Karasu et al. (2009) indicated a similar range of mean plant height among the eight soybean genotypes tested in two locations for two years. The genotypes height differences in their study and the current study could be attributed to genetic and environmental influences.
Pods plant-1, seeds pod-1, number of nodes plant-1 and seed weight are important components of seed yield. The results of the study on these traits are consistent with those of Aditya et al. (2011) and Karasu et al. (2009); however, Ojo (2003) recorded a higher range for pods plant-1. The variations could be attributed to differences in genotypes and test environments. The oil content was significantly different among the genotypes. The percentage oil content was affected more by the environment and the genotype and less by G × E interaction effects. Protein in the current study varied among the genotypes and the variation was attributed to environment, genotypes and influence of environment on genotype. Protein and oil content are influenced by both genotype and environment cues (Clemente and Cahoon, 2009). The inverse relationship between oil and protein content exists, typically a 15% reduction in total oil content leads to a 2% increase in protein content (Clemente and Cahoon, 2009).
Environments and G × E interaction play a significant role in the performance of genotypes in a particular environment. There was significant G × E interaction for all traits studied which underscores the importance of selection for specific adoption to the given regions.
CONCLUSION AND RECOMMENDATIONS
The study has revealed that there are high yielding genotypes for different environments with high oil and protein content. Genotype SBH 7/1/1 and Gazelle, may be recommended for Eldoret and Lanet, respectively. DPSB 8 a late maturing genotype maybe recommended for Njoro in the first season. Genotype DPSB 19 and DPSB 3 had high mean protein content However, they had low grain yield and maybe useful in a breeding program to improve protein content. Among the sites tested seems to favor soybean production. Production targeting high protein content needs to be done in higher altitudes such as Njoro and Eldoret while production targeting high oil content should focus on lower altitude areas such as Nakuru west. The low G×E interaction of the genotypes for oil and protein content implies that there is still need to develop genotypes with high oil and protein content. Genotype Nyala and SBH 7/1/1 maybe recommended for production across studied environments due to their relatively high grain yield. Further evaluation in low and medium altitudes with more diverse soybean genotypes, especially the promiscuous ones is recommended.
The authors have not declared any conflict of interest.
We thank the Centre Director KARI-Njoro for financial and logistical support and providing germplasm evaluated in this study. Drs. Pascal Okwiri and Peter Njau and two anonymous reviewers are acknowledged for their valuable suggestions and input contributing to the final article.
REFERENCES
Aditya JP, Bhartiya P, Bhartiya A (2011). Genetic variability, heritability and character association for yield and component characters in soybean [G. max (L.) Merrill]. J. Central. Europ. Agric. 12:27-34.
Crossref |
|
|
Cheng Q (2008). Perspectives in biological nitrogen fixation research. J. Integr. Plant Biol. 50:784-796.
Crossref |
|
|
|
Chianu Jonas N, Vanlauwe B, Mahasi JM, Katungi E, Akech C, Mairura FS, Chianu Justina N, Sanginga N (2008). Soybean situation outlook analysis: The case of Kenya. |
|
|
Clemente TE, Cahoon EB (2009). Soybean oil: Genetic approaches for modification of functionality and total content. Plant Physiol. 151:1030-1040.
Crossref |
|
|
|
FAO/UNESCO, (1994). Soil map of the world, revised legend. World Soil Resource Report Rome, Italy P. 60. |
|
|
|
Fehr WR, Caviness CE (1977). Stages of soybean development. Special report, Iowa State University Cooperative Extension Service. Ames 1A. P. 80. |
|
|
Gauch HG, Zobel RW (1997). Identifying mega-environments and targeting genotypes. Crop Sci. 37:311–326.
Crossref |
|
|
|
Jaetzold R, Schmidt H, Hornetz B, Shisanya C (2010). Farm management handbook of Kenya.VolumeII. Natural conditions and farm management information 2nd Edition part B Central Kenya sub part B1a. Southern Rift Valley Province. |
|
|
|
Karasu A, Oz M, Göksoy AT, Turan ZM (2009). Genotype by environment interactions, stability and heritability of seed yield and certain agronomical traits in soybean [Glycine max (L.) Merr.]. Afr. J. Biotectnol. 8:580-590. |
|
|
Liu K, Orthoefer F, Brown EA (1995). Association of seed size with genotypic variation in the chemical constituents of soybeans. J. Am. Oil Chem. Soc. 72:189-192.
Crossref |
|
|
|
Mugendi E, Gitonga N, Cheruiyot R, Maingi J (2010). Biological nitrogen fixation by promiscuous soybean (Glycine max L. Merill) in the central highlands of Kenya: Response to inorganic fertilizer soil amendments. World J. Agric. Sci. 6:381-387. |
|
|
|
Ojo DK (2003). Seasonal variability, correlation, genetic determination and contribution of nine agronomic traits to seed yield in selected tropical soybean (Glycine max (L.)Merr.) genotypes. Asset Series 3:127-136. |
|
|
Osunde AO, Bala A, Gwam MS, Tsado PA, Sanginga N, Okugun JA (2003). Residual benefits of promiscuous soybean to maize (Zea mays L.) grown on farmers' fields around Minna in the Southern Guinea savanna zone of Nigeria. Agric. Ecosyst. Environ. 100:209-220.
Crossref |
|
|
Pfeiffer TW, Grabau LJ, Orf JH (1995). Early maturity soybean production system: Genotype ´ environment interaction between regions of adaption. Crop Sci. 35:108-112.
Crossref |
|
|
Primomo VS, Falk DE, Ablett GR, Tanner JW, Rajcan I (2002). Genotype ´ environment interactions, stability and agronomic performance of soybean with altered fatty acid profiles. Crop Sci. 42:37-44.
Crossref |
|
|
|
SAS (2000). 1999-2000 SAS Institute inc; Cary NC, USA. |
|
|
Wan GK, Sun KH. Seong SH (2005). Occurrence of web blight in soybean caused by Rhizoctonia solani AG (1A) in Korea. Plant Pathol. J. 21:406-408.
Crossref |
|
|
Sanginga N, Dashiell KE, Diels J, Vanlauwe B, Lyasse O, Carsky RJ, Tarawali S, Asafo-Adjei B, Menkir A, Schulz S, Singh BB, Chikoye D, Keatinge D, Ortiz R (2003). Sustainable resource management coupled to resilient germplasm to provide newintensive cereal–grain–legume–livestock systems in the dry savanna. Agric. Ecosyst. Environ. 100:305-314.
Crossref |
|
|
Zhang H, Prithiviraj B, Charles TC, Driscoll BT, Smith DL (2003). Low temperature tolerant Bradyrhizobium japonicum strains allowing improved nodulation and nitrogen fixation of soybean in a short season (cool spring) area. Eur. J. Agron. 19:205-213.
Crossref |