Full Length Research Paper
ABSTRACT
The utilization of small-scale irrigation schemes plays a significant role in addressing food security problems as a supplementary with rain-fed or irrigation agriculture in the basin and as a whole in the country. The conveyance efficiency values at Shina-Hamusit was 73%, while at Selamko it was 59%. These values showed that the conveyance loss is huge in both irrigation schemes, especially at Selamko that has canals maintenance as the major identified problem, resulting in water logging in the farmlands through seepage. The application efficiency of Shina-Hamusit ranges from 47 to 57%, while it ranges from 53 to 64% for Selamko. This indicates that, application efficiency at field level in Selamko is better than Shina-Hamusit. This may be associated with the farmer’s perception, type of crops grown and excess rainfall. Water users are responsible for the overall water management including maintenance of the main diversion in irrigation schemes. In the studied areas at Shina-Hamusit scheme, there is collection of water fee and the Woreda cooperatives promotion desk auditors have not held the documents and audited the accounts while at Selamko there is no water fee now, and no maintenance of canals; the reasons for this may be weak committee and delay of payments by the farmers. The Selamko local irrigation authority maybe suggested as reforming their institutional water management and taking of water fee before irrigation, and to observe the activities of the water use association and assist them in implementing efficient water management and water saving strategies. At Shina-Hamusit scheme, market and road accesses were the major constraints that make the scheme to be inefficient whereas at Selamko major constraints concentrated on upstream and downstream irrigation scheme maintenance, potato disease, water logging, as well as market constraints.
Key words: Conveyance efficiency, application efficiency, major constraints, water distribution and management, water fee.
Abbreviation: BD, Bulk density; Ea, application efficiency; cm, Centimeter; Ec, conveyance efficiency; A, cross sectional area; 0, Degree; °C, degree centigrade; d, depth of root zone; DA, development agent; Q, discharge; E, east; FINIDA, Finnish International Development Assistance; V, flow velocity; FAO, food and agricultural organization; FC, field capacity; g/cm3, gram per centimeter cube; ha, hectare; IWMI, International Water Management Institute; Km, Kilo Meter; m.a.s.l., meter above sea level; m3, meter cubic; m2, meter square; mm, millimeter; N, north; No, number; %, percent; Sec, second; ULL, upper main canal; LMC, lower main canal; PWP, permanent wilting point; TAW, total available water; WUA, water use association.
INTRODUCTION
Water resources are under enormous pressure due to increasing demands for more and better quality water. These demands are in turn conditioned by social, political and environmental factors. The growing difficulties to ensure that water demands are met have led to greater competitiveness for scarce water resources among traditional sectors of water users, namely agriculture, industry and urban supply. One of the keys to overcoming these problems lies in the agricultural sector, given that irrigation, particularly in arid and semiarid areas, is the chief consumer of water; accounting for 70% of consumption worldwide. However, water is considered an increasingly scarce and valuable resource requiring rigorous management and extreme care (Moreno-Pérez, 2013).
The research and development community, like the farmers in the world’s semi-arid areas, often cites low and/or unreliable rainfall as the most important factor contributing to low productivity and food insecurity. Overcoming water scarcity by irrigation appears self-evident, hence the promotion of irrigation development in the developing world, and specifically in sub-Saharan Africa (Mancosu et al., 2015).
Variables such as operation and maintenance, institutional settings, and land and water resources determine the sustainability of irrigation systems. Improving the performance of irrigation systems requires setting some relevant criteria for performance and identifying indicators that can enhance the performance level. The performance of the irrigation schemes are distinguished as internal process indicators and external (comparative) indicators (Molden et al., 1998). From their perspective, internal indicators are useful to assess performance against system specific operational targets and for comparison of schemes. Determining the volume of water applied by irrigators at the field scale is a prerequisite for achieving sound irrigation management at higher scales (Lorite et al., 2013).
In Ethiopia, irrigation performance assessments are conducted rarely due to lack of field level data. Some attempts have been made to assess the scheme level performance of some irrigation schemes (Awulachew and Ayana, 2011). There is a need to develop aggregate indicators that provide a clue to the performance of irrigation development under limited data availability. Therefore, this paper evaluates the performance of the Shina-Hamusit and Selamko small-scale irrigation schemes in South Gondar zone, Ethiopia.
MATERIALS AND METHODS
Description of the study area
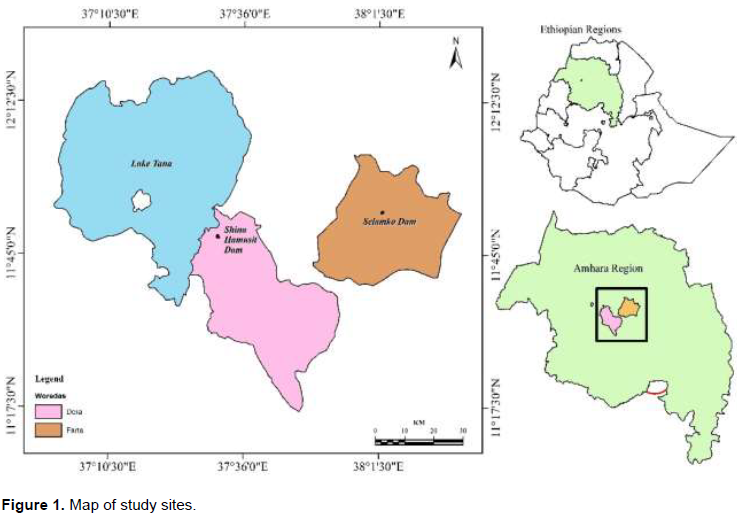
The study carried out at two modern small-scale irrigation schemes at Shina-Hamusit and Selamko micro earthen dams, South Gondar Zone, Amhara Region, Ethiopia, were serving for relatively longer period in the basin (Figure 1). The study schemes were selected based on site accessibility and availability of water in the reservoir.
Shinaâ€Hamusit irrigation scheme: This is situated in Metsele Kebele of Dera Woreda, adjacent to Fogera Woreda in the south. It can be accessed via the road leading to Gondar, about 35 km away from Bahir Dar. From Hamusit village, the Shina community is located about 9 km away in the northwest direction. It is located at 11.55°N and 37.6°E, with an altitude of 1560 m.a.s.l. The topography is woinadega agro-ecological zones. The annual rainfall ranges between 1000 mm and 1500 mm. The rainy season is from March to November. The dominant crops grown in the Woreda are teff, barely, wheat, finger millet, rice, maize, sorghum, faba bean, pea, lentil, vetch, niger seed, linseed, Ethiopian mustard and sun flower. Root crops such as potato and sweet potato, and vegetables such as shallot and garlic are also produced in the Woreda (Dera Woreda Planning and Economic Development Case Team, 2011) (Eguavoen et al., 2012).The irrigation system is significant and the command irrigated land is 105 ha.
Selamko irrigation scheme: this is located in Farta Woreda of South Gondar Zone. The scheme is located 3 km from Debre Tabor town. The geographical location is 11.53°N and 38.02°E with an elevation of 2519 m.a.s.l. The annual rainfall ranges from 1500- 2000 mm. The average annual temperature is 17°C. The major crops grown are potato, wheat, barley, teff, millet, faba bean, lentil and chickpea. It is a hundred percent woyna-dega agro-ecological zones. The command area is 63 ha (Eguavoen et al., 2012).
DATA COLLECTION
Secondary data
Secondary data were collected from Woreda’s office, using questionnaire surveys from the water users (10% water users from the total water users). The questionnaires were designed to get the perception of the farmers on the water distribution within the project. Furthermore, a participator approach discussions was held with beneficiary farmers and development agents.
Primary data
Canal water flow, water management practices, bulk density, soil moisture and soil texture were measured from respective sites, which is described below in details.
Soil sampling and analysis
Approximately 200 g of soil sample taken from the 2 irrigation schemes at an interval of 0-10 cm, 10-30 cm, and 30-60 cm for bulk density (BD); and 0-60 cm depth for determination of soil physical properties like soil texture, field capacity (FC) and permanent wilting point (PWP). Particle size distribution was determined using the Bouyoucos hydrometer method. Bulk density was determined by taking undisturbed soil sample from the site using core sampler method. FC and PWP water content were determined by pressure membrane plate apparatus, whereas total available water (TAW) was obtained by subtracting PWP from FC (Estefan et al., 2013).
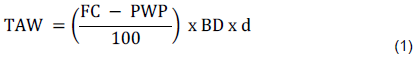
Where TAW = Total available water (cm), FC = Field capacity (percentage), PWP = Permanent wilting point (percentage), BD = Bulk density (g cm-3) and d = Depth of root zone (cm).
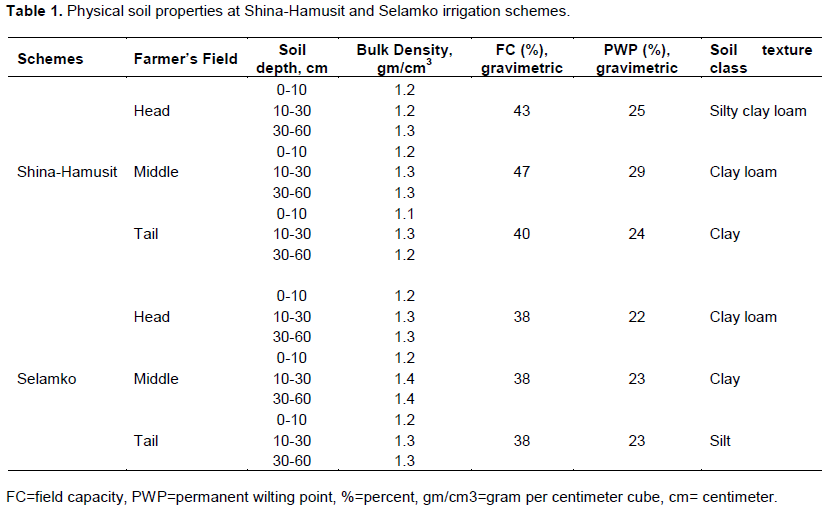
The physical properties of the studied scheme soil (texture, bulk density, field capacity, permanent wilting point and total available water) are given in Table 1. The texture of the soil ranges from silty clay loam to clay for Shina-Hamusit while for Selamko ranges from silt to clay. The average values of FC (weight basis), PWP (weight basis) and BD (g/cm3) for Shina-Hamusit was 0.43, 0.26 and 1.2 while for Selamko was 0.38, 0.23 and 1.3, respectively.
Description of the experimental setup
The water application efficiency were measured at the initial and mid-season stage of the crop growing season; the conveyance efficiency were measured twice in the main irrigation time during February-April and March-May at Shina-Hamusit and Selamko irrigation schemes, respectively. Three sample research plots that belong to different farmers chosen purposely from the head, middle and tail ends of the schemes, and all the necessary measurement and data collection conducted at the two schemes. At Shina-Hamusit, the size of each plot was 451, 242 and 335 m2. All the chosen plots planted with maize and teff. On the other hand, at Selamko, the plot area was 172, 377 and 845 m2. Potato was planted on all the chosen plots.
Conveyance efficiency
The conveyance efficiency measured twice on the main canal by measuring discharge at two different points. The discharge calculated by the floating method in which the velocity of the water flowing in the main canal was estimated by timing the passage over a predetermined distance of the canal of some material floating on the water surface. The estimated velocity was then multiplied by the cross sectional area of the particular section of the canal to obtain the discharge. The first measurement of discharge conducted in the upper position of the main canal. Dried wooden floating material was placed on the upper end of this canal section and the time it takes to reach the length of the canal section was recorded. This test replicated three times and the average time used. To obtain a per meter velocity, the total length of the section was divided by the average time obtained.
The partitioned cross sectional area of the canal was also estimated by measuring the average depth and width of this same canal section. At that point, an average discharge was calculated by multiplying the partitioned cross sectional area (A) with the average flow velocity (V). The second measurement was taken starting from the distance of the canal mark downstream from the first test site. The comparison of discharge from the first and second site provided an estimate of the conveyance loss, or the decrease in discharge from the first to second measurement, and average conveyance efficiency was calculated as (FAO, 1989):

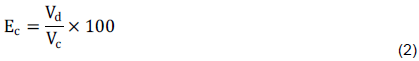
where, Ec is the conveyance efficiency (percentage), Vc is water flowing (m3/sec) into the canal section and, Vd is water flowing (m3/sec) out of the section.
Application efficiency
The application efficiency was calculated from the fields of farmers that was growing crops at each irrigation schemes, and situated in the head, middle and tail end of the water users. For moisture content determination, 144 soil samples were taken to the laboratory. For every three plot, soil samples were taken before and after 24 h irrigation from 0-10, 10-30 cm and 30-60 cm depths per test pit at initial and mid-season stages of the crop with replication for each. Samples were initially weighed with a sensitive balance immediately after sample collection on the field. The water content was measured gravimetrically by weighing the sample after oven drying at 105°C for 24 h. The dry weight fraction of each sample was calculated using the equation (FAO, 1989; Estefan et al., 2013).
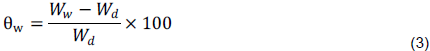
Where,  is soil water content on a dry weight basis (percentage),
 is wet weight of the soil (g)
  and is dry weight of the soil (g).
The moisture contents of the soils collected from the selected fields at different depths was determined and the amount of water retained in the soil profile within the specific root zone before and after irrigation measured. The water content on a volume basis was estimated as the product of gravimetric water content and bulk density.
To determine the amount of water applied by the irrigators to the field, cutthroat flumes were installed at the entrance of test plot. Frequent readings were taken while the farmers irrigated the test plots. Irrigation continued until the farmers suggested that enough water has been applied to the field. The average depth of irrigation water passing through the flume and the respective time were recorded for each test plot irrigated. The discharge was calculated using the following equation (FAO, 1989):

where, Qf is discharge flow, W is throat width of the cutthroat flume, hu is depth of water flow in the flume, Cf and nf flow coefficients
Then, the application efficiency (Ea) in the selected fields calculated using the equation below (FAO, 1989):
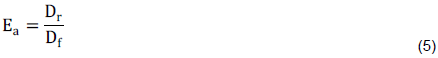
where, Dr is depth of water in the root zone (mm) and Df is depth of water applied to the field (mm).
The depth (Df) of water applied to the field was estimated by dividing the average total amount of water applied to the field by the area irrigated.
Method of data analysis
The internal process indicates that the efficiency of the schemes, particularly the conveyance and application efficiency of the scheme are analyzed descriptively but separately for both schemes. The data collected through questionnaires are analyzed descriptively using Statistical Package for Social Science (SPSS).
RESULTS
Soil physical properties
Organization of the schemes
Shina-Hamusit irrigation scheme: Originally, the project was designed and constructed by the Government of Ethiopia and FINIDA in 2000 E. C. and the structures, even if poorly maintained, still exist. The Dam comprise one main canal, 15 tertiary canals, 10 catch drains and 11 field drains. The main canal is 2,911m long and is not fully lined but is lined partially. The secondary canals are unlined earthen canals. A number of division boxes along the primary canals are used to divert the water into the secondary canals.
The scheme is gravity pump. The pumps work for ten hours per day, but do not work for 5 holidays (Sunday, Saturday, Saint Mary, Miracle Michael, and God day) every month. Almost all farmers used furrows. The spade equipment was used to open and close furrows while irrigating their crops. The main crops grown in the irrigation project area were maize, potato, sweet potato, onion, oat, teff, pepper, tomato, barely, vetch, garlic and cabbage. Rice was the dominant irrigated crop.
The farmers themselves, including their family, do all the farming practices. However, during peak times like harvesting, some farmers are forced to hire additional labor on daily wage basis. In the irrigation project, there was no rule or restriction on the farmers regarding what type of crop to produce. The farmers have the right to choose what type of crop to plant as far as the crop is profitable and the water allocation is adequate to produce the selected crop. The development agent (DA) guides the farmers when they plant and what type of crops to plant. The types of crops grown are selected based on the market condition, crop resistance to disease, water availability and ease of management.
Farmers sell their products by themselves based on the market price. Individual farmer covers the production costs like fertilizer, chemicals and labor, without the involvement of the association. The Water Use Association (WUA) is relatively well organized than Selamko. It has more than 160 beneficiaries, out of which 120 are members while the remaining 60 and other poor farmers are not members owing to lack of awareness about the association and its functions, and lower level of livelihood.
The board of directors of the association has seven members and three controlling committee with ten members. There were two temporary employees hired to attend to the structures in the scheme and one storekeeper. Women involvement in management and decision-making are relatively considered, and one of the controlling committee was a female. The association uses basic financial documents. The Woreda co-operatives promotion desk auditors or government responsible offices do not hold the documents and audit the accounts. The organization meets twice per month; one meeting held by all members of the association to raise issues for discussion and decide on time, while the second meeting held for board of directors to discuss some issues. Payment of annual water fee from all water users is the main source of income for the association. Each beneficiary is expected to pay an annual water use fee. Currently, there are 20 members in the low category, 57 members for medium and 43 members for high-level and water users pay 15, 20 and 25 Ethiopian birr, respectively based on livelihood level and their irrigated area per year. In addition to this membership fee, registration fee, and water fee from potential beneficiaries, penalties paid are also additional sources of income for the association.
Division leaders are responsible for distribution of irrigation water to their respective team leaders according to the schedule. Team leaders are mandated to ensure fair water distribution among the beneficiaries. An internal regulatory system is used by the association to ensure fair water distribution and to manage conflicts among beneficiaries. All beneficiaries must obey the internal regulation whether they are members of the association or not. According to the response of development agent, the main production constraints experienced are seepage, siltation, problem creator farmers, marketing coordination, road, and unbalanced price.
Selamko irrigation scheme: Originally, the project was designed and constructed by the Government of Ethiopia in 2001 E.C., and the structures maintained. The dam had one main canal and five secondary canals. The main canal was not fully lined. The secondary canals were unlined earthen canals except one. Five division boxes along the primary canals are used to divert the water into the secondary canals.
The irrigation project had a gravity pump. A representative farmer assigned by the association throughout the year manipulates the gate at diversion weir. The discharge of the main canal varies from time to time, while considering the head, middle and tail sites. The discharge in the canal is controlled by metal operated gate. The pumps works every day for twelve hours. All farmers use border irrigation. Spade equipment is used to open and close borders while they irrigate their crops as flood irrigation. The main crops grown in the irrigation project area are potato, maize, garlic, barley, carrot, bean, shallot, onion, pepper, lentil and cabbage. Among the mentioned crops, potato is the dominant irrigated crop produced, covering about 57% of the irrigable land during the study. These crops are grown both during rainy and dry seasons. During the rainy season, even if the rain was sufficient for the crop, irrigation water supplemented when vegetable crops are transplanted.
The farmers themselves, including their family, do all the farming practices. In the irrigation project, there was no any rule or restriction on the farmers regarding what type of crop to produce. The farmers have the right to choose what type of crop to plant and the profit, as well as the amount of water allocated to irrigate the selected crop. In addition, the DA guides the farmers’ on the type of crops produce and when they should be planted. The types of crops to be grown are selected based on the compatibility of the crops to the soil and climate, market condition, crop resistance to disease and ease of management. The individual farmer covered their cost of inputs like fertilizer, herbicides, seed and labor by themselves.
Selamko irrigation scheme had relatively poor organized WUA than Shina-Hamusit. It had 161 beneficiaries out of which 114 were members, while the remaining 47 were not members because of a lack of awareness about the association and its functions. Out of the command area, there were more than 40 potential beneficiary members in the scheme. The association has seven directors of board and three controlling committees with ten members. There were two temporary employees
hired to attend to the structures in the scheme. The salary of the operator and two temporary employees were forage from the dam of upper stream grassland; and the main canals cleared by the members themselves once a year. Women involvement in management and decision-making are considered, and one of the controlling committee is a female. The organization meets monthly where all members have a chance to raise issues for discussion and decision on time.
The committee of the association had the right to collect money from the members, but they were weak to collect. Payment of annual water fee from all water users was the main source of income for the association, but not at the present. Membership fee, registration fee, water fee from potential beneficiaries and penalties paid were additional sources of income. For year 2009 and 2010, water users paid 2.5, 5-10 and 16-24 Ethiopian birr/ha for low, medium and higher-level livelihood for water use, respectively. The association documented this collected water fee. The Woreda cooperatives promotion desk auditors have not audited the accounts. Currently, starting from 2011, there is no water fee due to weak associations and absence of government enforcement for water fee.
Division leaders are responsible for distribution of irrigation water to their respective team leaders according to the schedule. Team leaders are also mandated to ensure fair water distribution among the beneficiaries. An internal regulation system is used by the association to ensure fair water distribution and to manage conflicts among beneficiaries. All beneficiaries must obey for this regulation whether they are members of the association or not. Nevertheless, the committees were too weak to execute the regulation. According to the response of development agent, the main production constraints experienced include entrance of polluted water by Gris, soap and car wash from the city, siltation, marketing coordination, road, and unbalanced price.
Conveyance efficiency
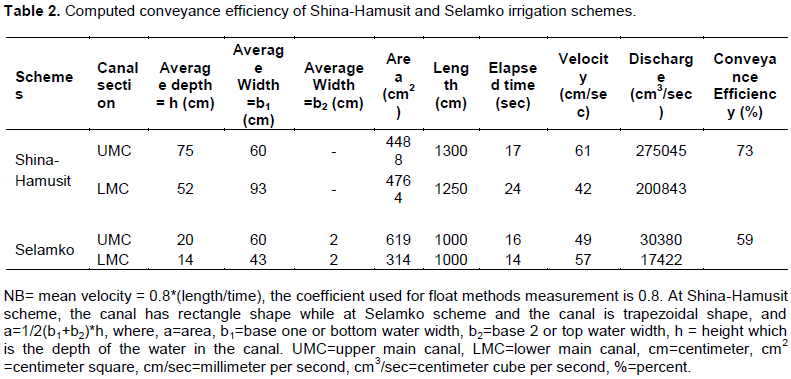
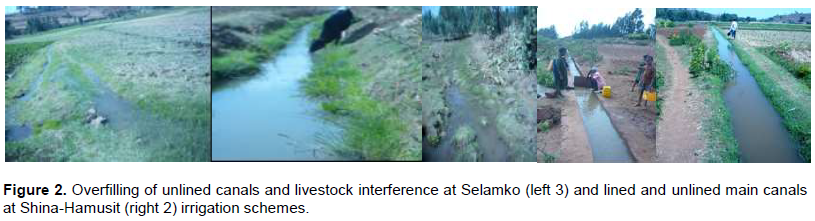
The computed conveyance efficiency values at Shina-Hamusit and Selamko irrigation schemes are 73 and 59%, respectively (Table 2). The conveyance efficiency of Shina-Hamusit was better than Selamko. This is probably associated with the frequent cleaning of the canals in Shina-Hamusit scheme. The fact also reveals
that the canal in Selamko was ponding substantial water due to infrequent cleaning of canals, unlined canal, and theft of pipe gates lock (close button) from the lined canals to withdraw water illegally (Figure 2). This may be the most probable reason for this big water loss. In brief, there were conveyance losses in both schemes.
Application efficiency
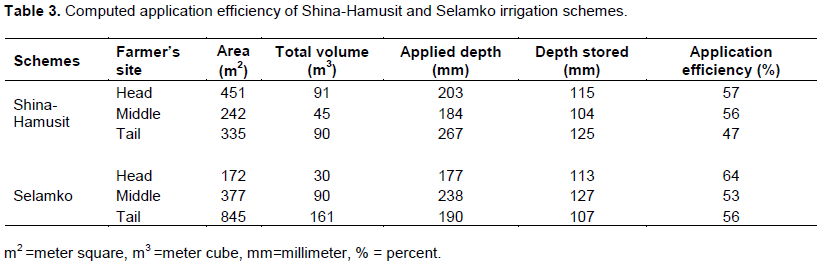
The application efficiency values at Shina-Hamusit scheme were 57, 56 and 47%; and at Selamko were 64, 53 and 56% at the head, middle and tail site of the fields, respectively as presented in Table 3. Looking into depths of water applied at Shina-Hamusit, more water was applied at tail site than head site; while regarding application of efficiencies, head site was most efficient. On the other hand, over application at Selamko scheme as compared to within the field sites observed at middle site. The lower application efficiency in Shina-Hamusit at tail site was due to the perception of the farmers that application of more water means more production and applying more water offsite contributes to longer irrigation frequency (scheduling). On the other hand, the lower application efficiency at Selamko was due to farmer’s perception that application of excess water could damage the planted potato crops at middle site due to seepage.
Major constraints decreasing the efficiency of the schemes
The major constraints identified at Shina-Hamusit irrigation scheme presented in Table 4. According to the respondents revealed that market and road access constraints were the major constraints that made the scheme inefficient; while disease, labor and water shortages, water utilization conflict, input shortage and maintenance were minor constraints.
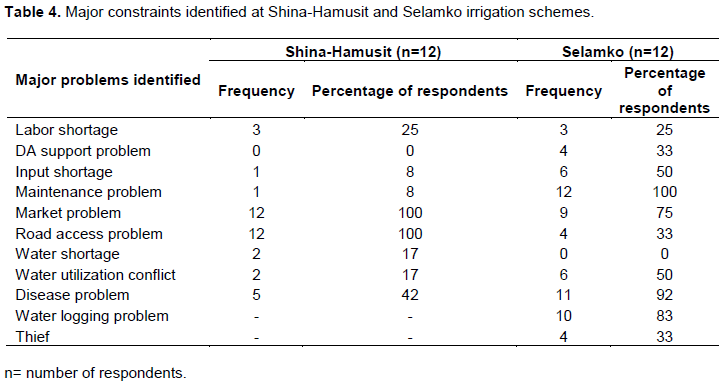
At Selamko irrigation scheme, the respondents revealed that the major constraints concentrated on upstream and downstream irrigation scheme maintenance, disease, water logging, market, input shortage, and water utilization conflict; while theft, road access and DA support, and labor shortage were minor constraints (Table 4).
RESULTS AND DISCUSSION
The comparison of the performance of irrigation systems will help the present status of these systems. Therefore, to improve the irrigation system management and the irrigation practices, frequent performance evaluation is imperative. The results of the study are discussed below. As shown in Table 2, the conveyance efficiency values at Shina-Hamusit and Selamko irrigation schemes were 73 and 59%, respectively. Different scholar found different values of conveyance efficiency in different continents. For instance, Gomo et al. (2014) found conveyance efficiency values with the range of 40-86.4%. The conveyance efficiency values found in this study were comparable to results mentioned above. Nevertheless in both schemes, the value of conveyance efficiency is far below the recommended value for concrete-lined canals of 85%. This pronounced leaks due to reduced canal capacity due to growing of weeds and silt deposition causing water to overflow canal banks, seepage and theft of pipe gates lock at Selamko; while at Shina-Hamusit, it is due to evaporation and canal seepage.
As shown in Table 3, the application efficiency values at Shina-Hamusit irrigation scheme ranges from 47 to 57% while at Selamko, it ranges from 53- 64%. Similarly, the water application efficiency in various irrigation systems in Turkey is 31 to 83% at plain, unlevelled and levelled land (Oylukan 1970) as cited by Korkmaz et al. (2009). Dissimilarly, the values range from 64.7-85.4% on site measured at different irrigation schemes in Tigray, Ethiopia (Behailu et al., 2005), and Korkmaz et al. (2009) found to be 65.6, 69, and 72.6% at head, middle and tail on site-measured values in Tukey, respectively. The application efficiency values in the study sites were within the acceptable limit except the head site at Selamko, and lower than or within the above studies. The reason for poor water application efficiency may be because small scale irrigations is associated to absence of the required trainings by farmers, the type of irrigation system employed which is predominantly border and furrow irrigation, the slopes of irrigable fields, absence of knowledge of irrigation time and scheduling by farmers. However, farmer’s water management at field level in Selamko is better than Shina-Hamusit except at the middle site. This may be associated with the farmer’s perception, type of crops grown and excess rainfall. Farmer’s perception at Selamko scheme is that application of excess water can damage the planted potato crops; while at Shina-Hamusit farmers’ perception is that application of more water means more production.
At Shina-Hamusit, scheme road access and market were the major constraints that make the scheme inefficient. Hamusit town was the only main market center, which is 9 km far from the farm of the community without infrastructure. Most of the time, farmers sold their outputs to private traders at site. The irrigation cooperative was limited due to its financial and business capacity to assemble and market farmers’ produces. The perishability and bulkiness nature of the farm products forced farmers to sell their produce with the price determined by the buyer. Farmers had no chance to arrange the price. Accordingly, the net return they got income from reduces and discourages farmers; they consequently cut down their contribution and effort to make the scheme more efficient.
Whereas at Selamko, irrigation scheme, upstream and downstream irrigation scheme maintenance, disease, water logging, and market were the major constraints. The main household crop production objective was to produce enough food that covers the annual household consumption. Even though potato and barley crops produced more, it is used for home consumption and the surplus crops from consumption accommodated by the local market. Canal maintenance was another constraint that results from water logging constraint at the farmlands due to unlined canals and absence of canal cleaning and failure to pay water fee to improve operation and maintenance of canals.
CONCLUSIONS
The comparison of irrigation schemes indicates the weaknesses and strengths, which were helpful for managerial and technical practices. Water users at Selamko were responsible for the overall water management including maintenance of the main diversion but have not paid irrigation water fee since 2011. The farmers suggest this is due to weak committee and delay of payments. Contrary to this, the collection of water fee will help the operation and maintenance and other managerial activities of the irrigation systems. Therefore, in order to ensure successful collection of fee, it is suggested that institutional reforms and taking of fee should be done before irrigation, for water management. In addition, the local irrigation authority recommended the observation of the water use association activities and assistance should be given to them to implement efficient water management and water saving strategies.
Conveyance efficiency was good at Shina-Hamusit than Selamko due to frequent cleaning of canals, therefore water users at Selamko should clean the canals like that of Shina-Hamusit users for better performance. The application efficiency of Shina-Hamusit irrigation scheme was poorer than Selamko scheme, but both schemes have low efficiency. Therefore, subsequent training should be given to farmers. At Shina-Hamusit, scheme road access and market were the major constraints that made the scheme e inefficient. The concerned body should facilitate organization setting in their Woreda’s for producers to have a fair price on commodities, and should give emphasis on the construction of road to enhance the schemes productivity. Whereas at Selamko irrigation scheme, upstream and downstream irrigation scheme maintenance, disease, water logging, and market were the major constraints. The institutional reform and committee’s mobility may resolve the maintenance and water management of the scheme, while for the disease constraints further detail research study will be needed.
CONFLICT OF INTERESTS
The authors have not declared any conflict of interests.
ACKNOWLEDGEMENTS
The author is grateful for the support rendered to him by Debre Tabor University, Ethiopia toward research and community activities. The author also wants to thank Experts at Adet Agricultural Research Institute, Bahir Dar National metrology agency and the Dera and Farta districts Agricultural offices and development agents for their contribution during the primary and secondary data collection in Amhara region, Ethiopia. He also appreciates the constructive comments and direction given by the Agricultural Water Management Editors: Thompson R, Clothier B at Elsevier Publisher.
REFERENCES
|
Awulachew SB, Ayana M (2011). Performance of irrigation: an assessment at different scales in Ethiopia. Journal of Experimental Agriculture 47:57-69. |
|
|
Behailu M, Abdulkadir M, Mezgebu A, Yasin M (2005). Community Based Irrigation Management in the Tekeze Basin: Performance Evaluation, A case study on three small-scale irrigation schemes (micro dams) reports for IWMI, Ethiopia. |
|
|
Eguavoen I, Derib SD, Deneke TT, McCartney M, Otto BA. Billa SS (2012). Digging, damming or diverting? Small-scale irrigation in the Blue Nile basin, Ethiopia. Water Alternatives 5(3):678-699. |
|
|
Estefan G, Sommer R, Ryan J (2013). Methods of Soil, Plant, and Water Analysis: A manual for the West Asia and North Africa region, third ed. ICARDA, Beirut, Lebanon. |
|
|
Food and Agriculture Organization (FAO) (1989). Guidelines for Designing and Evaluating Surface Irrigation Systems. FAO Corporate Document Repository |
|
|
Gomo T, Senzanje A, Mudhara M, Dhavu K (2014). Assessing the performance of smallholder irrigation and deriving best management practices in South Africa. Irrigation and Drainage 63:419-429. |
|
|
Korkmaz N, Avci M, Unal HB, Asik S, Gunduz M (2009). Evaluation of the water delivery performance of the Menemen Left Bank irrigation system using variables measured on-site. Journal of Irrigation and Drainage Engineering pp. 633-642. |
|
|
Lorite IJ, Santos C, García-Vila M, Carmona MA, Fereres E (2013). Assessing irrigation schemes water use and farmers' performance using wireless telemetry systems. Computers and Electronics in Agriculture 98:193-204. |
|
|
Mancosu N, Snyder R, Kyriakakis G, Spano D (2015). Water scarcity and future challenges for food production. Water 7:975-992. |
|
|
Molden DJ, Sakthivadivel R, Perry CJ, Fraiture CD (1998). Indicators for comparing the performance of irrigated agriculture systems reports for International Irrigation Management Institute, IIMI, Sri Lanka. |
|
|
Moreno-Pérez MF (2013). Assessment of irrigation water management in the Genil-Cabra (Córdoba, Spain) irrigation district using irrigation indicators. Agricultural Water Management 120:98-106. |
|
Copyright © 2024 Author(s) retain the copyright of this article.
This article is published under the terms of the Creative Commons Attribution License 4.0


