ABSTRACT
Groundnuts are among the principle economic oilseed largely cultivated in warm regions of Kenya and contribute to domestic food security and cash revenue. The study aimed at evaluating genetic diversity and phenotypic characterization of groundnut varieties grown in some parts of Kenya. Six varieties (ICG83708, ICGV99568, CG7, ICGV12991, RV and Chalimbana) obtained from KALRO (Kakamega) based on quality traits. Seeds were planted in cylindrical cans with 0.2 m3 of soil and allowed to germinate for 3 weeks. Leaf trait measurement was done using 15 cm ruler and the data was recorded in excel spreadsheet and exported to MINITAB v17 software. Extracted DNA was amplified using 11 SSR primers with manual scoring of bands. A dendrogram of cluster analysis was constructed based on simple matching coefficient of 11 microsatellite markers. Principle components showed Eigen values with 67.2% variability of all the traits studied. A total of 35 alleles were detected across the loci of 11 primers used. Major allele frequency ranged from 0.9333 in IPAHM 165 to the least frequency of 0.6333 in IPAHM 176 with an average of 0.7610 across all the markers. The expected heterozygosity had a mean of 0.3178 with highest value of 0.4511 in IPAHM 176. Phylogenetic tree had three major clusters and with high bootstrap values in genotype icgv99568 replicates. Primer IPAHM176 was the most informative marker and should be utilized in selection of parent plants with good quality traits. Breeding programs on groundnuts should utilize grain and seed traits since they are informative and discriminatory.
Key words: Groundnut varieties, phenotypic and genetic characterization, gene diversity.
Groundnut (Arachis hypongaea L.) is an essential plant both nutritionally and economically for oil and protein source (Ingale and Shrivastava, 2011). The study aimed at phenotypic and genetic characterisation of selected six groundnut varieties grown in Kenya using physical trait measurement and SSR markers. Phenotypic characterization is based on visually accessible traits such as length, width, ratio of length to width of the leaves and seeds. A detailed account on genotypes ought to help in resolving documentation challenges that arise while keeping records on varieties (Suprapto et al., 2013). Genetic markers linked with morphological
characteristics to determine plant type are beneficial to choose a variety for groundnut breeder or farmer. These DNA fragments include isozyme, RFLP, AFLP, RAPD, SSR, ISSR and SNPs which gets a lot of utility in plant inheritance series. These markers have different benefits and flaws in their use (Guo et al., 2014). The SSR markers are chosen due to use simplicity, scoring ease, higher allele range and their definite distribution genome-wise (Wang et al., 2015). It is important to gain insights into the genetic base of the A. hypongaea L. genetic resources currently being used by the farmers in Kenya. There is scanty information on Kenyan groundnuts phenotypic characterization and hence the need to analyze the varieties for prerequisite information in molecular breeding and variety advancement.
Collection of samples and preparation
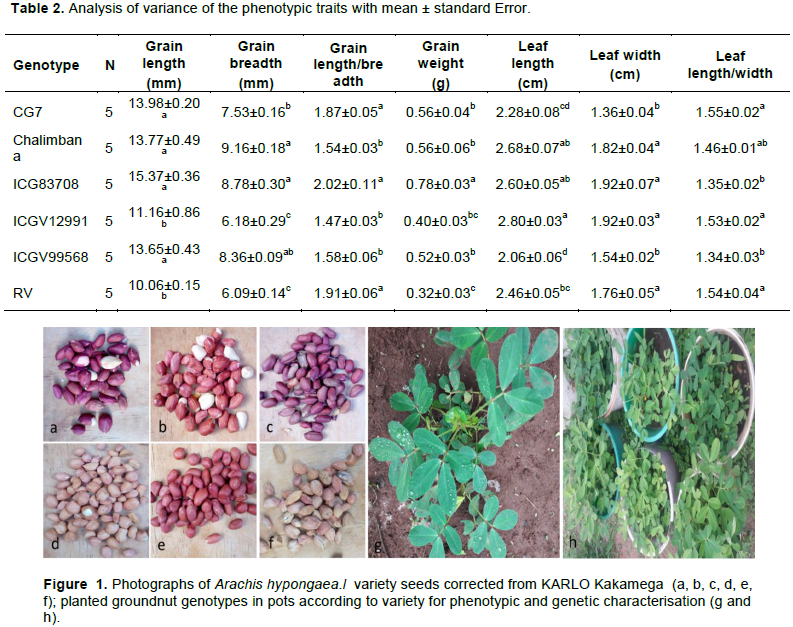
Six Kenyan groundnuts varieties were collected from the Rift valley, Coast and Western Regions agro-ecological zones of Kenya. The varieties include RV, CG7, Chalimbana, ICGV83708, ICGV12991, and ICGV99568. The varieties were selected based on high farmer preference to seed oil quality, nutritional quality, pest resistance and disease resistance, environmental stress and yield. The groundnut samples were designated into populations based on the variety, with each population comprising of 15 seeds. The seeds were then taken to Kenyatta University Plant Transformation Laboratory photographed and prepared for measurements of weight in grams, seed length, seed breadth, seed length/breadth in millimeters. Five seeds of each variety were planted in pots containing soil and were watered daily for two weeks. Mature leaves were harvested in five replicates per variety, frozen then stored at -20°C in preparation for DNA extraction.
Phenotypic characterization
Morpho-agronomic traits developed by Biodiversity International were targeted on all the varieties. Five seeds from each variety were selected at random and the measurements in centimeters (cm). The mass of each groundnut seed for each variety was determined. Traits targeted were grain length (GL), grain breadth (GB), grain length/breadth (G-L/B) and grain weight (GW), leaf length (LL), and leaf breadth (LB), leaf length/breadth (L-L/B). The data was recorded in excel and exported to Minitab software v17 for further analysis.
Genetic characterization
DNA extraction and PCR assay
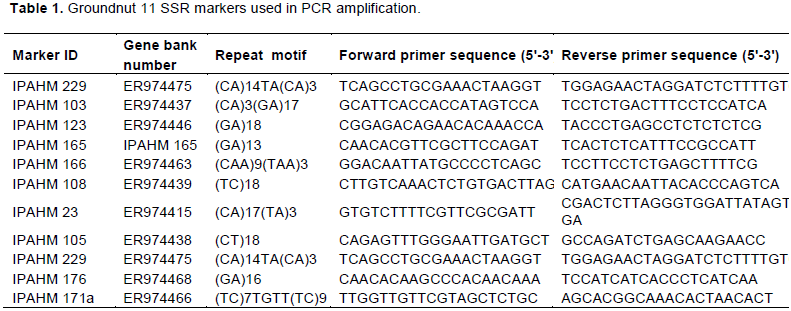
Plant genomic DNA was extracted using Doyle and Doyle (1990) protocol from each sample. Fifteen SSR markers set (Table 1) were obtained and selected from published data for groundnut simple sequence repeats primers (Moretzsohn et al., 2004). PCR was conducted as per the Taq polymerase conditions. The PCR products from the different markers were resolved in 2% agarose gel. Scoring of bands was done manually with presence of a band being recounted as one (1) while absence was reported as zero (0).
Data management and statistical analysis
The data obtained was both qualitative and quantitative and was subjected to descriptive statistics and presented in tables and figures. Phenotypic data was exported from excel worksheet to Minitab statistical software v17 (Pennsylvania, U.S.A). Mean were computed. One-way analysis of variance (ANOVA) followed by Tukey’s Post Hoc test with confidence level at 95% (p ˃ 0.05) was computed. Euclidian distance tool was used before forming complete linkage distance among the different varieties. The source of variation was determined using principal coordinates analysis (PCA) based on the seven morphological traits. PowerMarker Version 3.3 (Tamura et al., 2007) software was used to analyze polymorphisms of the markers. Phylogenetic tree, dissimilarity matrix with 1000 bootstraps was done using Darwin version 7. Principle coordinate analysis and AMOVA was calculated using GenALEx 6.5 software (Peakall and Smouse, 2012).
Phenotypic characterization
Measurements of grain and leaf characteristics
Measurements of leaf and seed characteristics for the 6 varieties and their mean values are shown in Table 2. From the results, genotype ICG83708 had the longest grain at 15.37 mm while RV had the shortest at 10.06 mm. There was significant difference between genotype ICG83708, Chalimbana, CG7 and ICGV99568. No statistical difference was observed between genotype RV and ICGV12991 (p ˃ 0.05). Significant statistical difference was observed between RV and ICGV12991 against the grain lengths of genotypes ICG83708, Chalimbana, CG7 and ICGV99568 (P ˃ 0.05). In terms of grain breadth, the highest breadth was observed in Chalimbana at 9.16 mm while the lowest 6.09 mm was observed in RV genotype. Significant difference was observed between Chalimbana and ICG83708 against ICGV12991, CG7, and RV varieties.
The grain length/breadth ratio ranged from 1.47 in ICGV12991 to 2.02 mm in genotype ICG83708. No significant difference was observed amongst genotypes CG7, ICG83708 and RV. In addition, Chalimbana, ICGV12991 and ICGV99568 also showed no statistically significant difference amongst their ratio (Table 2). Significant statistical difference was observed between Chalimbana, ICGV12991 and ICGV99568 against CG7, ICG83708 and RV (Table 2). Grain weight ranged from 0.78 g in ICGV83708 and the lowest was in RV genotype at 0.32 g. Significant difference was observed between ICGV83708 against RV, ICGV12991, Chalimbana, CG7 and ICGV99568 genotypes (Table 2). No significant statistical difference was observed between genotypes CG7, Chalimbana, ICGV12991and ICGV99568. Moreover, ICGV12991 and RV showed no significant difference amongst its mean grain weights (Table 2). Leaf length ranged from 2.06 cm in ICGV99568 to 2.80 cm in ICGV12991. This value was significantly different with
values of genotypes CG7, ICGV99568 and RV. Also, significant difference was observed between CG7 and Chalimbana, ICG83708, and ICGV12991 (Table 2).
Leaf width results showed that CG7 had the lowest value of 1.36 cm while the highest value of 1.92 cm observed in two genotypes ICGV12991 and ICG83708. Significant difference was observed between CG7 and ICGV99568 against Chalimbana, RV, ICGV83708 and ICGV12991 (Table 2). No significant difference was observed between Chalimbana, RV, ICGV83708 and ICGV12991 and also between CG7 and ICGV99568 (Table 2 and Figure 1). In terms of the leaf length/width ratio, the highest value was observed in CG7 (1.55) while the least was observed in ICGV99568 (1.34). Insignificant difference at p ˃ 0.05 was observed between CG7, Chalimbana, and ICGV12991 and RV genotypes. Genotypes ICGV99568, ICG83708 and Chalimbana showed no significant difference (Table 2).
Euclidian distance based dendrogram on 7 phenotypic traits
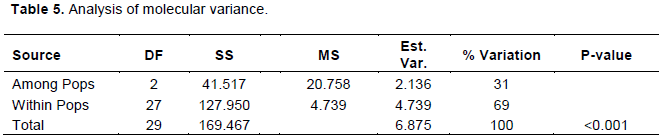
The mean values of the 7-phenotypic traits of the seed and leaves phenotypic characteristics were used to generate a dendrogram and it indicated major clusters I and II (Figure 2). Cluster I had two sub clusters; IA and IB. Cluster II had two sub clusters; IIA and IIB. Subcluster IA had two subclusters; IA1 and IA2. Sub-cluster IB had two sub-clusters; IB1 and IB2. Sub-cluster IA1 had two minor subclusters IIIA and IIIB. Sub-cluster IIIA contained first replicates of genotype Chalimbana and ICG83708. Minor subcluster IIIB had four Chalimbana genotypes from the coastal region and ICGV12991-1 a genotype from Western region. Sub-cluster IA2 consisted of ICG83708 genotypes. Subclusters IB1 and IB2 consisted of genotypes mainly from Rift Valley with CG7 in cluster IB1 and ICGV99568 in cluster IB2. The Western region of Kenyan genotypes clustered in subcluster IIA as RV genotypes and ICGV12991 genotypes in subluster IIB. Based on the observed classification, it is clear that the major cluster I was the most diverse relative to the major cluster II (Figure 2).
Principal component analysis
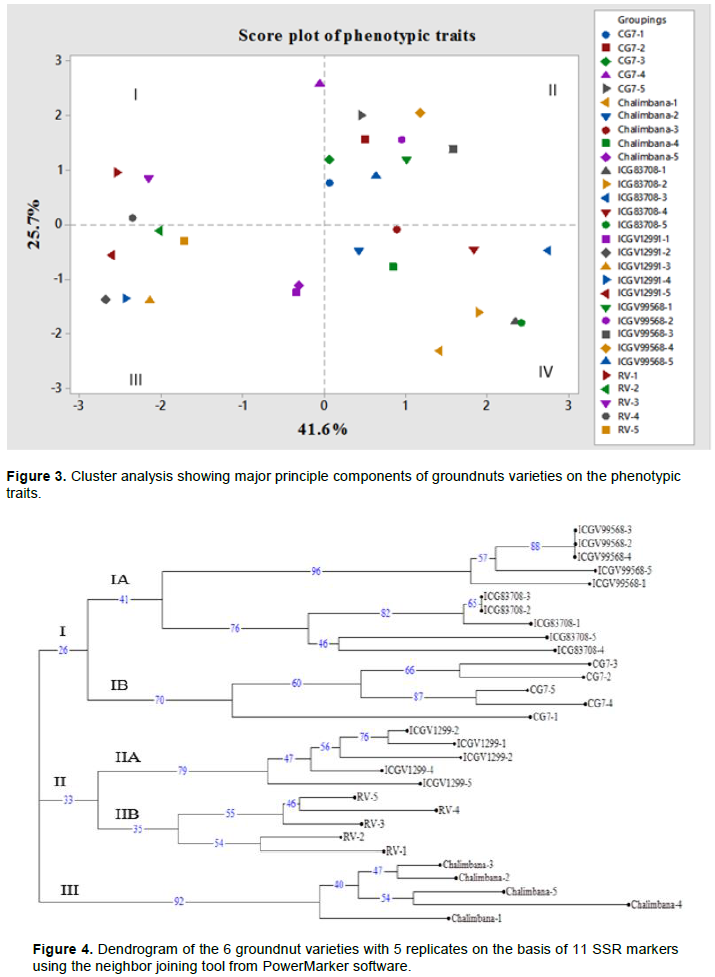
Figure 3 shows the PCA was generated from 7 phenotypic characteristics. In terms of principal components generated, the first two components showed more Eigen values exhibiting 67.2% variability of all the traits studied. The PC1 had 41.6%, PC2 showed 25.7% and PC3 had 15.1% of the total variability observed. Eigen values were observed, where it decreased from PC1 to PC3. Based on Table 3, PC1 had 2.90, PC2 (1.79) and PC3 exhibited an Eigen value of 1.06. Principal component 1 had high and positive correlation with seed length, seed breadth and weight and negative correlation with leaf width, leaf length and leaf length/width ratio. The second principal coordinate, exhibited high and negative correlation with leaf width, leaf length, grain weight, and grain breadth. Positive correlation was observed in leaf length/width ratio. The third principal coordinate showed high and positive correlation with grain length/breadth ratio and grain weight. Negative correlation was observed in grain breadth (Table 3). The six genotypes with five replicates clustered into four quadrants (Figure 4). Principal component 1 reported 41.6% while the principal component two reported 25.7% of the total variation observed. The first quadrant comprised of three RV genotypes and one CG7 genotype (Figure 5). The second quadrant comprised of two genotypes; CG7 replicates clustered closely, a similar observation exhibited by the groundnut genotypes from Rift Valley, ICGV99568. The third quadrant consisted of replicates of RV and ICGV12991 clustering together. Moreover, Chalimbana-5 and ICGV12991-1 ordinated on the same point in the quadrant (Figure 5). The fourth quadrant had the most scattered distribution of genotypes (Figure 5). Genotypes ICG83708-1 and ICG83708-5 ordinated on the same point as shown in (Figure 5). Moreover, genotype ICG83708 and Chalimbana were grouped in this quadrant (Figure 5).
Gene diversity
SSR markers polymorphism patterns
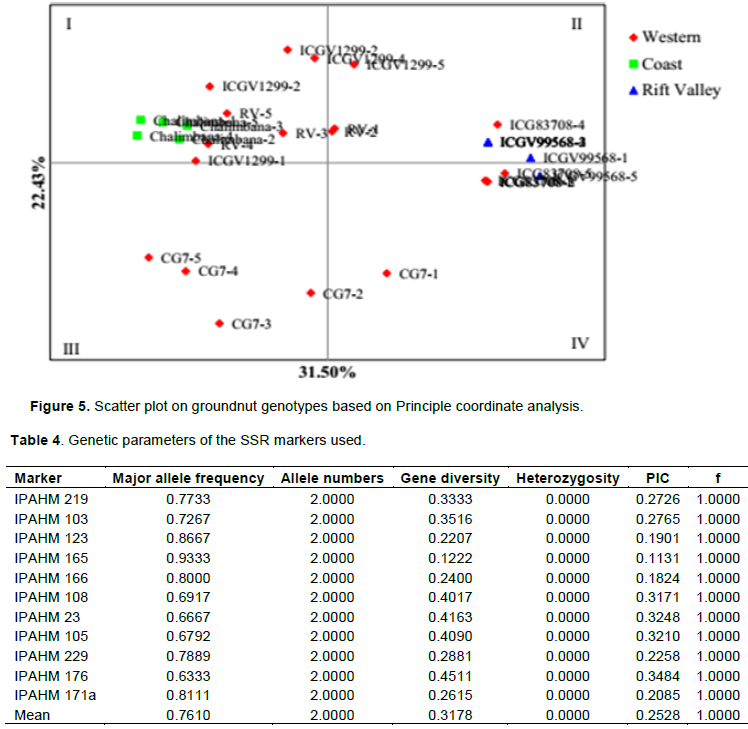
Among the 15 primers used in the study, 11 markers were polymorphic and formed unambiguous and distinct bands and hence were included in calculation of genetic parameters. All the monomorphic primers were excluded since they were not informative (Supplementary material Figure 1). 35 alleles were detected across the loci of the 11 markers used. The major allele frequency ranged from 0.9333 in primer IPAHM 165 to the least frequency of 0.6333 in primer IPAHM 176 with an average of 0.7610 across all the polymorphic markers. The expected heterozygosity had a mean of 0.3178 where the highest was observed value of 0.4511 in IPAHM 176 while the least diversity of 0.1222 was observed in IPAHM 165. Heterozygosity also referred to as the observed Heterozygosity showed a common value of 0.0000 across the polymorphic markers used. Polymorphism information content (PIC) showed the levels of polymorphism in groundnut varieties for a marker locus which is used in linkage studies. Based on this study the highest PIC was obtained in IPAHM 176 with a PIC value of 0.3484 while the least was in IPAHM 165 with a PIC of 0.1131 with a mean PIC value of 0.2528 across the markers used (Table 4) Occurrence of rare alleles was observed in Marker IPAHM 219 at 400bp in genotype ICG83708 where an allele present in Ë‚5% of the study population was considered exceptional (Table 4).
Phylogenetic tree
Unweighted neighbour joining tree generated in this study showed the genetic relatedness of the genotypes (Figure 4). The phylogenetic tree had three major clusters, I, II and III. Subsequently, there was also other sub clusters IA, IB, IIA, and IIB (Figure 4). Bootstrap values ranged from the highest at 96% in IAI to the lowest in major cluster II. Cluster I consisted two sub clusters IA and IB where in IA there was genotype ICGV99568 which had the highest bootstrap value of 96%. Replicate ICGV99568-3, ICGV99568-2 and ICGV99568-4 clustered at the same node with 88% confidence limits. Similarly, ICG83708-3 and ICG83708-2 clustered in the same node with 65% confidence limits. Sub cluster IB only consisted of CG7 replicates with high confidence limits of 70%. Cluster II consisted of two varieties all from Western region, sub cluster IIA had the highest bootstrap value compared to IIB which consisted of all the RV genotypes. Cluster III had the second highest bootstrap value of 92% and consisted of all the replicates of Chalimbana coastal groundnut genotype.
Principal coordinate analysis
The principal coordinate analysis (PCA) was done to show the relationship among the studied groundnut genotypes. This complements the phylogenetic tree in elaborating genetic relationships amongst genotypes. The 2-Dimentional plot obtained had coordinate one accounting for 31.5% of the total variation while the coordinate two had 22.43% of the total variation observed. Quadrant I comprised of three varieties; Chalimbana; RV and ICGV12991. Quadrant II comprised of three genotypes, ICGV99568 from Rift valley and three genotypes RV, ICGV12991 and ICG83708 all from Kenya’s western region. Quadrant III has sparse distribution of CG7 replicates. Four replicates of ICG83708 ordinated in two positions in quadrant IV as in Figure 4.
Analysis of molecular variance
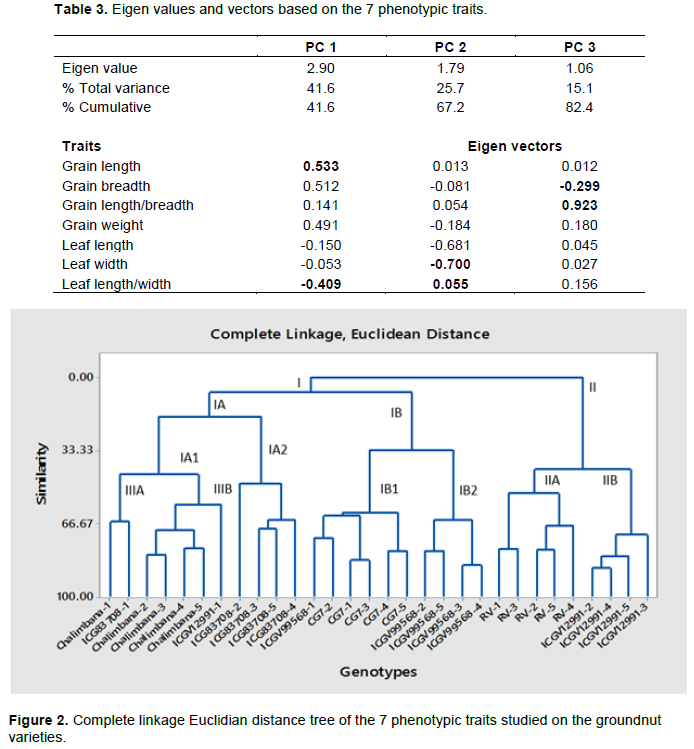
This illustrates the distribution of variation amongst and within populations. Based on Table 5, out of the total variation, 69% variation was distributed within populations while 31% was attributed to among population variation (p<0.001; Table 5).
The findings from this study show that there is both phenotypic and genetic variations that exist within and among the varieties. These differences substantiate observations by local farmers on leaf length, leaf width, leaf breadth, seed length, seed width, seed breadth and seed weight. Leaf lengths variations between genotypes under study were observed. The relatively low leaf lengths observed in genotype ICGV99568 could be attributed to known adaptation that the genotype have undergone to suit saline and drier environmental conditions observed in the Rift Valley region that this genotype is best adapted to xerophytic conditions to reduce water loss by evaporation. Matheri et al. (2016) have observed similar findings in Kenyan Passiflora edulis genotypes. High leaf lengths could be due to genotypes being hybrids and having adapted to the Kenyan agronomic and environmental influence (Wu and Campell, 2007). The means leaf lengths are lower than the leaf length value of 5.42 cm attained by Upadhyaya et al. (2009) in cold-tolerant Indian peanuts and this could be due to environmental influence. Leaf width had significant difference amongst genotypes under study; this could be due to agronomic adaptation to the different agronomic and environmental conditions since these genotypes are widely grown in Western, Rift valley and Coastal regions. These values are relatively lower than an average of 2.3 cm in cold-tolerant Indian peanuts (Upadhyaya et al., 2009). Leaf length/width ratio is used to give estimates on if the leaf is narrow or wide. Leaf with a ratio less than 2 are broad, since the leaf width is higher while those with a ratio more than 3 are narrow due to the higher leaf length. Based on this, all the varieties under study had broad leaves. Similar findings were found in Jerusalem artichoke (Diederichsen, 2010).
Based on the grain length/breadth ratio, groundnuts that have length 4-5times longer than the width are considered as long grain while those with a ratio of length 2 to three times longer than the breadth are considered as medium-grained. Grain weight showed significant difference amongst the genotypes of study. Findings in Indian groundnuts showed a mean grain weight of 0.539 g (Upadhyaya et al., 2009).
Based on Euclidian distance of the 7 grain and leaf traits the genotypes clustering showed that Chalimbana a coastal genotype had close relation with ICG83708 a genotype majorly grown in the western region of Kenya. This shows that these genotypes have similar phenotypic traits resulting from environmental adaptability. CG7 and ICGV99568 clustered together implying that these genotypes have similar phenotypic traits. It is, notable that these clustering contained genotypes that originated from Rift valley region and one from Western region, this means that despite the different geographical origin these genotypes possess similar leaf and grain traits. Western Kenya genotypes RV and ICGV12991 clustered into one major cluster implying that they have similar phenotypic traits. These could be due to similar environmental conditions and also existence of similar genes that causes expression of similar phenotypic characteristics (Lobo and Shaw, 2008).
Eigen values generated showed that the first principal component accounted for higher contributions to the total variation observed compared to other principal components. The principal component techniques is an important factor in phenotypic diversity studies since it allows the evaluation of the importance of a trait to the total variation observed (Hamid et al., 2009). The total variation In PC1 was 41.6%, phenotypic traits such as grain weight, grain length and grain breadth accounted the most to the diversity observed. Leaf length/width ratio and grain length/width ratio are important traits that contributed to the variation patterns observed in PC2.
Determination of genetic diversity amongst the groundnut genotypes showed considerable levels of genetic diversity. Finding from a study by Khera et al. (2013) utilizing SNPs to carry out genetic diversity, showed a major allele frequency ranging from 0.5 to 0.99 with a mean of 0.67 on a reference set of groundnuts. The difference in values attained can be attributed to different genotypes of groundnuts use and the type of molecular marker used. According to Goddard et al. (2000) markers that have a major allele frequency that ranges from 0.5 to 0.8 can be used in mapping of QTLs since they contribute approximately equally to information in the linkage equilibrium studies. The low mean allele number per locus observed can be as a result of founder effects, bottlenecks or genetic isolation that the genotypes under study have experienced. The 0.3178 mean gene diversity value observed was lower than 0.683 observed in genetic diversity studies on Brazilian cultivated peanut genotypes using SSR markers (Moretzsohn et al., 2004). Observed heterozygosity was lower than 0.6974 observed in genetic diversity of rhizome peanuts using microsatellite markers (Pandey et al., 2012). The difference between observed and expected heterozygosity seen in this study is attributed to the high inbreeding coefficient observed in this study. Similar findings have been observed in genetic diversity of selected rice genotypes using microsatellite markers (Chemutai et al., 2016).
Polymorphic information content shows the informativeness of molecular marker (Hildebrand et al., 1994). Based on PIC classification standards most of the markers are reasonably informative markers. The observed PIC is lower than 0.49 observed by Ncube Kanyika et al. (2015) in African peanut germplasm in a study to identify SSR markers to be used in QTL mapping studies. In a study by Shoba et al. (2010), 11 groundnut genotypes were studied using 17SSR markers and only six were polymorphic (24%) and PIC values ranged from 0.17 to 0.63 with an average of 0.41. The neighbour joining tree used in this study was most suitable since it does not assume a rigid molecular clock as observed in the Un-weighted pair group method using arithmetic average (UPGMA) (Ngari et al., 2018). The observed replicates in sub cluster IA implies that these genotypes are identical genotypically and have no genetic divergence amongst them Each genotype and its replicates clustered into a single sub cluster with no admixture implying that low genetic variation was prevalent within and among the genotypes under study (Matheri et al., 2016).
The PCoA attained in this study supports the clustering observed in the phylogenetic tree. Genotypes that were located closer to each other confirm the neighbour joining tree findings on existence of a similar ancestry (Matheri et al., 2016). Genotypes that ordinated on one spot within the quadrant, for instance, in quadrant IV shows the existence of replicates. Also, RV replicates were scattered across quadrant I and II implying that these replicates harbour a large genetic variation amongst the genotypes which could be attributed to chromosomal mutations amongst these genotypes. The principal coordinates obtained were lower than 88.64% molecular variance (coordinate 1) and 3.74 (coordinate 2) obtained by Ren et al. (2014) in a study on genetic diversity of major peanuts grown in China using SSR markers. Low bootstrap values observed in sub clusters of major clusters III and IIA could be attributed to the high within population variation, which is observed in the AMOVA table. High within population variation attained in AMOVA implies that within the Kenyan peanut genotypes there exists a significantly high within population variation.
The phenotypes diversity indicated variation based on the seed and leaf traits. Cluster analysis grouped the groundnut genotypes intro three major groups, with cluster III containing genotypes from Western region contrary to the other with an admixture.PIC values showed that IPAHM 176 is most informative marker for diversity studies using SSR markers. Phylogenetic neighbour joining tree showed that coastal variety, Chalimbana was distinct from other genotypes under study.
The authors have not declared any conflict of interests.
This project was partially funded by Annah Wanjira Mumbe of Guadalupe Catholic Parish Nairobi. The authors thank the Kenyatta University for providing laboratory. The authors gratefully acknowledge Kenya Agricultural and Livestock Research Organization, Kakamega, for providing the groundnut seeds and Inqaba Biotechnology co. limited for primers sourcing.
REFERENCES
|
Chemutai LR, Musyoki MA, Kioko WF, Mwenda NS, Muriira KG, Piero NM (2016). Genetic Diversity Studies on Selected Rice (Oryza sativa L.) Genotypes based on Gel Consistency and Alkali Digestion. Rice Research: Open Access 2016:1-6.
Crossref
|
|
|
|
Diederichsen A (2010). Phenotypic diversity of Jerusalem artichoke (Helianthus tuberosus L.) Germplasm preserved by the Canadian gene bank. Helia 33(53):1-16.
Crossref
|
|
|
|
|
Doyle JJ, Doyle JJ (1990). Isolation of plant DNA from fresh tissue. Focus 12:13-15.
Crossref
|
|
|
|
|
Goddard KA, Hopkins PJ, Hall JM, Witte JS (2000). Linkage disequilibrium and allele-frequency distributions for 114 single- nucleotide polymorphisms in five populations. The American Journal of Human Genetics 66(1):216-234.
Crossref
|
|
|
|
|
Guo DL, Guo MX, Hou XG, Zhang GH (2014). Molecular diversity analysis of grape varieties based on iPBS markers. Biochemical Systematics and Ecology 52:27-32.
Crossref
|
|
|
|
|
Hamid JS, Hu P, Roslin NM, Ling V, Greenwood CM, Beyene J (2009). Data integration in genetics and genomics: Methods and challenges. Human Genomics and Proteomics: HGP, 2009. Available at:
View
Crossref
|
|
|
|
|
Hildebrand CE, David C, Torney C, Wagner P (1994). Informativeness of polymorphic DNA markers. Los Alamos Science 20:100-102.
|
|
|
|
|
Ingale S, Shrivastava SK (2011). Nutritional study of new variety of groundnut (Arachis hypogaea L.) JL-24 seeds. African Journal of Food Science 5(8):490-498.
|
|
|
|
|
Khera P, Upadhyaya HD, Pandey MK, Roorkiwal M, Sriswathi M, Janila P, Guo Y, McKain MR, Nagy ED, Knapp SJ, Leebensâ€Mack J (2013). Single nucleotide polymorphism-based genetic diversity in the reference set of peanut (Arachis spp.) by developing and applying cost-effective competitive allele specific polymerase chain reaction genotyping assays. The Plant Genome 6(3):1-11.
Crossref
|
|
|
|
|
Lobo I, Shaw K (2008). Discovery and types of genetic linkage. Nature Education 1(1):139.
|
|
|
|
|
Matheri F, Teya F, Kioko F, Mawia AM, Mwangi M (2016). Genotyping of Kenyan Passiflora Edulis Flavicarpa Hybrid Accessions and their Parents using SSR Markers. Vegetos 29:4.
|
|
|
|
|
Moretzsohn MC, Hopkins MS, Mitchell SE, Kresovich S, Valls JF, Ferreira ME (2004). Genetic diversity of peanut (Arachis hypogaea L.) and its wild relatives based on the analysis of hyper variable regions of the genome. BMC Plant Biology 4(1):11.
Crossref
|
|
|
|
|
Ncube Kanyika BT, Lungu D, Mweetwa AM, Kaimoyo E, Njung'e VM, Monyo ES, Siambi M, He G, Prakash CS, Zhao Y, de Villiers SM (2015). Identification of groundnut (Arachis hypogaea) SSR markers suitable for multiple resistance traits QTL mapping in African germplasm. Electronic Journal of Biotechnology 18(2):61-67.
Crossref
|
|
|
|
|
Ngari LN, Njagi SN, Kamau JK, Lagat RC, Musyoki AM (2018). Genotypic Characterization of Catha edulis in Mt. Kenya Region, Kenya. Journal of Phylogenetics and Evolutionary Biology 6(203):2-8.
Crossref
|
|
|
|
|
Pandey MK, Monyo E, Ozias-Akins P, Liang X, Guimarães P, Nigam SN, Cook DR (2012). Advances in Arachis genomics for peanut improvement. Biotechnology Advances 30(3):639-651.
Crossref
|
|
|
|
|
Peakall R, Smouse PE (2012). GenALEx 6.5: Genetic analysis in Excel. Population genetic software for teaching and research-An update. Bioinformatics 28(19):2537-2539.
Crossref
|
|
|
|
|
Ren X, Jiang H, Yan Z, Chen Y, Zhou X, Huang L, Wei W (2014). Genetic diversity and population structure of the major peanut (Arachis hypogaea L.) cultivars grown in China by SSR markers. PloS One 9(2):e88091.
Crossref
|
|
|
|
|
Shoba D, Manivannan N, Vindhiyavarman P (2010). Genetic diversity analysis of groundnut genotypes using SSR markers. Electronic Journal of Plant Breeding 1(6):1420-1425.
|
|
|
|
|
Suprapto A, Sugito Y, Sitompul SM (2013). Study of growth, yield and radiation energy conversion efficiency on varieties and different plant population of peanut. Procedia Environmental Sciences 17:37-45.
Crossref
|
|
|
|
|
Tamura K, Dudley J, Nei M, Kumar S (2007). MEGA4: Molecular evolutionary genetics analysis (MEGA) software version 4.0. Molecular Biology and Evolution 24:1596-1599.
Crossref
|
|
|
|
|
Upadhyaya HD, Reddy LJ, Dwivedi SL, Gowda CL, Singh S (2009). Phenotypic diversity in cold-tolerant peanut (Arachis hypogaea L.) germplasm. Euphytica 165(2):279-291.
Crossref
|
|
|
|
|
Wang LX, Elbaidouri M, Abernathy B, Chen HL, Wang SH, Lee SH, Cheng XZ (2015). Distribution and analysis of SSR in mung bean (Vigna radiata L.) genome based on an SSR-enriched library. Molecular Breeding 35(1):25.
Crossref
|
|
|
|
|
Wu CA, Campbell DR (2007). Leaf physiology reflects environmental differences and cytoplasmic background in Ipomopsis (Polemoniaceae) hybrids. American Journal of Botany 94(11):1804-1812.
Crossref
|
|