Full Length Research Paper

ABSTRACT
Maize (Zea mays L.) occupies an important place among food crops in Côte d’Ivoire. However, no study on the genetic diversity of the species has been performed to date. This study aims at analyzing the diversity and genetic structure of 35 maize accessions using 10 microsatellite markers. These accessions are from different agro-ecological zones representative of the Ivorian territory. The results showed that for all accessions studied, 47 alleles were detected, with an average of 6.71 ± 2.21 alleles per locus. The percentage of polymorphic loci and total genetic diversity, were 91.34% and 0.524 ± 0.159. A slight excess of heterozygotes was observed in the accessions (4.6%). The molecular analysis of variance showed that the total genetic diversity is mainly due to the intra-accession diversity (85.17%). The inter-accession diversity rate was estimated at 14.87%, which is in favor of moderate differentiation between the accessions. The Bayesian analysis grouped the accessions into two populations, regardless of geographical origin. These results provide basic information potentially useful in selection. The cross between two individuals from different groups might help exploit the phenomenon of heterosis.
Key words: Ex situ conservation, Côte d’Ivoire, genetic diversity, maize, microsatellite marker.
INTRODUCTION
Maize (Zea mays L.) is an annual herbaceous tropical crop. It was domesticated about 9000 years ago from teosinte (Zea mays parviglumis subspecies) in a medium-altitude region located in southern Mexico City (Van Heerwaarden et al., 2010). In West Africa, maize and rice (Oryza spp.) make up the main source of food for largely rural populations. In Côte d’Ivoire, the area planted with maize is 349 470 ha with an annual yield of 680 000 tons (FAOSTAT, 2015). It is grown in all the agro-ecological zones of the country and has various uses. Its grains are highly consumed, but they also serve as raw material for feed mills, breweries, oil-mills, manufacture of flour and starch. Despite such food and economic importance, the average maize yield remains low. It is estimated at 1.95 t/ha (FAOSTAT, 2015) against more than 6 tons in Argentina and more than 10 in Chile and French Guiana (FAOSTAT, 2015). This remains a real problem and a serious limitation to the fight against food insecurity. Serious actions should be taken so as to improve maize yields in Côte d’Ivoire.
Local maize varieties are of major importance. They contain a range of genetic diversity necessary to increase and maintain the yield potential of maize in Côte d’Ivoire. In addition, they provide new sources of resistance to various biotic and abiotic stresses (Hammer and Teklu, 2008). The genetic diversity of local varieties is unanimously accepted as a prerequisite for enhancing agricultural productivity and food security. The optimal use of this diversity presupposes that it is characterized in all its aspects. The study of the morphological diversity of Ivorian maize has been discussed in some previous works. To our knowledge, the diversity based on molecular description has never been studied so far. This work is the first approach to the genetic variability of local varieties of Ivorian maize.
Microsatellites are considered to be good molecular markers. They are co-dominant, multiallelic and neutral vis-à-vis the selection process (Mondini et al., 2009). Microsatellites are relatively small and, therefore, are easily amplified using the PCR (“Polymerase Chain Reaction”) technique. The procedure is relatively simple and fast, followed by a migration of the amplified fragments on an acrylamide gel or on a sequencing gel. The availability of automated DNA sequencers enables a high-speed analysis of a large number of samples. Several loci can be studied simultaneously when the primers used are labeled with different colored fluorophores (multiplex PCR). The technique requires a very low quantity of DNA. These technical and genetic features justify now the choice of microsatellites in estimating the genetic diversity of several cultivated species such as maize (Oppong et al., 2014), rice (Kumbhar et al., 2015), sorghum (Adugna, 2014), millet (Danjuma et al., 2014), wheat (Arora et al., 2014), barley (Chen et al., 2012) and quinoa (Bazile et al., 2014).
This study aims at assessing the variability and genetic structure of local varieties of Ivorian maize using microsatellite markers. The results of the assessment can contribute to the ex situ conservation and the development of selection strategies in order to improve maize yield in Côte d’Ivoire.
MATERIAL AND METHODS
Plant Material
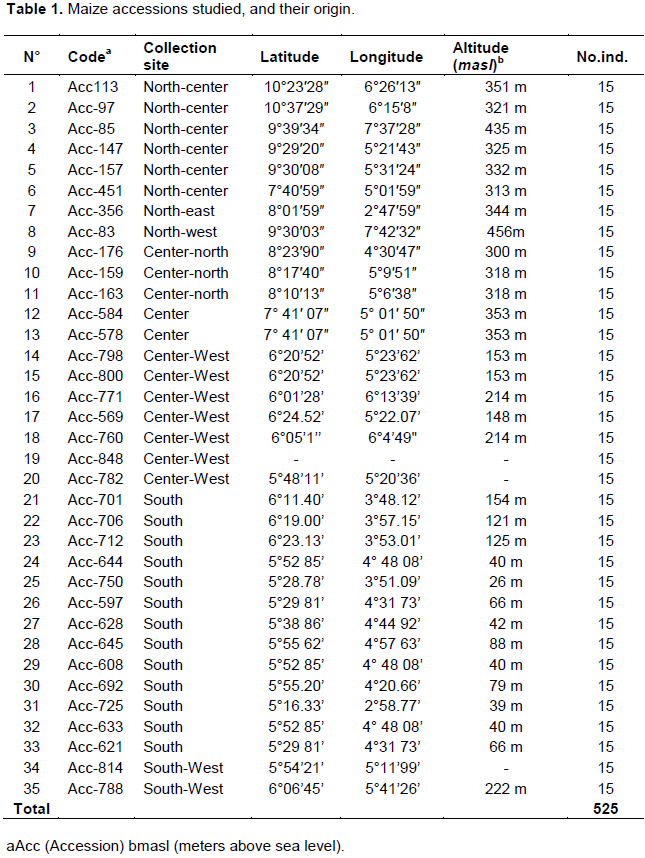
This study concerned 35 maize accessions. Previously, a set of 116 accessions collected in different agro-ecological zones of Côte d’Ivoire was analyzed using 22 morphological and agronomic descriptors. Multivariate analyses helped to structure these 116 maize accessions into five groups. These 35 accessions were selected from five phenotypic groups identified by multivariate analyses, so as to represent the genetic diversity of the species. They were also selected based on their geographical origin. The accessions and their collection area are listed in Table 1.
Extraction of genomic DNA
Fifteen seedlings per accession were analyzed. The choice of this number was based on the studies of Warburton et al. (2010) and Wasala and Prasanna (2013). The total number of individuals to be analyzed was 525. Genomic DNA was extracted from 100 mg of fresh plant material taken from 10 to 15 days old seedlings. The extractions were performed according to the extraction kit protocol, Thermo Scientific GeneJET Plant Genomic DNA Purification Mini Kit (available on the website: www.thermoscientific.com/onebio) at the Central Laboratory of Biotechnology of the CNRA. The purity and concentration of the extracted DNA were verified respectively by electrophoresis on 0.8% agarose gel and by assay using the Nanodrop spectrophotometer (Thermo Scientific NanoDrop 2000). The extracted DNA was placed at -20°C.
Microsatellite markers used were 16 microsatellite loci markers (Supplied by InqabaBiotec) covering the entire maize genome which was analyzed for this study. These microsatellites were selected from the maize database (Maize GDB, 2016). The choice of markers was mainly based on the pattern, size and amplification quality. They are known to be polymorphic and used successfully in the study of the genetic diversity of maize by several authors (Matsuoka et al., 2002; N’guyen et al., 2012; and Pineda-Hidalgo et al., 2013). The sequence of primers, the location of such sequences in the genome and the repeated patterns are available on the website: http://www.maizegdb.org.
Amplification of microsatellite markers using PCR
PCR amplification was performed in 96-microwell plate. The final volume for PCR reaction was 10 µl and contained DreamTaq ™ Green PCR Master Mix 2X (Thermo Scientific, Inqaba Biotec), 0.20 µM 5’-tailed M13 forward and reverse primers (Inqaba Biotec) and 5ng DNA. The conditions of the PCR performed in a GeneAmp PCR System 9700-type thermal cycler (Applied Biosystems) were as follows (Warburton et al., 2002): a first denaturation at 94°C for 2 min, followed by 30 cycles, each comprising a denaturation at 94°C (30 s), a hybridization at the determined optimum temperature X°C (1 min) and an elongation at 72°C (1 min). A final elongation step at 72°C (5 min) was scheduled. X°C refers to hybridization temperatures of each primer, determined by the following equation: Ta = [2°C (A + T) + 4°C (G + C) - 5°C] (Newton and Graham, 1997). Each amplification of maize DNA extracts was assayed by electrophoresis on 2% agarose gel before genotyping. The amplification products were genotyped using a LI-COR® sequencer (LI-COR 4300 DNA Analyser, USA). The interpretation of genotypes was then carried out through the SAGA 2.0 software.
Data analysis
Genotyping data are represented as a matrix with markers in columns, and individuals in lines. Each marker is represented by two allelic forms. The matrix is cleaned by removal of individuals who showed a high number of missing data (over 20%). From this matrix, the standard parameters measuring genetic diversity were calculated for each locus, each accession and for all accessions. Prior to analyses, the hypotheses necessary for the implementation of population genetic models were verified (accordance with Hardy-Weinberg equilibrium and absence of linkage disequilibrium) as well as the potential presence of null alleles. The parameters measured were the percentage of polymorphic loci (P = number of polymorphic loci/total number of loci) at 95% threshold, the average number of alleles per locus, expressing allelic richness of loci (Na = number of alleles/number of loci), the number of efficient alleles (Ne = 1/Σ pi2), the number of private alleles (Nap: alleles exclusively present in a given accession), the heterozygosity observed (Ho) and the unbiased estimate of expected heterozygosity (He = 1- Σpi2) under the Hardy-Weinberg hypothesis and the total genetic diversity (Ht), defined by Nei (1975). All these indices were calculated using the PopGene Version 1.32 software (Yeh et al., 1999) except for the number of private alleles calculated with GenAlex version 6.5 (Peakall and Smouse, 2006). Since the input format differs from one software to another, the software PGDSpider_2.0.9.1 (Lischer and Excoffier, 2012) was used to convert the files. The Micro-Checker software (Oosterhout et al., 2004) was used to verify the potential presence of null alleles.
The structure and level of differentiation of accessions were analyzed at different levels in order to highlight variability in the most optimal way. Genetic differentiation of populations was addressed in part by the standard F-statistics (FST, FIS and FIT) initially described by Wright (1978), corrected by Weir and Cockerham (1984) so as to derive unbiased estimators therefrom. These parameters were estimated using the FSTAT software for Windows, Version 2.9.3.2 (Goudet, 2002). On the other hand, a molecular analysis of variance (AMOVA) was performed using the Arlequin 3.5 software (Excoffier et al., 2005) to check whether the genetic variation was greater within accessions or between the accessions. A Bayesian analysis was performed using the STRUCTURE 2.3.4 software and method of Pritchard et al. (2000), with a view to detect a structuring of accessions in genetically different groups. This approach defines “K” subpopulations (classes), assigning individuals to groups under Hardy-Weinberg equilibrium, without a priori information on their membership in a population. Mixture models “admixture model” and correlated allele frequencies were used (Falush et al., 2003), with Ks varying from 1 to 10. Each model was set up using 10 000 iterations per100 000 burn-in, repeated 10 times for each value of K. The results of iterations were visualized using the STRUCTURE HARVESTER program (Earl and VonHoldt, 2012), available at: http://taylor0.biology.ucla.edu/structureHarvester/.The optimal number of “K”classes was determined according to the Evanno et al. (2005) method. Accessions having more than 60% of their genome from a group were assigned to such group. Below 60%, individuals were classified as intermediate (Yang et al., 2011).
RESULTS
Polymorphism of microsatellite markers
Of the 16 primers tested, six were eliminated as they showed no bands. Of the ten loci for which profiles were observed, three (phi041, phi102228, phi233376) proved monomorphic in all samples (Figure 1). Those markers were excluded from the analysis. Seven primers having polymorphic bands were used for analyses (Figure 1). Similarly, individuals having more than half of their markers to no avail were excluded, as too many missing data might unbalance and bias the analysis. The number of individuals selected for the analysis was 491.

The total number of alleles detected was 47 alleles, of which 6 were specific to a single accession (12.76%). The number of alleles per locus ranged from 4 (phi389203) to 11 (phi064) with an average of 6.71 ± 2.21 different alleles. The number of efficient alleles (Ne) ranged between 1.317 (phi112) and 3.316 (phi064), with an overall average of 2.288 ± 0.683. The heterozygosity observed switched from 0.231 for locus phi112 to 0.668 for locus phi064. The expected heterozygosity switched from 0.240 for phi112 to 0.699 for phi064. The average values of Ho and He were 0.468 ± 0.163 and 0.524 ± 0.160 respectively. The genetic diversity of Nei per locus switched from 0.240 for phi112 to 0.698 for phi064. Its multilocus value was high with an average of 0.524 ± 0.159 (Table 2).

Genetic diversity within accessions
The average values of genetic diversity indices per accession are presented in Table 3. The average number of alleles observed for seven loci within an accession ranged from 1.714 (acc356 and acc584) to 3.857 (acc760). Six accessions (acc97, acc569, acc608, acc628, acc645, acc706 and acc725) had a private allele each, of which 2 could be considered as rare alleles (Freq < 0.05). The percentage of polymorphic loci obtained for all accessions was 91.34% and ranged from 57.14% (acc159 and acc356) to 100% (acc97; acc85; acc147; acc83; acc176; acc798; acc800; acc771; acc569; acc760; acc848; acc750; acc597; acc628; acc645; acc608; acc725; acc633; acc788). The average values of Ho ranged from 0.260 ± 0.341 to 0.642 ± 0.176, respectively for accessions acc356 and acc848. The average values of He were in general lower than those observed. The lowest heterozygosity rate expected was recorded in accession acc356 (0.233 ± 0.277), while the highest rate was that of accession acc85 (0.630 ± 0.094). The highest genetic diversity of Nei was observed in accession acc85 (0.609 ± 0.09), while the lowest value concerned accession acc356 (0.225 ± 0.267).


Structure of accessions
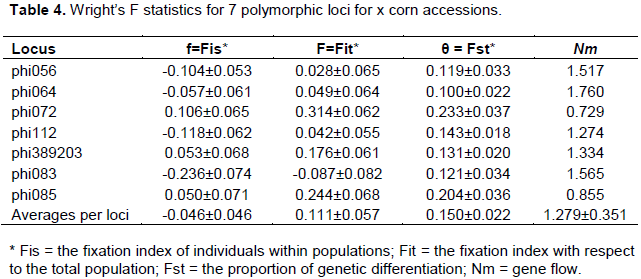
F-statistics was calculated for each locus, and all loci are shown in Table 4. Fixation indices (Fis) were different from 0 and negative for some loci and for all of the analyzed loci (Fis = -0.046 ± 0.046). Fit values switched from -0.087 ± 0.082 for locus phi083 to 0.028 ± 0.065 for locus phi056. A moderate genetic differentiation was observed between the accessions. The Fst ranged from 0.100 ± 0.022 (phi064) to 0.233 ± 0.037 (phi072). The average change in all loci was 0.150 ± 0.022.
The molecular analysis of variance applied to all the accessions (Table 5) showed that the greatest portion of variance (85.17%) was due to the variation between individuals within accessions. The variation due to accessions within regions was low (14.87%), while the one due to regions was very low and even negative (-0.04%). Of the three sources of variation, the difference between regions was not significant (p = 0.49071> 0.05).

The Bayesian analysis showed a structuring of accessions in homogeneous genetic groups. The values of Delta K Evanno (ΔK = 43.475) showed that the most relevant partition was the one in two groups (K = 2). Figure 2 shows the assignment profiles of all accessions for K equal to two. Each color bar, red, green, or mixed, corresponds to an individual. Cluster 1 “red”, consisted of 13 accessions of which half were represented by accessions from the north (7) and the other half by accessions from the center (3) and the South (3). Cluster 2 “green”, gathered 12 accessions of which four were from the north, three from the center and three five from the south. The other eight accessions made up the intermediate group.

DISCUSSION
The local genetic resources constitute a basis for the improvement of production capacities of a species in its environment and in other areas. In the characterization of genetic resources, the first works concern most of the time agro-morphological studies. However, morphological studies alone do not provide sufficient information to help understand neither the genetic diversity of species nor their resemblance to other species. The molecular analysis by microsatellite provides additional information on genetic diversity. Previous studies have shown that maize contains an abundant number of microsatellites (Senior et al., 1998), highly polymorphic even between samples of small size (Chin et al., 1996). To our knowledge, it is the first time the study of the genetic diversity of maize has been performed using microsatellite markers in Côte d’Ivoire.
This study revealed a relatively high allelic richness in the different maize accessions analyzed. The average number of alleles per primer is almost similar to the one reported by Barcaccia et al. (2003). But it is high, compared to the value 3.85 observed by Legesse et al. (2007) and 5.34 found by Yu et al. (2007). The genetic diversity observed in this study is also higher than the one reported by Rupp et al. (2009) and Park et al. (2008) on maize. These results could be explained in part by the sampling technique applied which took into account not only geographic differences but also morphological differences. Bogyo et al. (1980) showed that the sampling based on geographic origin and morphological variation is the most efficient way, to capture the maximum genetic diversity.
These results might also be due to the genetic nature of plant material. Indeed, these authors in their studies have focused on hybrid varieties or lines. But these varieties have less diversity than population varieties because of the selection pressure. However, the genetic diversity estimates obtained in this work seem less important than those obtained for microsatellite loci in other works on maize. Kostova et al. (2007) reported an average number of alleles by 9.1 and genetic diversity by 0.713 for Bulgarian maize, using 18 SSRs. Qi-Lun et al. (2008) reported that the Na and He values for local varieties in China were 7.93 and 0.70 respectively. Wasala and Prasanna (2013) analyzed the genetic diversity of local populations of India maize using 42 microsatellites. They deduced therefrom Na by 13.1 and He by 0.63. Similarly, Oppong et al. (2014) found by means of 20 microsatellite a Na value equal to 7.3 for local varieties of Ghanaian maize. The number of alleles reported in a diversity study is usually proportional to the sample size (Foulley et al., 2006). Some differences observed here could be attributed to the sampling difference. However, another factor affecting the number of alleles is the use of di-nucleotide microsatellite sequence. According to Liu et al. (2003) the di-nucleotide microsatellite sequences produce a higher number of alleles and show greater genetic diversity. The significant allelic richness observed in these previous studies might be partly linked to the high number of di-nucleotide used.
The genetic structure analysis suggests a slight excess of heterozygote relatively having panmictic proportions. This result is in accordance with the observations made by Eloi et al. (2012). In the literature, a deficit of heterozygotes was often encountered in maize (Yao et al., 2007; Pineda-Hidalgo et al., 2013.). Brown (1979) explained that a widespread deficit of heterozygotes is found among preferentially allogamous species. The results obtained do not confirm the observations of those authors. The excess of heterozygosity observed might come from a strong selection in favor of heterozygotes. In maize, inbreeding depression negatively affects the size and shape of the ears, while heterosis produces longer ears, more and often larger grains (Jain and Bharadwaj, 2014). By choosing as seed to renew their crops the biggest and most beautiful ears, farmers unwittingly select heterozygous individuals.
The coefficient of genetic differentiation (Fst = 0.150 ± 0.022) reveals that there is a moderate differentiation between accessions (Wright, 1978). This result is in accordance with the results of Qi-Lun et al. (2008) and those of Pineda-Hidalgo et al. (2013). This could be explained by the fact that there are moderate gene flows, due to the proximity of neighboring fields or seed exchange between different groups living in different regions. For a naturally allogamous species like maize, these biological events are more probable, as exchanges between populations are favored by cross-pollination. This value is still higher than the one obtained by Pressoir and Berthaud (2004) for local populations of maize in the region of Oaxaca, Mexico (Fst = 0.011). The low genetic differentiation observed by these authors might be due to the geographical distance between populations. These authors worked on populations from a single region. But according to Affre et al. (2003), genetic differentiation increases with the geographic distance of agricultural plots. Fst values are very low on short distances because gene flows are more frequent and increase, generally, when agricultural plots are increasingly remote.
The AMOVA analysis showed that genetic diversity is greater within accessions than between them, which confirms the results of Fst previously calculated. The significant genetic variability within each accession could be favored by the mode of reproduction preferentially allogamous found in maize. This result is consistent with previous studies carried out on this species (Hoxha et al., 2004) and more generally on allogamous species (Wanjala et al., 2013). According to Affre et al. (2003) and Nybom (2004) allogamous species usually maintain a strong genetic variation within populations and a low genetic differentiation between populations, conversely, in autogamous species. These trends are similar to those reported by Hamrick and God (1997), in a benchmark study in which these authors showed that intra accession genetic diversity ranges from 0.103 to 0.266 in allogamous crops. Exchange or mixture of seeds by farmers is also another factor justifying the high variability within accessions. Generally, varieties grown by farmers are mixtures of populations.
The Bayesian clustering analysis by structure described two genetic groups, regardless of geographical origin. These results are similar to those obtained by Jia et al. (2013) on green foxtail. This structuring can be explained by the existence of a common genetic basis between the different accessions despite the geographical and phenotypic divergence. Indeed, the detailed examination of the genetic profile of each accession unveils a genetic introgression, reflecting the gene flows occurring between the different accessions.
CONCLUSION AND IMPLICATIONS
This study has helped in identifying seven polymorphic microsatellite markers that could be used more widely in the characterization of maize in Côte d’Ivoire. These markers showed a quite significant genetic variability in the accessions analyzed. Of all the 491 genotyped individuals, a total of 47 different alleles were identified. Some accessions showed alleles that are specific to them, that is, a percentage of 12.76% of total alleles. A slight excess of heterozygotes was observed in accessions (4.6%), which is the result of a peasant selection in favor of heterozygotes. The accessions studied show high levels of intra-accession genetic diversity and moderate differentiation. The conservation of small number of accessions ex situ, could be enough to represent the diversity found in cultivars, as each accession is genetically rich. Such conservation must involve first the accessions which showed a high level of polymorphism and private alleles. In the case of this study, priority accessions could be: acc97, acc569, acc628, acc633, acc645 and acc706. The fact that the rare alleles have more chance of disappearing by genetic drift is another factor to consider in setting conservation priorities.
A structuring into two populations has been highlighted. The genetic diversity observed is promising for the development of new cultivars. Both groups obtained can be used for the formation and improvement of heterotic pools. The cross between two individuals of different pools might help to exploit the phenomenon of heterosis. However, this work remains a preliminary study of genetic diversity of corn in Côte d’Ivoire. It should be further strengthened by increasing the number of microsatellite as well as the number of samples studied. Moreover, the use of much more variable markers such as SNPs, will enable to better structure and describe genetic diversity, with a view to its management and exploitation in plant breeding programs.
CONFLICT OF INTERESTS
The authors have not declared any conflict of interests.
ACKNOWLEDGMENTS
The results presented in this article were obtained as part of a project which has received financial support from the Ivorian-Swiss Fund for Economic and Social Development (FISDES). The authors wish to express their thanks to all the managers of the project, particularly Dr. Louise Akanvou who coordinated this research project with the United Nations Development Programme (UNDP). The authors also extend their sincere thanks to the authorities of the National Center for Agronomic Research (CNRA) for the materials made available to them for the achievement of this research work.
REFERENCES
|
Adugna A (2014). Analysis of in situ diversity and population structure in Ethiopian cultivated Sorghum bicolor (L.) landraces using phenotypic traits and SSR markers. Springer Plus 3:212. |
|
|
Affre L, Utoit TD, Jagër M, Garraud L (2003). Écologie de la reproduction et de la dispersion, et structure génétique chez les espèces messicoles : propositions de gestion dans le Parc naturel régional du Luberon. B.R.G. 4:405-428. |
|
|
Arora A, Kundu S, Dilbaghi N, SharmaI, Tiwari R (2014). Population structure and genetic diversity among Indian wheat varieties using microsatellite (SSR) markers. Aust. J. Crop Sci. 8(9):1281-1289. |
|
|
Barcaccia G, Lucchin M, Parrini P (2003). Characterization of a flint maize (Zea mays var. indurata) Italian landrace, II. Genetic diversity and relatedness assessed by SSR and Inter-SSR molecular markers. Genet. Res. Crop Evol. 50:253-271. |
|
|
Bazile D, Martínez AE, Fuentes F (2014). Diversity of Quinoa in a Biogeographical Island: a Review of Constraints and Potential from Arid to Temperate Regions of Chile. Not. Bot. Horti. Agrobo. 42(2):289-298. |
|
|
Bogyo TP, Porceddu E, Perrino P (1980). Analysis of sampling strategies for collecting genetic material. Econ. Bot. 34:160-174. |
|
|
Brown (1979). Enzyme polymorphism in plant populations. Theor. Pop. Biol. 15:l-42. |
|
|
Chen ZW, Lu RJ, Zou L, Du ZZ, Gao RH, He T, Huang JH (2012). Genetic diversity analysis of barley landraces and cultivars in the Shanghai region of China. Genet. Mol. Res. 11(1):644-650. |
|
|
Chin EC, Senior ML, Shu H, Smith JS (1996). Maize simple repetitive DNA sequences: abundance and allele variation. Genome 39:866-873. |
|
|
Danjuma MN, Mohammed S (2014). Genetic diversity of Pearl Millet (Pennisetum typhoides) cultivars in semi-arid northern Nigeria. J. Nat. Sci. Res. 4(22):34-42. |
|
|
Earl DA, VonHoldt BM (2012). STRUCTURE HARVESTER: a website and program for visualizing STRUCTURE output and implementing the Evanno method. Conserv. Genet. Resour. 4(2):359-361. |
|
|
Eloi IBO, Mangolin CA, Scapim CA, Gonçalves CS, Machado MFPS (2012). Selection of high heterozygosity popcorn varieties in Brazil based on SSR markers. Genet. Mol. Res. 11(3):1851-1860. |
|
|
Evanno G, Regnaut S, GoudetJ (2005). Detecting the number of clusters of individuals using the software STRUCTURE: a simulation study. Mol. Ecol. 14:2611-2620. |
|
|
Excoffier L, Laval G, Schneider S (2005). Arlequin ver. 3.0: An integrated software package for population genetics data analysis. Evol. Bioinform. 1:47-50. |
|
|
Falush D, Stephens M, Pritchard JK (2003). Inference of population structure using multilocus genotype data: Linked loci and correlated allele frequencies. Genet. 164 (4):1567-1587. |
|
|
FAOSTAT (2015). Statistical database of the food and agriculture of the United Nations. |
|
|
Foulley JL, Ollivier L (2006). Diversité génétique et richesse allélique : concepts et application à des races bovines. In : Treizièmes rencontres autour des recherches sur les ruminants, 6-7 décembre 2006, Paris, France, pp. 227-230. |
|
|
Goudet J (2002). FSTAT, a program to estimate and test gene diversities and fixation indices (version 2.9.3.2). |
|
|
Hammer K, Teklu Y (2008). Plant Genetic Resources: Selected Issues from Genetic Erosion to Genetic Engineering. JARDTS 109(1):15-50. |
|
|
Hamrick JL, Godt JW (1997). Allozyme diversity in cultivated crops. Crop Sci. 37:26-30. |
|
|
Hoxha S, Shariflou MR, Sharp P (2004). Evaluation of genetic diversity in Albanian maize using ssr markers. Maydica 49:97-103. |
|
|
Jain R, Bharadwaj DN (2014). Heterosis and inbreeding depression for grain yield and yield contributing characters in quality protein maize. Agric. Commun. 2(1):8-16. |
|
|
Jia G, Shi S, Wang C, Niu Z, Chai Y, Zhi H, Diao X (2013). Molecular diversity and population structure of Chinese green foxtail [Setaria viridis (L.) Beauv.] revealed by microsatellite analysis. J. Exp. Bot. 64(12): 3645-3656. |
|
|
Kostova AR, Todorovska EG, Christov NK, Sevov VA, Genov, MN, Vulchinkov SV, Atanassov AI (2007). Assessing the genetic diversity of Bulgarian maize Germplasm using microsatellite markers. Maydica 52:251-255. |
|
|
Kumbhar SD, Kulwa PL, Patil JV, Sarawate CD, G Aikwad AP, Jadhav AS (2015). Genetic Diversity and Population Structure in Landraces and Improved Rice Varieties from India. Rice Sci. 22(3):99-107. |
|
|
Legesse BW, Myburg AA, Pixley KV, Botha AM (2007). Genetic diversity of African maize inbred lines revealed by SSR markers. Heredity 144:10-17. |
|
|
Levene H (1949). On a matching problem in genetics. Ann. Math. Statist. 20:91-92. |
|
|
Lischer HEL, Excoffier L (2012). PGDSpider: An automated data conversion tool for connecting population genetics and genomics programs. Bioinform. 28:298-299. |
|
|
Liu Ke, Goodman M, Muse S, Smith JS, Buckler E, Doebley J (2003). Genetic structure and diversity among maize inbred lines as inferred from DNA microsatellites. Genet. 165:2117-2128. |
|
|
Maize GDB (2016). Maize Genetics and Genomics Database. |
|
|
Matsuoka Y, Vigouroux Y, Goodman MM, Sanchez J, Buckler E, Doebley J (2002). A single domestication for maize shown by multilocus microsatellite genotyping. Proc. Natl. Acad. Sci. USA 99:6080-6084. |
|
|
Mondini L, Noorani A, Pagnotta MA (2009). Assessing Plant Genetic Diversity by Molecular Tools. Diversity 1:19-35. |
|
|
Nei M (1975). Molecular population genetics and evolution. In: Neuberger A & Tatum EL, editors. Frontiers of biology, Vol. 40. North Holland, Amsterdam-Oxford, Netherlands pp. 288. |
|
|
Newton CA, Graham GA (1997). PCR. 2nd edn. Springer-Verlag, New York, pp. 192. |
|
|
N'guyen TV, Doan TTB, Leo AE, Bui CM, Taylor PWJ, Ford R (2012). Application of microsatellite markers to fingerprint and determine the representational diversity within recently established elite maize inbred line breeding program. J. Agric. Sci. 4(6):258-266. |
|
|
Nybom H (2004). Comparison of different nuclear DNA markers for estimating intraspecific genetic diversity in plants. Mol. Ecol. 13:1143-1155. |
|
|
Oppong A, Bedoya CA, Ewool MB, Asante MD, Thompson RN, Adu-Dapaah H, Lamptey JNL, Ofori K, Offei SK, Warburton ML (2014). Bulk genetic characterization of Ghanaian maize landraces using microsatellite markers. Maydica 59:1-8. |
|
|
Oosterhout CV, Hutchinson WF, Wills DPM, Shipley P (2004). Micro-checker: software for identifying and correcting genotyping errors in microsatellite data. Mol. Ecol. Notes 4:535-538. |
|
|
Park JS, Park JY, Park KJ, Lee JK (2008). Genetic diversity among waxy corn accessions in Korea revealed by microsatellite markers. Korean J. Breed. Sci. 40(3):250-257. |
|
|
Peakall R, Smouse PE (2006). GENALEX 6: genetic analysis in Excel. Population genetic software for teaching and research. Mol. Ecol. Notes 6:288-295. |
|
|
Pineda-Hidalgo KV, Méndez-Marroquín KP, Alvarez EV, Chávez-Ontiveros J, Sánchez-Pe-a P, Garzón-Tiznado JA, Vega-GarcíaMO, López-Valenzuela JA (2013). Microsatellite-based genetic diversity among accessions of maize landraces from Sinaloa in México. Hereditas 150:53-59. |
|
|
Pressoir G, Berthaud J (2004). Patterns of population structure in maize landraces from the central valleys of Oaxaca in Mexico. Heredity 92:88-94. |
|
|
Pritchard JK, Stevens M, Donnelly P (2000). Inference of population structure using multilocus genotype data. Genet. 155:945-959. |
|
|
Qi-Lun Y, Ping F, Ke-Cheng K, Guang-Tang P (2008). Genetic diversity based on SSR markers in maize (Zea mays L.) landraces from Wu ling mountain region in China. J. Genet. 87(3):287-291. |
|
|
Rupp JV, Mangolin CA, Scapim CA, Pires da Silva Machado MF (2009). Genetic structure and diversity among sweet corn (su1-germplasm) progenies using ssr markers. Maydica 54:125-132. |
|
|
Senior ML, Murphy JP, Goodman MM, Stuber CW (1998). Utility of SSRs for determining genetic similarities and relationships in maize using an agarose gel system. Crop Sci. 38:108-1098. |
|
|
Van Heerwaarden, J, Ross-Ibarra J, Doebley J, Glaubitz JC, Sanchez Gonzalez JD, Gaut BS, Eguiarte LE (2010). Fine scale genetic structure in the wild ancestor of maize (Zea mays ssp. parviglumis). Mol. Ecol. 19:1162-1173. |
|
|
Wanjala BW, Obonyo M, Wachira FN, Muchugi A, Mulaa M, Harvey J, Skilton RA, Proud J, Hanson J (2013). Genetic diversity in Napier grass (Pennisetumpurpureum) cultivars: implications for breeding and conservation. AoB PLANTS 5:1-10. |
|
|
Warburton ML, X Xianchun, J Crossa, J Franco, AE Melchinger, M Frisch, M Bohn, D Hoisingto (2002). Genetic characterization of CIMMYT inbred maize lines and open pollinated populations using large scale fingerprinting methods. Crop Sci. 42:1832-1840. |
|
|
Warburton ML, P Setimela, J Franco, H Cordova, K Pixley, M Bänziger, S Dreisigacker, C Bedoya, J Mac Robert (2010). Toward a cost-effective fingerprinting methodology to distinguish maize open-pollinated varieties. Crop Sci. 50:1-11. |
|
|
Wasala SK, Prasanna BM (2013). Microsatellite marker-based diversity and population genetic analysis of selected lowland and mid-altitude maize landrace accessions of India. J. Plant Biochem. Biotechnol. 22(4):392-400. |
|
|
Weir BS, Cockerham CC (1984). Estimating F-statistics for the analysis of population structure. Evolution 38:1358-1370. |
|
|
Wright S (1978). Variability Within and Among Natural Populations. In: Wright S, editor. Evolution and the Genetics of Population. University of Chicago Press, Chicago P 580. |
|
|
Yang X, Gao S, Xu S, Zhang Z, Prasanna BM, Li L, Li J, Yan J (2011). Characterization of a global germplasm collection and its potential utilization for analysis of complex quantitative traits in maize. Mol. Breed. 28:511-526. |
|
|
Yao Q, Yang K, Pan G, Rong T (2007). Genetic diversity of maize (Zea mays L.) landraces from southwest China based on SSR data. J. Genet. Genomics 34(9):851-860. |
|
|
Yeh FC, Yang R, Boyle T (1999). POPGENE Version 1.32. Microsoft windows-based freeware for population genetic analysis. University of Alberta, Centro for International Forestry Research, Edmonton. |
|
|
Yu Y, Wang R, Shi Y, Song Y, Wang T, Li Y (2007). Genetic diversity and structure of the core collection for maize inbred lines in china. Maydica 52:181-194. |
|
Copyright © 2024 Author(s) retain the copyright of this article.
This article is published under the terms of the Creative Commons Attribution License 4.0


