ABSTRACT
The assessment of genetic diversity among improved crop germplasm can facilitate the expansion of the genetic base for crop improvement in breeding program. However, little effort has been made to assess the level of genetic relatedness among released varieties and elite soybean [Glycine max (L.) Merr.] genotypes. The objective of this study was to determine the degree of genetic diversity that exists among released and elite soybean genotypes in Uganda. In this study, 21 polymorphic simple sequence repeat (SSR) molecular markers were used to determine the degree of genetic diversity and varietal identification among 34 soybean genotypes. A total of 59 alleles with an average of 2.85 alleles per locus were detected. The polymorphic information content (PIC) values ranged from 0.208 on BE806308 to 0.741 on Satt411, with an average of 0.5870. The expected heterozygosity varied from 0.208 on BE806308 to 0.725 on Satt411, with an average of 0.548 per marker. The dendrogram constructed based on Jaccard’s genetic similarities among 34 soybean genotypes identified three major clusters, with six of the released varieties belonging to cluster I. The majority of elite genotypes including three recently released cultivars; Maksoy 4N, Maksoy 5N and Maksoy 6N were grouped in cluster II and III. The results showed moderate genetic variation among the soybean genotypes, which could accelerate genetic vulnerability. Therefore, there is need to widen the genetic base of the working germplasm through the use of techniques such as pre-breeding and novel biotechnology techniques such as mutation breeding and CRISPR to create genetic variation necessary to cope with the dynamics of biotic and abiotic stresses that affect soybean production in Uganda.
Key words: Glycine max, genetic relationship, microsatellite or simple sequence repeat (SSR), molecular markers, genetic vulnerability.
Soybean [Glycine max (L.) Merr.] is a grain legume crop of great potential in Sub-Saharan Africa. It is an excellent source of protein and oil (approximately 40% protein and 20% oil content) for human food and animal feed (Ibanda et al., 2018). In Uganda and some other parts of Sub-Saharan Africa, soybean is increasingly becoming a popular food and cash crop (Tukamuhabwa et al., 2016). This is evidenced by the rapid increase in number of industries involved in processing soybean in the region for food in the last decade (Tukamuhabwa and Obua, 2015). Due to the high protein content, soybean flour is often used to competent cereal flours mainly sorghum and maize lacking essential amino acids to boost their nutritional value (Tukamuhabwa and Oloka, 2016). Despite the importance of soybean in Uganda, its production is very low in some parts of the country probably due to limited number of commercial varieties. The northern region of Uganda is the highest producer of soybean with mean dry grain yield of 1804 kg/ha while the west nile region reported the least mean yield of 247.1 kg/ha (Tukamuhabwa et al., 2016).
Soybean being a self-pollinated crop has narrow genetic base (Kumawat et al., 2015). In the recent past, the soybean breeding program in Uganda focused on targeted hybridization using few selected genotypes as parental lines such as Duiker, GC001, UG05 and MNG. This in consequence led to narrowing the genetic base of the Ugandan germplasm, increasing vulnerability to changes in biotic and abiotic stresses (Ssendege et al., 2015; Tukamuhabwa and Oloka, 2016). For instance, the released soybean varieties in Uganda are susceptible to groundnut leaf miner (Namara, 2015; Ibanda et al., 2018) and bruchids (Msiska et al., 2018).
Although the national soybean breeding program in Uganda has been actively involved in developing improved varieties to meet the ever-changing biotic and abiotic factors as well as needs of farmers and processors in the diverse environments of the country (Tukamuhabwa et al., 2012). The extent of genetic relatedness among newly developed elite material and released soybean varieties has not been fully understood. Therefore, the assessment of germplasm genetic diversity among available released varieties and elite genotypes is essential to ensure efficient selection and recommendation of diverse lines as parents, for advancement, commercialisation and designing future breeding efforts to improve soybean yield, quality and resistance to pest and diseases. The knowledge of genetic diversity in the available soybean genotypes could help the breeder to understand the structure of germplasm and predict which parental combinations would produce the best progeny and facilitate to increase the genetic variation of breeding material for selection. Furthermore, the candidate varieties should always possess some genetic distinctiveness from other commercial varieties. In addition, assessment of genetic diversity among the genotypes helps the breeder for variety protection (Bisen at al., 2015).
Several methods have been used to assess genetic diversity among different soybean accessions including the use of morphological and agronomic traits, isozymes, pedigree information and DNA markers (Chakraborty et al., 2018). However, the use of morphological and agronomic traits for assessing genetic diversity are highly affected by environmental factors, makes examination of distinctiveness difficult (Gupta and Manjaya, 2017; Chauhan et al., 2015; Ghosh et al., 2014; Chakraborty et al., 2018). In addition, the use of pedigree information is also affected by uncertain or incomplete data and possible errors in data capture (Oda et al., 2015). The limitation of data provided by the use of isozymes permits the use of DNA markers in genetic diversity studies (Chauhan et al., 2015). The use of DNA markers has been considered more informative, reliable and reproducible compared to the commonly used conventional methods like phenotypic descriptors and pedigree analysis (Chakraborty et al., 2018).
Among the different DNA markers are; Amplified Fragment Length Polymorphisms (AFLPs), Single Nucleotide Polymorphisms (SNPs), Restriction Fragment Length Polymorphisms (RFLPs), Microsatellites/ Simple Sequence Repeats (SSRs) and Randomly Amplified Polymorphic DNAs (RAPDs) have been widely used in studying genetic diversity in soybeans, each with its own merits and demerits (Khare et al., 2013; Chakraborty et al., 2018). For molecular characterization and genetic diversity studies in soybean, SSR markers have been considered as the molecular markers of choice because of their abundance, codominance, high reproducibility (Kujane et al., 2019; Koutu et al., 2019), high polymorphism compared to RFLPs, AFLPs and RAPDs (Kumawat et al., 2015; Chakraborty et al., 2018; Moniruzzaman et al., 2019) and have much greater ability to identify unique alleles in parental and elite soybean germplasm than any other markers (Tantasawat et al., 2011). Therefore, the objective of this study was to determine the level genetic diversity that exists among released and elite soybean genotypes in Uganda based on the SSRs molecular markers.
Plant materials
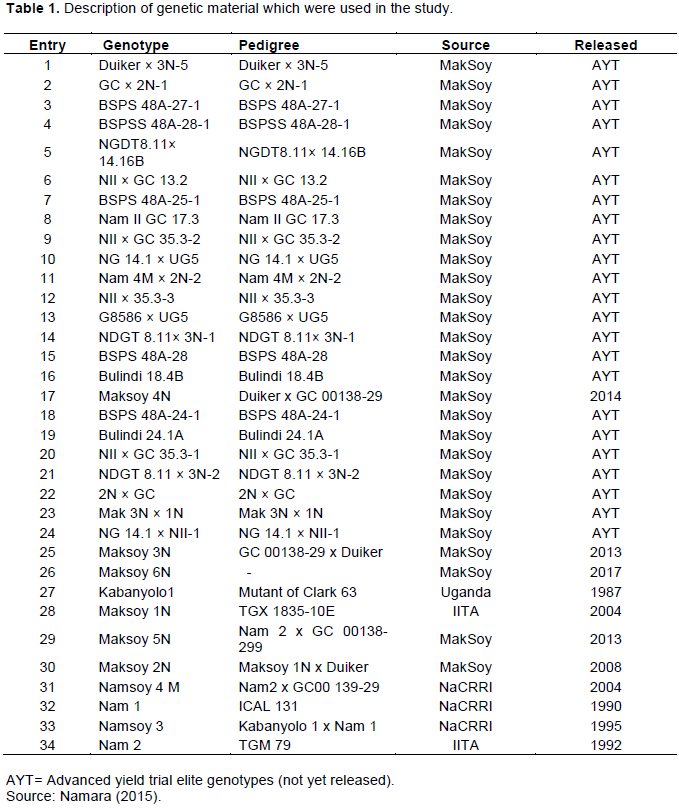
The study was carried out at Makerere University Agricultural Research Institute Kabanyolo (MUARIK) screen house and MaRCCI Biotechnology Laboratory. Thirty four genotypes were used in this study comprising of 23 elite genotypes and 11 released varieties (Table 1). These elite genotypes have desirable yield, percentage protein and oil content as well good agronomic traits for Uganda’s diverse agro-ecological zones.
DNA isolation and quantification
Total genomic DNA was extracted from two week old plants following the cytel trimethyl ammonium bromide (CTAB) method (Maughan et al. 1995). Prior to use, DNA quality and concentration were determined using NanoDrop ND-1000 spectrophotometer and the final concentration was adjusted to 50 ng/μl as described by Bisen et al. (2015).
Polymerase chain reaction
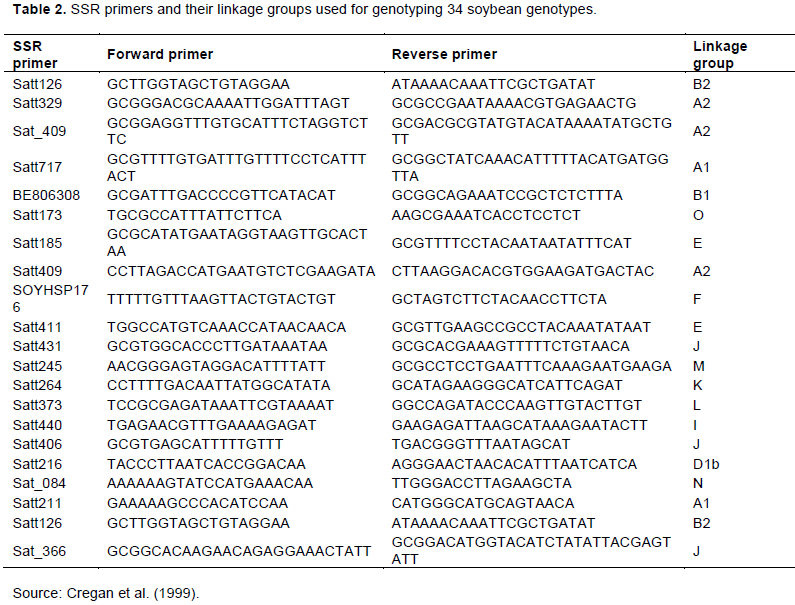
A total of 31 SSR markers that were previously mapped and evenly distributed on the 20 linkage groups by Cregan et al. (1999)were selected for initial screening. Gradient PCR was carried out for each primer with six randomly selected soybean DNA samples to standardize the annealing temperature for final amplification. Twenty-one SSR primers (Table 2) showed good amplification were used for further study across 34 soybean genotypes. Most of the SSR markers used had an AAT motif due to their abundance and highly polymorphic nature in soybean genome (Narvel et al., 2000). A PCR reaction volume of 12 μl comprising 2 μl genomic DNA (50 ng/μl), 5 μl of liquid premix, 4 μl of distilled water and 0.5 μl of each primer (10 nmol) was prepared. Amplification process was carried out in a thermocycler with the following conditions; Initial denaturation at 95°C for 5 min followed by 35 cycles of 95°C for 2 min, annealing temperature at 48 to 60°C for 50 s, extension at 72°C for 50 s and a final extension at 72°C for 7 min. The PCR products were fractionated by gel electrophoresis on 2% metaphor agarose gel stained with Gel RedTM Nucleic Acid Stain (10 μl /100 μl of 1X TAE buffer) run at 100 volts for 1 h along with a 100-bp ladder as a size standard. Gel images were taken using a Bio Doc-ItTM Imaging System.
Data scoring and analysis
The PCR products were analyzed by scoring the presence and absence of a band based on allele size for all 21 polymorphic primers. The SSR primer band appearing without ambiguity was scored as 1 (present) and 0 (absent) across 34 genotypes. Genetic diversity parameters, such as number of effective alleles, heterozygosity, fixation index, Shannon’s information index were estimated using GenAIEx 6.51 (Peakall and Smouse, 2012). DARwin 6.0.21 Perrier and Jacquemoud-Collet (2006) was used to determine genetic similarity among genotypes by estimating dissimilarity coefficients using Jaccard’s genetic similarity coefficient. The hierarchical cluster analysis was performed using dissimilarity coefficients with unweighted neighbor joining clustering algorithm. The effectiveness for cluster analysis was evaluated using 1000 bootstrapped (not displayed on Figure 1) replicates. The allelic diversity at each locus was determined as polymorphic information content (PIC) based on equation of Anderson et al. (1993):

Where, Pi is the frequency of ith allele in the set of genotypes analyzed, calculated for each SSR locus.
Furthermore, DARwin 6.0.21 was used to perform principal coordinate analysis (PCoA) to depict multiple dimensions of the distribution of released and elite genotypes in a scatter plot (Hipparagi et al., 2017) to complement the information obtained from hierarchical cluster analysis (Tantasawat et al., 2011).
Genetic diversity parameters
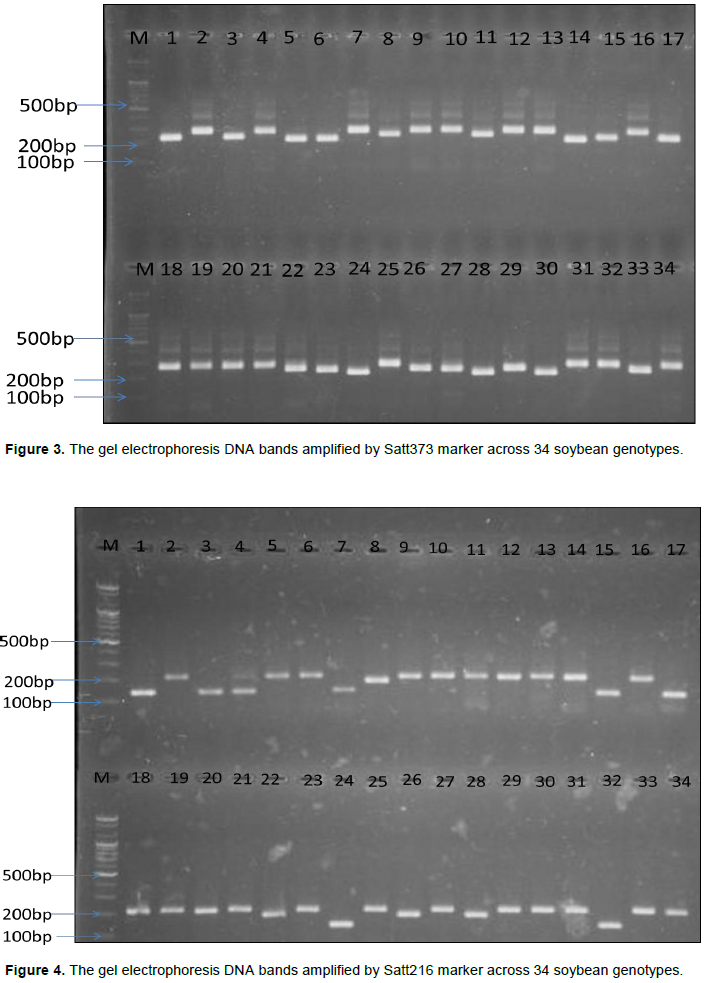
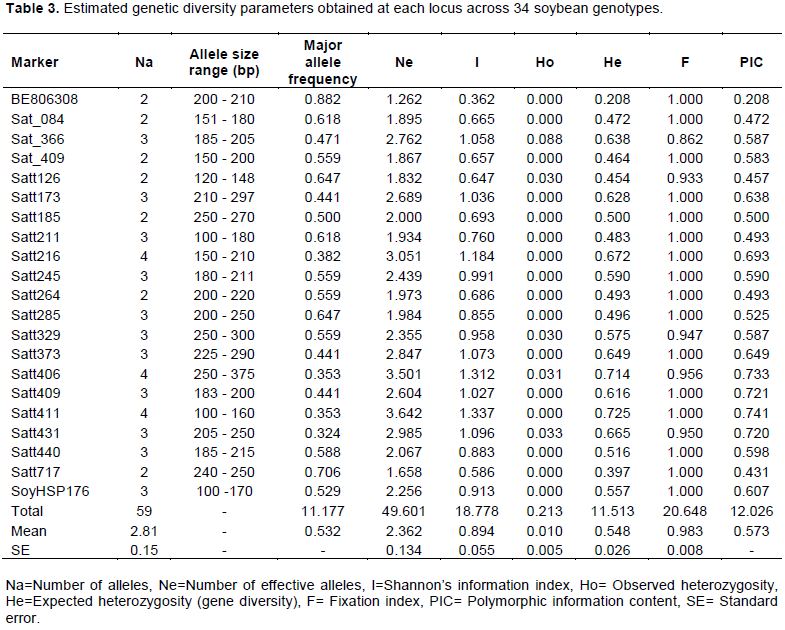
The results of expected genetic diversity parameters obtained at each locus across 34 soybean genotypes are presented in Table 3. A total of 59 alleles with an average of 2.85 alleles per locus were amplified among the genotypes. The fragment size of these 59 alleles varied from 100 to 375 bp with Satt406 recording the largest amplicon range (250 to 375 bp), while Satt411 had the smallest amplicon range of 100 to 160 bp. The number of alleles varied from 2 (Satt126, Sat_409, Satt717, BE806308, Satt185, Satt264 and Sat_084) to 4 (Satt216, Satt431 and Satt411) and the frequency of major allele ranged from 0.324 for primer Satt431 to 0.882 for BE806308 with an average of 0.532 among genotypes. The PIC value ranged from 0.208 (BE806308) to 0.741 (Satt411) with an average of 0.5870 and the number of effective alleles varied from 1.658 (Satt717) to 3.642 (Satt411) with an average of 2.362. Shannon’s information index ranged from 0.362 (BE806308) to 1.337 (Satt411) with an average of 0.894 across all the primers used. The observed heterozygosity varied from 0.000 to 0.088 with an average of 0.010, while the expected heterozygosity (gene diversity) ranged from 0.208 (BE806308) to 0.725 (Satt411), with an average of 0.548. Furthermore, the fixation index varied from 0.862 to 1.000 with an average of 0.983. Figure 3 and Figure 4 shows the gel electrophoresis DNA bands amplified by primers Satt373 and Satt216 across the 34 soybean genotypes; with genotype 1-17 on the upper lane, while the bottom lane for genotype 18-34 and M denotes the 100 bp DNA ladder.
Hierarchical cluster analysis
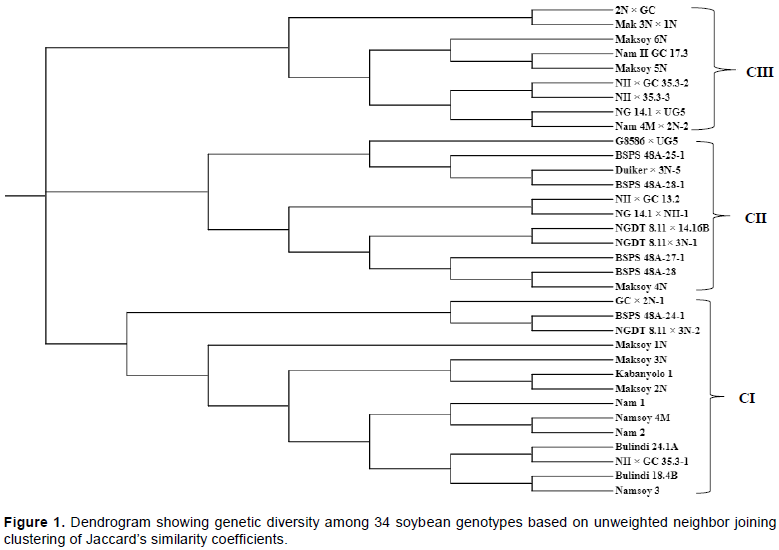
Hierarchical cluster analysis which showed the genetic relationship among the genotypes using a dendrogram constructed from genetic distance dissimilarity matrix (Figure 1). The results showed that all the 34 genotypes were grouped into three major clusters, CI, CII and CIII, with cluster I comprising of 14 genotypes, cluster II comprising of 11 genotypes and cluster III comprising of 9 genotypes, respectively. Cluster I was further partitioned into two distinct sub-clusters with 11 and 3 genotypes, respectively. The majority of released varieties by Makerere University Soybean Research Centre Kabanyolo (MakSoy) and National Crop Resources Research Institute (NaCRRI) soybean breeding program belonging to CI. Cluster II formed two distinct two sub-clusters with 7 and 4 genotypes respectively. Most of the elite genotypes fell in cluster II, with only one released variety Maksoy 4N. Cluster III also consisted of two sub-clusters with 7 and 2 genotypes, respectively, with genotypes from Makerere University Soybean Research Centre Kabanyolo and only with two recently released varieties Maksoy 6N and Maksoy 5N belonging to this category.
Principal coordinate analysis (PCoA)
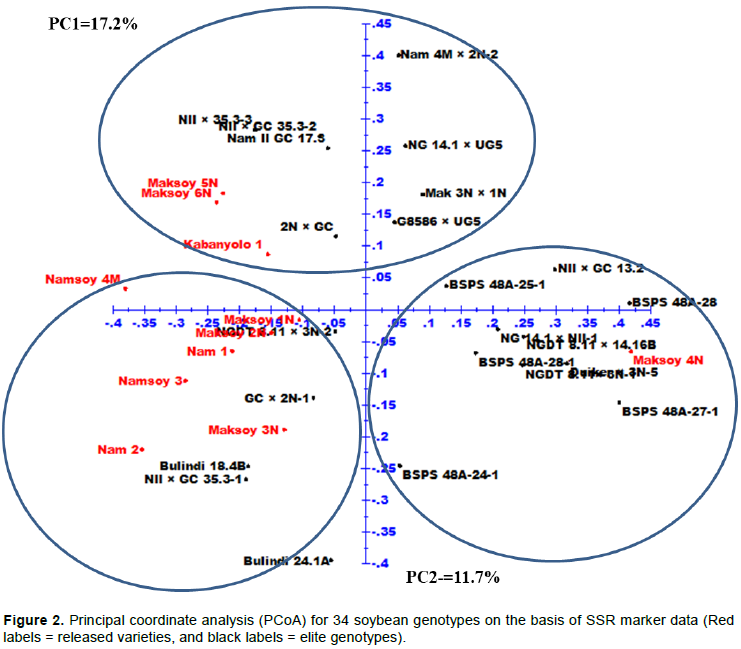
The results of the Principal Coordinate Analysis (PCoA) performed to further assess genetic relationship among released varieties and elite soybean genotypes showed three groups with PCoA explaining 28.9% of total variation (Figure 2). The first two axes discriminated the released varieties and elite soybean genotypes with PC1 and PC2 (the first and second principal coordinates) accounted for 17.2 and 11.7% of the total variation, respectively.
The reliability, reproducibility and authentic results obtained from using SSR markers have made them widely preferred in genetic diversity studies. Out of 31 SSR primer pairs screened, only 21 primer pairs, distributed on 15 of 20 linkage groups of soybean (Cregan et al., 1999), amplified scorable bands and a total of 59 alleles detected with a range of 2 (Satt126, Sat_409, Satt717, BE806308, Satt185, Satt264 and Sat_084) to 4 (Satt216, Satt431 and Satt411) alleles per locus. The lower allele number indicated low allelic diversity/ richness in the present set of soybean genotypes evaluated. Allelic richness (average number of alleles per locus) is an effective index for diversity evaluation but it is largely dependent on the sample size (Hipparagi et al., 2017), suggesting that to improve the allelic richness more genotypes need to be introduced into the breeding program to be able to enhance genetic diversity (Widaningsih et al., 2014). The number of alleles observed in this study is comparable to those reported by Kumawat et al. (2015)on 82 indigenous and exotic soybean accessions of different maturity groups and source in India where 2.9 alleles were detected per locus with an average polymorphic information content (PIC) value of 0.58. Similarly, Hipparagi et al. (2017)also reported 2.61 alleles with an average PIC value of 0.36 among 75 soybean genotypes assayed by 21 SSR markers in India. Bisen et al. (2015) detected 2.22 alleles per locus with an average PIC value of 0.199 using 16 SSR markers on 38 soybean varieties in active seed multiplication chain together with all varieties developed and released by JNKVV in India.
The average polymorphic information content (PIC) (a measure of the allelic diversity of SSRs) observed in this study was 0.573 which was consistent with previous studies (Widaningsih et al., 2014; Kumawat et al., 2015; Ghosh et al., 2014; Wang et al., 2010). A total of 20 markers excluding BE806308 had the PIC values greater than 0.4 indicating that these markers were highly informative for discriminating and distinguishing released varieties and elite genotypes, and these markers with high PIC values occurred on 14 separate linkage groups indicating that molecular polymorphism was spread across different regions of the genome (Song et al., 2010). The PIC was highest for the SSR primer Satt411
(0.741) and was lowest for the primer BE806308 (0.208) indicating that primer Satt411 was highly informative, effective and useful tool to determine the genetic differences among the released varieties and elite soybean genotypes and to study the phylogenetic relationship. Previous study by Kumawat et al. (2015) reported the PIC value of 0.50 for SSR primer Satt411 and 0.41 for primer BE806308 on genetic diversity analysis of 82 soybean accessions in India.
The gene diversity/expected heterozygosity (He) varied from 0.208 (BE806308) to 0.725 (Satt411) with an average of 0.548 which implied that there was moderate genetic variation existing among released varieties and elite genotypes. The presence of low - moderate genetic variation is not favorable in soybean breeding to mitigate dynamic pests, diseases and abiotic stresses that could not be handled by closely related cultivars. The moderate genetic variation observed among soybean genotypes in this study suggested the need for broadening genetic diversity through targeted hybridization of exotic germplasm with locally adapted elite germplasm. The gene diversity observed in the present study was lower than the previous studies reported by Widaningsih et al. (2014) (0.66); Song et al. (2013) (0.65); Zhao et al. (2018) (0.88)and Wang et al. (2015)(0.80) further indicating the need for introduction of more germplasm in the soybean breeding program.
The observed heterozygosity obtained from this study was 0.010. The reason for low heterozygosity is due to the fact that soybean is a highly self-pollinating crop which is expected to have low heterozygosity than mostly cross breeding crops (Zhang et al., 2013). Similar studies reported by Hipparagi et al. (2017) gave 0.11;and Zhao et al. (2018)reported 0.11 heterozygosity, so the heterozygosity observed in the present study was much lower than the value reported by the other researchers but some others studies reported low heterozygosity in the crop, for example Song et al. (2013)(0.045) and Li et al. (2008) (0.014). The Shannon’s information index of 0.894 in the present study was lower than the results obtained by Zhao et al. (2018) who reported Shannon’s information index of 2.528, but also reported fixation index of 0.987 which was comparable to the one obtained in this study. The results of Shannon’s information index and fixation index revealed a shift from Hardy-Weinberg equilibrium, again indicating the presence of moderate genetic variation among the genotypes which could be attributed to the fact that these genotypes are sharing GC001 and Duiker as common parental lines (Table 1).
The hierarchical clustering divided the soybean genotypes into three distinct groups, with more than half of the released varieties grouped together (cluster I) indicating that most released varieties were developed from common parents. The clustering of large number of released varieties together in a single cluster implies that most of the released varieties will lose stability as well as resistance in case of changes in pests, diseases and abiotic stresses. Similarly, Ssendege et al. (2015) reported that Maksoy 1N, Maksoy 2N and Maksoy 3N were grouped in the same cluster which indicated that they are genetically related. The findings of this study are supported by the pedigrees on Table 1, which shows that these released varieties shared the common parents such as Duiker and GC001. Cluster II and III comprised of 17 elite genotypes with only three released varieties, that is, Maksoy 4N, Maksoy 5N and Maksoy 6N. The results revealed that most released varieties are genetically dissimilar from the elite material. Cluster analysis depicted that elite materials can be utilized in the breeding program due to its genetic diversity and uniqueness from many of the released varieties. This is crucial in plant breeding as the only sustainable way of widening and maintaining genetic dissimilarity among genotypes. Also, candidate varieties, that is, elite material should possess some genetic distinctiveness from other commercial varieties for future variety protection as suggested by Bisen at al. (2015). Further, the clustering analysis in the present study helps the breeder in understanding the genetic structure of the breeding material for effective and efficient selection, advancement and crossings in future which must be carried out between the clusters and avoiding within the clusters as way of widening and maintaining genetic dissimilarity among genotypes. The results of both the dendrogram and Principal Coordinate analysis (PCoA) were consistent with each other in grouping 34 soybean genotypes into three distinct classes which implied that most of the released varieties were related. While moderate genetic diversity identified among released and elite soybean genotypes of Uganda in the present study necessitates the need of broadening genetic diversity by introducing more exotic diverse germplasm along with utilization of wild relatives. The diverse genotypes identified in this study may serve as source of new alleles in soybean breeding program of Uganda in order to cope with ever-changing outbreak of pests, diseases and abiotic stresses.
CONCLUSION AND RECOMMENDATIONS
There is moderate genetic variation among released and elite soybean genotypes of Uganda. The SSR marker Satt411 was highly informative and could be an effective and useful tool to determine the genetic differences among the soybean accessions and the phylogenetic relationship. As a long term breeding strategy, the Makerere Soybean Breeding program can consider the use of pre-breeding and other novel biotechnology techniques such as mutation breeding or CRISPR that are known to enhance genetic diversity.
The authors have not declared any conflict of interests.
This research was implemented with funding from Intra-ACP Academic mobility for Crop Scientists for Africa Agriculture (CSAA) project. Makerere University Soybean Improvement Centre provided the genetic material, MaRCCI provided laboratory facilities and RUFORUM provided partial financial support.
REFERENCES
|
Anderson JA, Churchill GG, Autrique JE, Tanksley SD, Sorrells ME (1993). Optimizing parental selection for genetic linkage maps. Genome 36(1):181-186.
Crossref
|
|
|
|
Bisen A, Khare D, Nair P, Tripathi N (2015). SSR analysis of 38 genotypes of soybean (Glycine max (L.) Merr.) genetic diversity in India. Physiology and Molecular Biology of Plants 21(1):109-115.
Crossref
|
|
|
|
|
Chakraborty S, Patel DA, Parmar H, Dhaduk HL, Sasidharan N (2018). Genetic diversity analysis in soybean (Glycine max (L.) Merrill.) using SSR markers. Journal of Pharmacognosy and Phytochemistry 7(3):2380-2384.
|
|
|
|
|
Chauhan DK, Bhat JA, Thakur AK, Kumari S, Hussain Z, Satyawathi CT (2015). Molecular characterization and genetic diversity assessment in soybean [Glycine max (L.) Merr.] varieties using SSR markers. Indian Journal of Biotechnology 504-510.
|
|
|
|
|
Cregan PB, Jarvik T, Bush AL, Shoemaker RC, Lark KG, Kahler AL, Specht JE (1999). An integrated genetic linkage map of the soybean genome. Crop Science 39:1464-1490.
Crossref
|
|
|
|
|
Ghosh J, Ghosh PD, Choudhury PR (2014). An assessment of genetic relatedness between soybean [Glycine max (L.) Merrill] cultivars using SSR markers. American Journal of Plant Sciences 05(20):3089-3096.
Crossref
|
|
|
|
|
Gupta SK, Manjaya JG (2017). Genetic diversity and population Structure of indian soybean [Glycine max (L.) Merrill.] revealed by simple sequence repeat markers. Journal of Crop Science and Biotechnology 10:221-222.
Crossref
|
|
|
|
|
Hipparagi Y, Singh R, Choudhury DR, Gupta V (2017). Genetic diversity and population structure analysis of Kala bhat (Glycine max (L.) Merrill) genotypes using SSR markers. Hereditas 154:9.
Crossref
|
|
|
|
|
Ibanda AP, Karungi J, Malinga GM, Adjumati G (2018). Influence of environment on soybean [Glycine max (L.) Merr.] resistance to groundnut leaf miner, [(Aproaerema modicella (Deventer)] in Uganda. Journal of Plant Breeding and Crop Science 10(12):336-346.
Crossref
|
|
|
|
|
Khare D, Bisen A, Nair P, Tripathi N (2013). Genetic diversity in soybean germplasm identified by RAPD markers. Asia-Pacific Journal of Molecular Biology and Biotechnology 21(3):114-120.
|
|
|
|
|
Koutu GK, Shrivastava A, Singh Y, Tiwari S (2019). Molecular characterization and genetic diversity assessment of soybean varieties using SSR markers. International Journal of Current Microbiology and Applied Science 8(04):173-182.
Crossref
|
|
|
|
|
Kujane K, Sedibe MM, Mofokeng A (2019). Genetic diversity analysis of soybean (Glycine max ( L .) Merrill.) genotypes making use of SSR markers. Australian Journal of Crop Science 13(07):1113-1119.
Crossref
|
|
|
|
|
Kumawat G, Singh G, Gireesh C, Shivakumar M (2015). Molecular characterization and genetic diversity analysis of soybean (Glycine max ( L.) Merrill.) germplasm accessions in India. Physiology and Molecular Biology 21(1):101-107.
Crossref
|
|
|
|
|
Li Y, Guan R, Liu Z, Ma Y, Wang L, Li L, Qiu L (2008). Genetic structure and diversity of cultivated soybean (Glycine max (L.) Merr.) landraces in China. Theoretical and Applied Genetics 117(6):857-871.
Crossref
|
|
|
|
|
Maughan PJ, Maroof MAS, Buss GR (1995). Microsatellite and amplified sequence length polymorphisms in cultivated and wild soybean. Genome 38(4):715-723.
Crossref
|
|
|
|
|
Moniruzzaman M, Saiem RM, Emon RM, Haque MS, Saha NR, Malek MA, Khatun K (2019). Genetic diversity analysis of soybean genotypes using SSR markers for salinity tolerance. Progressive Agriculture 3030(1):1-9.
Crossref
|
|
|
|
|
Msiska UM, Hailay MG, Miesho BW, Ibanda AP, Tukamuhabwa P, Kyamanywa S, Rubaihayo P (2018). Genetics of resistance in F2 soybean populations for adzuki bean bruchid (Callosobruchus chinensis). Journal of Agricultural Science 10(12):1916-9752.
Crossref
|
|
|
|
|
Namara M (2015). Resistance of soybean germplasm to the groundnut leaf miner (Aproaerema modicella) in Uganda. RUFORUM.
View
|
|
|
|
|
Narvel JM, Fehr WR, Chu W, Grant D, Shoemaker RC (2000). Simple sequence repeat diversity among soybean plant introductions and elite genotypes. American Crop Science 40:412-441.
Crossref
|
|
|
|
|
Oda MC, Sediyama T, Matsuo É, Cruz CD, Barros EG (2015). Phenotypic and molecular traits diversity in soybean launched in forty years of genetic breeding. Agronomy Science and Biotechnology 1(1):1-9.
Crossref
|
|
|
|
|
Peakall R, Smouse PE (2012). GenAIEx V5 : Genetic Analysis in Excel. Populations genetic software for teaching and research GenAlEx 6.5 : genetic analysis in Excel. Population genetic software for teaching and research. Oxford Jounals:Bioinformatics 28(19):2537-2539.
Crossref
|
|
|
|
|
Perrier X, Jacquemoud-Collet JP (2006). DARwin software
View
|
|
|
|
|
Song Q, Jia G, Grant D, Nelson RT (2010). Abundance of SSR motifs and development of Candidate Polymorphic SSR markers in Soybean. Crop Science 50:1950-1960.
Crossref
|
|
|
|
|
Song JY, Piao X, Choi Y, Lee G, Chung J, Lee J, Lee MC (2013). Evaluation of genetic diversity and comparison of biochemical traits of soybean (Glycine max L.) germplasm collections. Journal of Plant Breeding and Biotechnology 1(4):374-384.
Crossref
|
|
|
|
|
Ssendege G, Obua T, Kawuki R, Maphosa M, Tukamuhabwa TP (2015). Soybean genetic diversity and resistance to soybean rust disease in Uganda. Agricultural Journal 10(3-6):17-23.
|
|
|
|
|
Tantasawat P, Trongchuen J, Prajongjai T, Jenweerawat S, Chaowiset W (2011). SSR analysis of soybean (Glycine max (L.) Merr.) genetic relationship and variety identification in Thailand. Australian Journal of Crop Science 5(3):283-290.
|
|
|
|
|
Tukamuhabwa P, Assimwe M, Nabasirye M, Kabayi P, Maphosa M (2012). Genotype by environment interaction of advanced generation soybean lines for grain yield in Uganda. African Crop Science Journal 20(2):107-115.
|
|
|
|
|
Tukamuhabwa P, Obaa B, Obua T, Namara M, Okii D, Kabayi P (2016). Status of soybean production and impact indicators of new soybean varieties in Uganda 1-30.
|
|
|
|
|
Tukamuhabwa P, Obua T (2015). Soybean production guide in Uganda, Makerere University Agricultural Research Institute, Kabanyolo (MUARIK), Makerere University, Kampala.
|
|
|
|
|
Tukamuhabwa P, Oloka HK (2016). Soybean research and development in Uganda: A case of paradigm shift in an African University. Makerere University Agricultural Research Institute, Kabanyolo (MUARIK), Makerere University, Kampala.
|
|
|
|
|
Wang M, Run-zhi L, Wan-ming Y, Wei-jun D (2010). Assessing the genetic diversity of cultivars and wild soybeans using SSR markers. African Journal of Biotechnology 9(31):4857-4866.
|
|
|
|
|
Wang YH, Zhang XJ, Fan SJ (2015). Genetic diversity of wild soybean populations in Dongying, China, by simple sequence repeat analysis. Genetics and Molecular Research 14(3):11613-11623.
Crossref
|
|
|
|
|
Widaningsih NA, Purwanto E, Nandariyah N, Reflinur R (2014). The Use of DNA Microsatellite markers for genetic diversity identification of soybean (Glycine max (L) Merrill .) as a supplementary method in reference collections management. Indonesian Journal of Biotechnology 19(2):136-145.
Crossref
|
|
|
|
|
Zhang G, Xu S, Mao W, Hu Q, Gong Y (2013). Determination of the genetic diversity of vegetable soybean [Glycine max (L.) Merrill.] using EST-SSR markers. Biomedical and Biotechnology 14(4):279-288.
Crossref
|
|
|
|
|
Zhao H, Wang Y, Xing F, Liu X, Yuan C, Qi G, Dong Y (2018). The genetic diversity and geographic differentiation of the wild soybean [Glycine soja (L.) Merrill.] in Northeast China based on nuclear microsatellite variation. International Journal of Genomics 508:1-9.
Crossref
|
|