ABSTRACT
The study was carried out to assess genetic diversity among forty-one sorghum accessions obtained from Savanna Agricultural Research Institute (SARI), Nyankpala, Northern Region of Ghana and the germplasm collection of Department of Molecular Biology and Biotechnology, University of Cape Coast. Genetic diversity and relationship among the forty-one accessions were evaluated using 22 microsatellite primers. The 22 markers generated 92 alleles, with a mean of 4.2, indicating an average range of diversity. The average polymorphic information content (PIC) was 0.44, indicating that the microsatellites were informative. The cluster analysis grouped the 41 cultivars into seven distinct clusters. The most genetically distinct genotypes were Edipipii, Jibare and Belkozia, which did not cluster with any other line. The similarity between the sorghum accessions ranged from 77 to 100%. Observed heterozygosity ranged from 0 to 0.17 with an average of 0.03 per locus. Results of this study indicated that the landraces were related, and were probably exchanged between farmers in the collection regions, with some duplication found in the material, indicating that there must have been a common source of material somewhere in the history of the breeding programmes. Nonetheless, the Edipipii, Jibare and Belkozia could be exploited in breeding programmes to transfer desirable traits into elite Ghanaian sorghum cultivars.
Key words: Sorghum, simple sequence repeats (SSRs), genetic diversity, polymorphic information content (PIC).
Sorghum is one of the most important food and feed crops in the arid and semi-arid regions of the world (Sanchez et al., 2002), and especially the northern regions of Ghana. Grain sorghum is the fifth most planted cereal crop in the world and represents the only viable food grain for many of the world’s most food-insecure people (Zhihong et al., 2008). While the global population will increase from about seven to nine billion by 2050,
most of the increase will occur in sub-Saharan Africa, where population growth is among the highest in the world (Haub, 2013). This will increase the risk of food insecurity in sub-Saharan Africa (United Nations Development Programme (UNDP), 2012). Feeding more people with less water is a major challenge facing humanity (Foley et al., 2011), requiring crops that are highly adapted to dry environments.
Climate change can have a big impact on Africa’s food availability and security. A report by the IPCC (2014) indicates that, over the next 100 years, the average temperature in Africa will rise by 3 to 4°C resulting in the continent becoming generally drier than it is currently (Africa Harvest, 2007). Despite the threat of climate change and global warming leading to variable and drier climate, there is still no clear policy and government commitment for the development of sorghum, which can be used as a model for developing crops for a changing climate.
Analysis of genetic diversity in crops is important for crop improvement and provides essential information to enable more efficient use of available genetic resources (Mohammadi and Prasanna, 2003). Additionally, it is a platform for stratified sampling of breeding populations by grouping populations into subgroups with similar genetic characteristics (Mohammadi and Prasanna, 2003). Accurate assessment of the levels and patterns of diversity can be invaluable in the analysis of genetic variability in cultivars (Smith, 1984; Cox et al., 1986), identification of diverse parental combinations to create segregating progenies with maximum genetic variability for further selection (Barrett and Kidwell, 1998) and in introgressing desirable genes from diverse germplasm into the available genetic base (Thompson et al., 1998). Understanding of genetic relationships among inbred or pure lines can be useful for the planning of crosses, assigning lines to specific heterotic groups and for precise identification with respect to plant varietal protection (Mohammadi and Prasanna, 2003). Presently, there is an incomplete national core collection of sorghum germplasm and insufficient information on the genetic variability of sorghum varieties cultivated by farmers in Ghana. Limited genetic information is therefore available to establish the identity of these accessions in the national collection and develop a national core collection for sorghum. Studying the extent and structure of genetic diversity in germplasm accessions, through characterization, is essential for better understanding of the evolutionary trends, management of gene-banks and development of strategies for the collection and conservation of the germplasm. The use of molecular markers, particularly DNA-based polymorphisms, which detect variation at the DNA sequence level (Smith and Smith, 1992), has become an increasingly useful and powerful tool in the assessment of genetic similarity and manipulation of important agronomic traits in breeding stocks (Lee, 1995). For any effective breeding and selection programme, there is the need to assess the support breeding programmes with exotic genetic resources or not. Therefore, this study sought to assess the genetic diversity of Ghanaian and Malian sorghum germplasm using SSR markers in order to provide information necessary to improve the current accessions through breeding and selection for desirable characteristics.
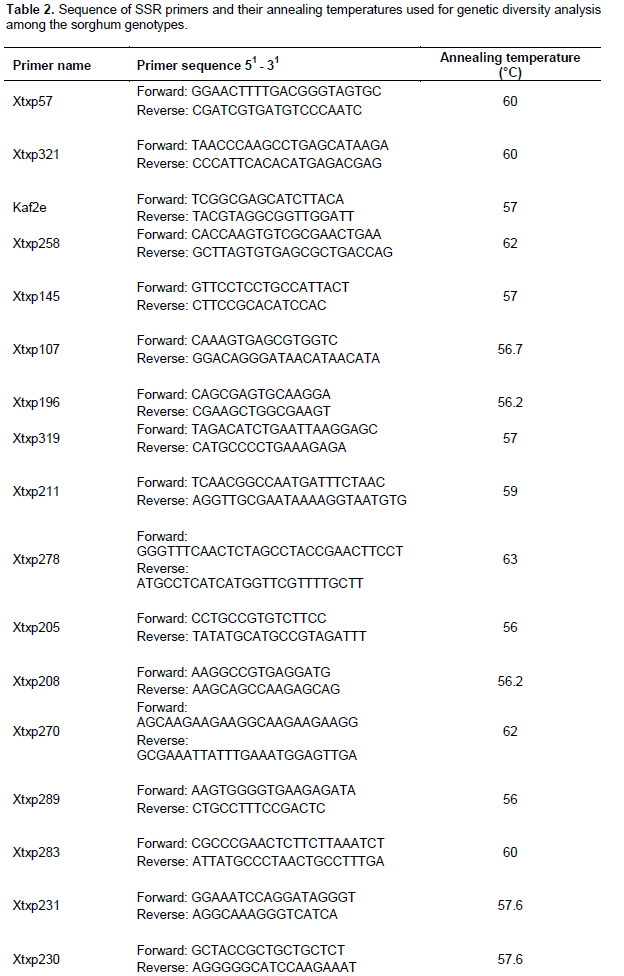
Sorghum seeds were obtained from the Department of Molecular Biology and Biotechnology of the School of Biological Sciences, College of Agriculture and Natural Sciences, University of Cape Coast. Seeds of 7 cultivars (Dorado, Kapaala, Kadaga, Naga White, Bawku Red, GO-1 and GO-2), originally obtained by the Department from the Savannah Agricultural Research Institute (SARI), Manga Station in Bawku, were used. Seeds of 34 sorghum accessions were also obtained from the sorghum germplasm collection currently held at the Savanna Agriculture Research Institute (SARI) - Nyankpala in the Northern Region of Ghana, making a total of 41 sorghum accessions. Passport data for these accessions were recorded (Table 1). These cultivars were selected because they had 90 to 100% germination rates and are cultivated in the semi-arid regions of Africa.
DNA extraction
The sorghum seedlings were germinated in Petri-dishes lined with moistened Whatman No.1 filter papers and incubated at 30°C. After germination, the young shoots were harvested and stored at -20°C for DNA extraction. DNA was extracted using the ZR Plant/Seed DNA MiniPrepTM Extraction Kit D6020 (ZYMO RESEARCH CORP.; IRVINE, CA-USA) using manufacturer’s protocol.
Polymerase chain reaction (PCR) amplification of SSRs
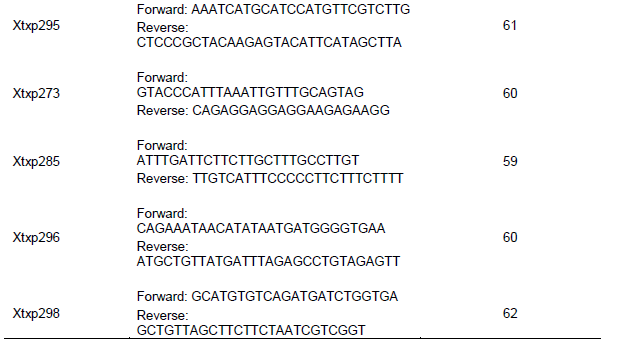
Twenty-five pairs of SSR primers were procured from Inqaba Biotechnical Industries (Pty) Ltd. The primer pairs chosen have been used in other sorghum genetic diversity studies (Ali et al., 2008; Pei et al., 2010). Of these, 22 displayed polymorphism in a preliminary study and these were used for genetic diversity analysis (Table 2). Details of the primer sequences and type of microsatellite repeats are publicly available (http://sorgblast2.tamu.edu/SorghumGenome/ Mapping/Markers/SSR.html#217). PCR reactions were conducted in a TECHNE TC 512 PCR System in 25 ml reaction mixtures in 96-well plates. The mixture contained 12.5 ml One Taq Quick-Load 2x Master Mix with Standard Buffer (NEW ENGLAND BIOLABS) comprising 20mM Tris-HCl (pH 8.9 at 25°C), 1.8 mM MgCl2, 22 mM NH4Cl, 22 mM KCl, 0.2 mM dNTPs, 5% glycerol, 0.06% IGEPAL*CA-630 (Rhodia Operations), 0.05% Tween*20 (Uniqema Ameracas LLC), Xylene Cyanol FF, Tartrazine, 25 units/ml One Taq DNA Polymerase; and 0.5 ml of the 10 mM Forward Primer, 0.5 ml of the 10 mM Reverse Primer, 10.5 ml Nuclease-Free water and 1 ml genomic DNA. The PCR programme consisted of an initial denaturation for 30 s (s) at 94°C and then 30 cycles of denaturation for 30 s at 94°C, annealing at 57°C (55 or 60°C) for 60 s, depending on the annealing temperature for the primer, and extension at 72°C for 60 s. The last PCR cycle was followed by a 5 min extension at 72°C and then put on hold at 10°C, at infinity (∞). The amplified products were stored at -20°C until they were needed to run gels (Table 2).
Gel electrophoresis of PCR products
Gel electrophoresis was run using a 2.5% agarose gel. The gel contained 6.25 g of agarose, weighed using a Mettler Toledo Electronic Balance (PG-203), dissolved in 250 ml TAE in a conical flask (volume of flask is required) and the mouth covered with cotton wool. The mixture was then heated in a microwave (Panasonic NN-SM322M) to dissolve finally and allowed to cool to about 60°C and 5 µl of ethidium bromide added. This was swirled gently to avoid bubbling and when cooled, the solution was poured into a mould with comb placed on a level surface and allowed to cool and solidify. The comb was gently removed and the gel was transferred into an electrophoretic tank (BIO RAD Mini-Sub® Cell GT) filled with 1X TAE buffer. PCR products of 10 µl were loaded into each well and run at 90 V for 45 min. The gel was then observed under an UV transilluminator (model M-15, UVP Inc., USA) and photomicrographs processed and printed using a Canon IXUS camera.
Analysis of PCR products
Scoring of SSR bands
Bands on the processed contact film or scanned images were used for scoring the size of SSR bands obtained. For each gel, the distance travelled by each marker size of the DNA ladder was measured. The size of the DNA fragments was determined relative to the size standard from the Quick-Load® 50 bp DNA Ladder (NEW ENGLAND BioLabs® Inc.). Allelic data for each locus was recorded as fragment size in comparison with a standard 50 bp DNA ladder and also as binary data coded as 1 or 0 for the presence or absence for each allele.
Analysis of data, genotyping and determination of genetic diversity
Bands for the same SSR locus with different molecular weights were scored as alleles. Alleles for each SSR locus were scored for each sorghum line. Where an allele was present it was scored as one (1) and zero (0) when absent. The binary data matrix generated from this scoring was used to calculate a similarity matrix using the Nei and Lei (1979) coefficient. Cluster analysis was conducted using the Unweighted Paired Group Method using Arithmetic Averages (UPGMA) as defined by Sneath and Sokal (1973) to produce dendrograms of genetic similarities using the Numerical Taxonomy and Multivariate Analysis System software (NTSTSpc) version 2.1 (Exeter Software, New York) and Paleontological Statistics software.
Genetic diversity for each marker was calculated according to the following equation of Nei (1973):
Genetic diversity = 1- SPij2,
Where; Pij is the frequency of jth allele for the ith locus summed across all the alleles of the locus. Calculated in this manner, the genetic diversity is synonymous with the term polymorphic information content (PIC) described by Anderson et al. (1993).
Performance of SSRs markers
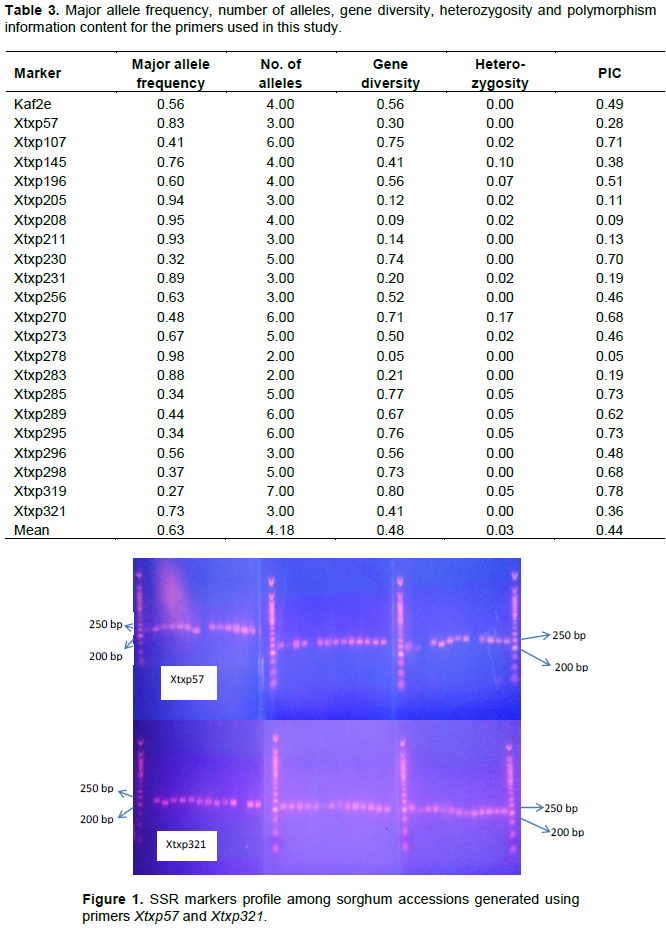
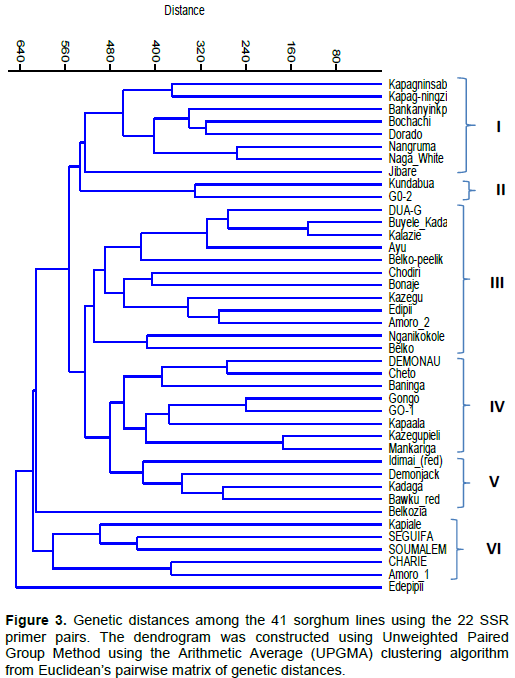
The major allele frequency, number of alleles produced, gene diversity, heterozygosity and the PIC values of the 22 SSR loci examined are presented in Table 3. Samples of DNA profile generated by two of the primers, Xtxp57 and Xtxp321 are shown in Figure 1.
A total of 92 alleles were detected among the 41 genotypes. The number of alleles per locus ranged from 2 (Xtxp278 and Xtxp283) to 7 (Xtxp319) and the mean number of alleles was 4.2. The observed heterozygosity (Ho) ranged from 0.0 (Xtxp57, Xtxp321, Xtxp256, Xtxp211, Xtxp278, Xtxp283, Xtxp230, Xtxp296, Xtxp298 and Kaf2e) to 0.17 (Xtxp270), with an average of 0.03 per locus. Seven loci (Xtxp145, Xtxp196, Xtxp319, Xtxp270, Xtxp289, Xtxp295, and Xtxp285) had observed heterozygosity values at each locus across all accessions higher than the average.
The PIC values for the microsatellite loci ranged from 0.05 (Xtxp278) to 0.78 (Xtxp319) with a mean of 0.45 (Table 3). Based on their individual PIC values, seven of the primer pairs were moderately informative (0.25<PIC<0.5), while nine primer pairs were highly informative (PIC>0.5). Even though the mean number of alleles per locus detected in the 41 sorghum accessions was 4.2, the average PIC value of 0.45 gave an indication that the microsatellite markers were informative (Table 3). Xtxp319 had the lowest major allele frequency (0.27) and Xtxp278 had the highest (0.98) with a mean of 0.63.
Genetic diversity among the 41 sorghum genotypes
were used to evaluate genetic diversity in the 41 sorghum lines. Genetic relationships between the lines studied, based on the cluster analysis, are presented in a dendrogram (Figure 2). The set of markers used was able to uniquely classify the 41 lines into seven distinct groups, indicating that genetic diversity existed among them. The most genetically distinct genotypes were ‘Edepipii’, ‘Jibare’ and ‘Belkozia’, which did not cluster with any other line.
The largest group consisted of 19 genotypes in cluster five with ‘Demonau’ and ‘GO-1’ at one end and ‘Amoro_2’ at the other (Figure 2). This group was subdivided into five, but there was minimal diversity between these lines with the first subgroup containing ‘Kazegupiele’ and ‘Mankariga’ with coefficient of 1 showing close similarity among them. ‘Cheto’ also clustered with ‘Kazegupiele’ and ‘Mankariga’ at 0.88 coefficient of similarity. The other members in the group are ‘Demonau’ and ‘GO-1’, which clustered at a similarity coefficient of 0.95, quite similar to each other.

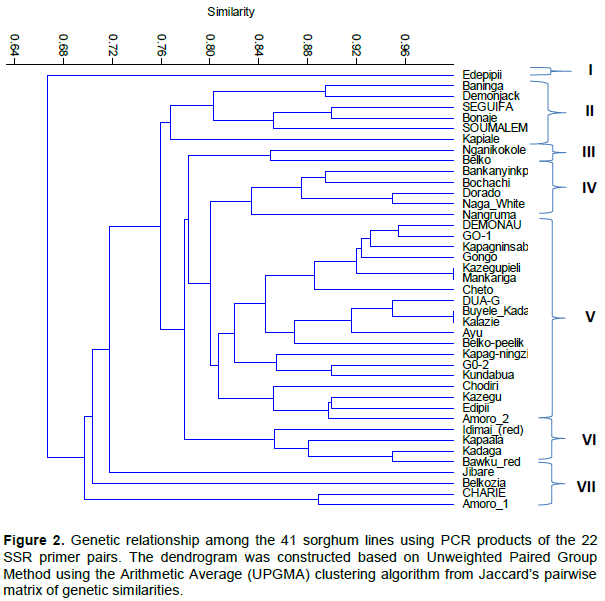
The rest in the group were ‘Kapagninsablini’ and‘Gongo’, which also clustered with ‘Demonau’ and ‘GO-1’. The second sub-group was‘ Buyele_Kadapale’ and ‘Kalazie’, which had a coefficient of 1 showing close relatedness between the two accessions. ‘Dua-G’ clustered with ‘Buyele_Kadapale’ and ‘Kalazie’ at coefficient of 0.95. ‘Ayu’ also clustered with ‘Buyele_Kadapale’, ‘Kalazie’ and ‘Dua-G’. ‘Belko-peelik’ then clustered with ‘Ayu’, ‘Buyele_Kadapale’, ‘Kalazie’ and ‘Dua-G’ at similarity coefficient of 0.86. The third sub-group had ‘GO-2’ and ‘Kundabua’, which were 90% similar and also clustered with ‘Kapagninzie’ at similarity coefficient of 0.85. The fourth sub-group contained ‘Chodiri’, ‘Kazegu’, ‘Edipii’ and ‘Amoro-2’. ‘Edipii’ and‘Kazegu’ were also 90% similar, indicating they are closely related genotypes. The first group contained only one accession ‘Edepipii’, which was least, related to the other genotypes at similarity coefficient value of 0.67. The second group included ‘Baninga’ at one end and ‘Kapiale’ at the other end. Furthermore, a high level of genetic similarity of 0.89 and 0.9 was observed for ‘Baninga’ and ‘Demonjack’ (0.89) and also for ‘Seguifa’ and ‘Bonaje’ (0.90). ‘Soumalemba’ was 85% similar to ‘Baninga’ and ‘Demonjack’. The third group had only two genotypes, ‘Nganikokole’ and ‘Belko’, which were also 85% similar. The fourth group had three genotypes comprising ‘Dorado’, ‘Naga White’ and ‘Nangruma’. ‘Dorado’ and ‘Naga White’ were 0.94 similar. Group six consisted of 4 genotypes, namely ‘Idimai Red’, ‘Kapaala’, ‘Kadaga’ and ‘Bawku Red’, which were closely similar. ‘Kadaga’ and ‘Bawku Red’ differed by just 5% while ‘Kapaala’ was 12% dissimilar to ‘Kadaga’ and ‘Bawku Red’. ‘Idimai Red’ was 85% similar to ‘Kapaala’, ‘Kadaga’ and ‘Bawku Red’. In group seven, ‘Charie’ and ‘Amoro 1’ were clustered together with a coefficient similarity of 0.88 and both of them mature late, while the other two genotypes, ‘Jibare’ and ‘Belkozia’, were remotely related, showing distinct genetic characteristics compared to the rest of the group seven genotypes (Figure 2).
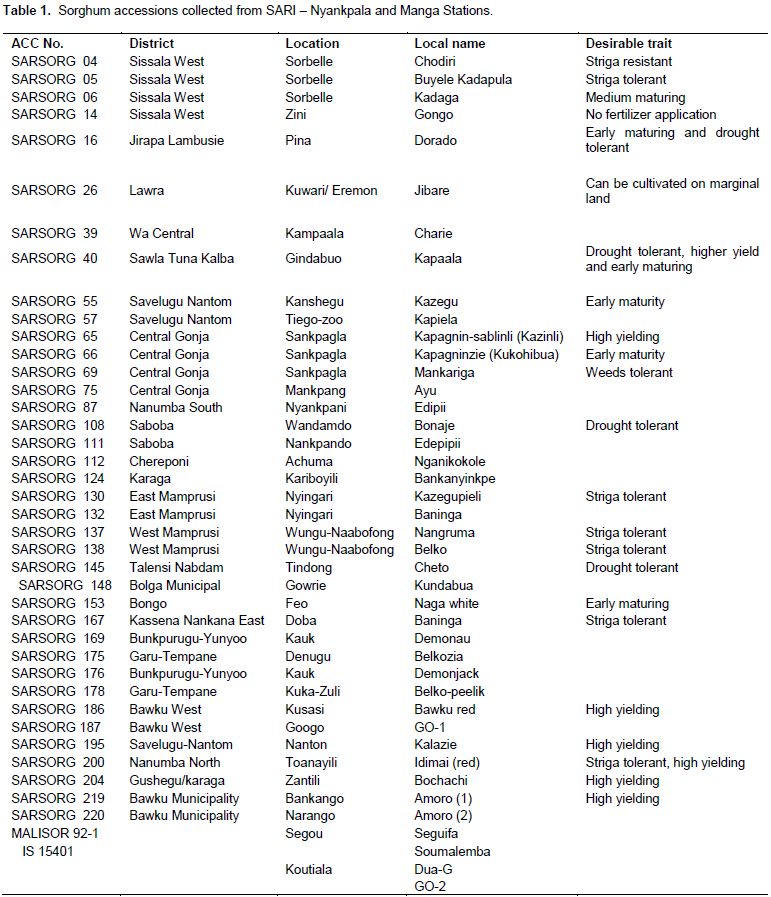
Genetic distance (GD
Euclidean distances of 150 to 650 were observed in the pair-wise combinations, indicating that the cultivars were diverse for the genotypic characters measured, while the cophenetic correlation coefficient (CCC) was 0.64. The minimum genetic distance of 150 was recorded between cultivars ‘Buyele_Kadapula’ and ‘Kalazie’. The highest genetic distance of 650 was recorded between cultivar ‘Edepipii’ and the rest of the cultivars, indicating that this line was different from the other cultivars (Figure 3).
The dendrogram grouped the 41 sorghum lines into six main clusters and two singletons. The first main cluster was formed between a genetic distance of 250 and 520, and these included the cultivars ‘Kapagninsablinli’, ‘Kapag-ningzie’, ‘Bankanyinkpe’, ‘Bochachi’, ‘Dorado’, ‘Nangruma’, ‘Naga White’ and ‘Jibare’ (Figure 3).
Cultivar ‘Edepipii’ was remotely related to the rest at a genetic distance of 640 followed by ‘Belkozia’ at 610 and ‘Jibare’ at a genetic distance of 520. Both ‘Nangruma’ and ‘Naga White’ were associated at a genetic distance of 250 while ‘Kapagninsablinli’ and ‘Kapag-ningzie’ were associated at a distance of 360. ‘Bochachi’ and ‘Dorado’ clustered at a genetic distance of 300. The second cluster was formed at a genetic distance of 330 and comprised of only cultivars ‘Kundabua’ and ‘GO-2’. The third cluster was the largest group with twelve genotypes with a genetic distance of 150 between ‘Kalazie’ and ‘Buyele_Kadapula’, the most closely related lines followed by ‘Edipii’ and ‘Amoro_2’ with a distance of 280.
‘Nganinkokole’ and ‘Belko’ were separated from the rest by a genetic distance of 420 indicating genetic dissimilarity with the rest of the cultivars in the cluster. ‘Chodiri’ and ‘Bonaje’ were related at a genetic distance of 410.
The other members of this cluster were ‘Dua-G’, ‘Ayu’, ‘Belko peelik’ and ‘Kazegu’. The fourth cluster consisted of eight cultivars with ‘Demonau’ at one end and ‘Mankariga’ at the other end. ‘Kazegupieli’ and ‘Mankariga’, the most closely related in this group, were associated at distance of 180 while ‘Gongo’ and ‘GO-1’ were at a distance of 240 (Figure 3). ‘Demonau’ and ‘Cheto’ also were related at a genetic distance of 260. Other members in this group included ‘Baninga’ and ‘Kapaala’. The fifth cluster consisted of four cultivars, with ‘Kadaga’ and ‘Bawku Red’ at a distance of 280, while ‘Idimai Red’ and ‘Demonjack’ were at distances of 420 and 360, respectively. Cultivars ‘Belkozia’ and ‘Edepipii’ did not cluster with any of the other 41 lines but stood distinctly individually, indicating that they were genotypically dissimilar from the other sorghum lines. The sixth cluster consisted of five cultivars (‘Charie’, ‘Amoro 1’, ‘Seguifa’, ‘Soumalemba’ and ‘Kapiale’) with varied genetic distances (380 to 510) between them (Figure 3).
Analysis of the extent and distribution of genetic variation in a crop is essential in understanding the evolutionary relationships between accessions and sampling genetic resources in a more systematic fashion for breeding and conservation purposes (Ejeta et al., 2000). Menkir et al., (1997) have argued that molecular markers, in particular genetic distance estimates determined by molecular markers, are suitable for assessing genetic diversity and identifying diverse sources in crop germplasm collections. The SSR markers used in this study revealed a wide variation between the 41 genotypes evaluated. Interestingly, the stay-green sources were very variable based on the dendrogram from SSRs associated with the stay-green trait in DO and KP (Figure 2). This agrees with the theory that different sources of stay-green can be under different genetic control (Thomas and Smart, 1993).
The amplification of 22 microsatellite loci in the 41 sorghum accessions in this study revealed that all the loci were polymorphic with a total of 92 alleles (Table 3). The number of alleles per locus ranged from 2 (Xtxp278 and
Xtxp283) to 7 (Xtxp319) and averaged 4.2 alleles. Galyuon et al. (2016) assessed 66 SSR loci in 28 sorghum accessions and detected 419 alleles with a mean of 6.2 alleles per locus. In their study, the number of alleles ranged from 1 for Xtxp94 to 14 for Xtx88. One of the reasons for variation in number of alleles obtained per locus could be due to differences in number of mutations per locus since mutation rates tend to be locus specific (Estoup et al., 2002). Similar SSR polymorphic levels and ranges of fragment size of alleles have been reported from earlier studies (Brown et al., 1996; Shehzad et al., 2009).
The expected heterozygosity (He) of cultivated sorghum found in this work across the 22 SSR loci (He = 0.03, N = 41) was much lower than that found for cultivate sorghum in Kenya (He = 0.59, N = 439) across 24 microsatellites (Mutegi et al., 2011) and Niger (He = 0.61, N = 472) across 28 microsatellites (Deu et al., 2008), and again lower than that found in Burkina Faso (He = 0.37, N = 124) across 29 microsatellites (Barro-Kondombo et al., 2010). The explanation put forward by Barro-Kondombo et al., (2010) for the low level of diversity found in Burkina Faso, compared with other studies, is the low amount of sorghum landrace or racial diversity present in Burkina Faso. The amount of heterozygosity across loci, which is synonymous with allelic variation, indicates the amount of genetic variability, which has a bearing on the survival of a species and allows organisms to adapt to changing environments provided that some loci have adaptive values (Ng’uni et al., 2011). In the current study, the observed heterozygosity ranged from 0 to 0.17 with an average of 0.03 for the sorghum accessions. The low level of observed heterozygosity maybe more attributable to the predominantly inbreeding nature of sorghum other than samples size used. Indeed, when a bottleneck occurs in a population, allelic diversity is reduced faster than is heterozygosity (Nei et al., 1975), which is a result of loss of rare alleles from the population contributing little to the overall heterozygosity (Muraya et al., 2010). Sorghum is a self-pollinating crop, although a wide range of outcrossing rates of 7-30% or higher have been reported (Dje et al., 2004; Barnaud et al., 2008). Cleistogamy (flowers remain enclosed) in sorghum due to very long glumes prevent pollen movement and thus strongly promoting selfing (Barnaud et al., 2008). The predominantly selfing nature of the species explains the observed lower genetic variation within than among accessions in this study. Low levels of genetic variation among self-pollinated plants are attributed to limited movement of genes via pollen, which also results in greater differentiation among populations (Hamrick, 1983). The other plausible reason may be that farmers obtain seed from the same sources or exchange seed for planting. In such situation, the genetic base becomes narrow, hence low heterozygosity.Gene diversity varied from 0.05 (Xtxp278) to 0.8 (Xtxp319) with an overall mean of 0.48. A number of factors, such as agronomic, economic and cultural practices in the traditional farming systems, have been reported to impact on levels of genetic diversity in sorghum (Chakauya et al., 2006; Mutegi et al., 2011). Following the plant domestication stage, artificial selection has been identified as one of the factors contributing to the reduced genetic diversity of crops (Gepts, 2004). In most cases, traditional farmers maintain more than one distinct local variety selected for particular characteristics of interest to them and specific use. These landraces are perpetuated as farmer varieties from generation to generation. The driving forces behind the practice of maintenance of two or more sorghum landraces per household involve the farmers selecting landraces that could cope with local environmental factors such as duration of rainy season. Therefore, early maturing local varieties are usually planted by most households to provide food early in the season and thus ensuring attainment of household food security.
The lowest genetic similarity (0.85) (Figure 2) was obtained between cultivars Nganikokole and Belko in this study. Agrama and Tuinstra (2003) have found a genetic similarity value of 0.44 among 22 sorghum genotypes, using SSR markers, which is lower than the values obtained in the current study. Selection of the parents, based on genetic distance information, could provide a basis for choosing parents for crossing programmes (Zhong-hu, 1991). High correlation between and among characters may show that the characters share some common genetic and geographical information (Thorpe, 1976; Ayana and Bekele, 2000) as well as pleiotropic and linkage of genes governing the traits. Ayana (2001) reports that correlations among characters are of interest to plant breeders because they help in the identification of easily measured characters that could be used as indicators of more important (but more complex to score) characters. They are also useful in selection of desirable traits (Amurrio et al., 1992; Ayana and Bekele, 2000). Chozin (2007) has argued that evaluation of the patternof variation and genetic relationship among breeding material can facilitate precise identification of genetic divergence and reliable classification of specific heterotic groups, which will be particularly useful in planning crosses.
In this study, the major allele frequency was between 0.27 (Xtxp319) and 0.98 (Xtxp278) with a mean of 0.63 (Table 3). The distance in gene frequency between parental genotypes is important because the higher the difference in gene frequency, the higher the amount of heterosis which indicates larger the distances lead to larger heterosis and vice-versa (Carrera et al., 1996). Genetic distances among progeny confirm their origin and the genetic relationships between them and their parents (Carrera et al., 1996). Efficient identification and selection of the desirable genotypes largely depend on a comprehensive understanding of the genetic relatedness and variation present within the crop and its closely related wild species (Muench et al., 1991; Kearsey, 1993). Information concerning genetic relatedness is crucial, for it indicates the rate of adaptive evolution and the extent of response in crop improvement (Vega, 1993). Furthermore, it is essential as a guideline in the choice of parents for breeding programmes (McNaught, 1988; Loarce et al., 1996), to detect the genetic duplicates in germplasm collections and implementing an effective genetic conservation programme (Frankel and Brown, 1984; Muench et al., 1991).
Cluster analysis of the 41 accessions, based on the Jaccard similarity coefficient, revealed Buyele Kadapale and Kalazie were the most closely related accessions. Similarly, accessions Kazegupiele and Mankanga were highly similar. The other accessions, such as Nganikokole, Belko Edipipii, Jibare and Belkozia, were clearly distinct from the rest. The clustering of accessions based on their genetic similarity in this study has indicated that some could be employed as parental lines for breeding and selection programmes for superior hybrids (Jeya Prakash et al., 2006). Indeed, SSR-based analysis of 40 sorghum landraces from Tanzania based on their area of collection sites and pedigree of relationships was able to reveal variation and diversity among landraces Bucheyeki et al. (2009). According to Barnaud et al. (2008), Bucheyeki et al. (2009) and Muray et al. (2010), gene flow plays a large role in structuring the genetic variability within and among sorghum populations. Manzelli et al. (2007) similarly have reported continuous exchanges of genes between sorghum population results in genetic diversity. SSR markers have been used to group sorghum genotypes based on their geographical origin (Abu Assar et al., 2005; Vittal et al., 2010). In this study, however, clustering did not always follow the sorghum race classification (or country of origin) particularly as a number of the advanced breeding lines examined have more than one race in their genetic background. This has also been found in other genetic diversity studies in sorghum (Kebede, 1991; Ayana and
Bekele, 2000; Menz et al., 2004; Chozin, 2007; Bucheyekei et al., 2009). In earlier studies Taramino et al., (1997), Smith et al. (2000), Uptmoor et al. (2003) and Menz et al. (2004) comparisons were made between R-lines and B-lines or were based on region of origin. The current study was not based on any of these classifications; however, clusters were not always made up of only lines from the same region or race. For example, Seguifa (Mali, Sahelian) and Baninga (Ghana, Guineans) from different geographical regions or races belonged to the same cluster. Similarly, Dua-G (Mali, North Guinean) and Kalazie (Ghana, Caudatum) also belonged to same cluster, while Dua-G and Soumalemba did not cluster together even though both originated from Mali.
Genetic diversity is influenced by gene flow, which encompasses several mechanisms of gene exchange among populations, including movement of gametes, seed, individuals or groups of individuals from one place
to another (Slatkin, 1987). The high genetic similarity observed in the current study could result from seed exchange practices between communities as this is usual practice with peasant farmers in Ghana.
Overall, the studied sorghum accessions showed significant genetic variations, indicating that the accessions could be employed in the development of new genotypes of desired traits through breeding and selection programmes.
The 22 SSR loci generated 92 alleles with a mean of 4.2 and were able to group the 41 sorghum cultivars into seven clusters. Edepipii was the most divergent compared to the other cultivars. The most genetically distinct varieties were Edepipii, Jibare and Belkozia, which did not cluster with any other line, indicating no similarity among these varieties and could be employed as parental lines for breeding and selection programmes for superior hybrids. The mean gene diversity (0.48), heterozygosity (0.03), PIC (0.44) and mean number of alleles (4.2) suggest that the genetic base of local sorghum germplasm is narrow and there may be the need to introduce exotic cultivars to increase the genetic base. This notwithstanding, there is the potential to use the sorghum cultivars in Ghana and Mali to breed and select for more resilient and high yielding hybrids, which could be used to improve yields and economic gains of peasant farmers in northern Ghana.
The authors have not declared any conflict of interests.
REFERENCES
|
Abu Assar AH, Uptmoor R, Abdelmula AA, Salih M, Ordon F, Friedt W (2005). Genetic variation in sorghum germplasm from Sudan, ICRISAT, and USA assembled by simple sequence repeats (SSRs). Crop Science 45(4):1636-1644.
|
|
|
|
Africa Harvest (2007). The African Biofortified Sorghum Project: midterm report. Nairobi: Africa Harvest Biotech Foundation International (AHBFI), p. 40.
|
|
|
|
|
Agrama HA, Tuinstra MR (2003). Phylogenetic diversity and relationships among sorghum accessions using SSRs and RAPDs. African Journal Biotechnology 2(10):334-340.
|
|
|
|
|
Ali ML, Rajewski JF, Baenziger PS, Gill KS, Eskridge KM, Dweikat L (2008). Assessment of genetic diversity and relationship among a collection of US sweet sorghum germplasm by SSR markers. Molecular Breeding 21(4):497-509.
|
|
|
|
|
Amurrio JM, de Ron AM, Escribano MR (1992). Evaluation of Pisum sativum landraces from the Northwest of Iberian Peninsula and their breeding value. Euphytica 66(1):1-10.
|
|
|
|
|
Anderson JA, Churchill GA, Autrique JE, Tanksley SD, Sorrells ME (1993). Optimizing parental selection for genetic linkage maps. Genome 36(1):181-186.
|
|
|
|
|
Ayana A (2001). Genetic diversity in sorghum (Sorghum bicolor (L.) Moench) germplasm from Ethiopia and Eritrea. PhD Thesis, Addis Ababa University, Addis Ababa, Ethiopia.
|
|
|
|
|
Ayana A, Bekele E (2000). Geographical patterns of morphological variation in sorghum (Sorghum bicolor (L.) Moench) germplasm from Ethiopia and Eritrea: Quantitative characters. Euphytica 115(2):91-104.
|
|
|
|
|
Barnaud A, Trigueros G, McKey D, Joly HI (2008). High outcrossing rates in fields with mixed sorghum landraces: how are landraces maintained? Heredity 101(5):445-452.
|
|
|
|
|
Barrett BA, Kidwell KK (1998). AFLP based genetic diversity assessment among wheat cultivars from Pacific North West. Crop Science 38(5):1261-1271.
|
|
|
|
|
Barro-Kondombo C, Sagnard F, Chantereau J, Deu M, vom Brocke K, Durand P, Goze E, Zongo JD (2010). Genetic structure among sorghum landraces as revealed by morphological variation and microsatellite markers in three agroclimatic regions of Burkina Faso. Theoretical and Applied Genetics 120(8):1511-1523.
|
|
|
|
|
Brown SM, Hopkins MS, Mitchell SE, Senior ML, Wang TY, Duncan RR, Gonzalez-Candelas F, Kresovich S (1996). Multiple methods for the identification of polymorphic simple sequence repeats (SSRs) in sorghum [Sorghum bicolor (L.) Moench]. Theoretical and Applied Genetics 93(1-2):190-198.
|
|
|
|
|
Bucheyekei TL, Gwanama C, Mgonja M, Chisi M, Folkertsma R, Mutegi R (2009). Genetic variability characterisation of Tanzania sorghum landraces based on Simple Sequence Repeats (SSR) molecular and morphological markers. African Crop Science Journal 17(2):71-86.
|
|
|
|
|
Carrera AD, Poverene MM, Rodriguez RH (1996). Isozyme variability in Helianthus agrophyllus. Its application in crosses with cultivated sunflower. HELIA-NOVI SAD-, 19:19-28.
|
|
|
|
|
Chakauya E, Tongoona P, Matiburi EA, Grum M (2006). Genetic diversity assessment of sorghum landraces in Zimbabwe using microsatellites and indigenous local names. International Journal of Botany 2(1):219-222.
|
|
|
|
|
Chozin M (2007). Characterization of sorghum accessions and choice of parents for hybridization. Journal Akta Agrosia Edisi Khusus 2:227-232.
|
|
|
|
|
Cox TS, Murphy JP, Rodgers DM (1986). Changes in genetic diversity in the red winter wheat regions of the United States. Proceedings of National Academy of Science, USA 83(15):5583-5586.
|
|
|
|
|
Deu M, Sagnard F, Chantereau J, Calatayud C, Hérault D, Mariac C, Pham JL, Vigouroux Y, Kapran I, Traore PS, Mamadou A, Gerard B, Ndjeunga J, Bezançon G (2008). Niger-wide assessment of in situ sorghum genetic diversity with microsatellite markers. Theoretical and Applied Genetics 116(7):903-913.
|
|
|
|
|
Dje Y, Heuertz M, Ater M, Lefèbvre C, Vekemans X (2004). In situ estimation of outcrossing rate in sorghum landraces using microsatellite markers. Euphytica 138(3):205-212.
|
|
|
|
|
Ejeta G, Goldsbrough PB, Tuinstra MR, Grote EM, Menkir A, Ibrahim Y, Cisse N, Weerasuriya Y, Melak-Berhane A, Shaner CA (2000). Molecular marker applications in sorghum. In: Haussmann BIG, Geiger HH, Hess DE, Hash CT, Bramel-Cox P (eds) Application of molecular markers in plant breeding. Training manual for a seminar
|
|
|
|
|
held at IITA, Ibadan, Nigeria, from 16-17 August 1999, ICRISAT, Patancheru 502324, Andhra Pradesh, India, pp. 81-89.
|
|
|
|
|
Estoup A, Jarne P, Cornuet JM (2002). Homoplasy and mutation model at microsatellite loci and their consequences for population genetics analysis. Molecular Ecology 11(9):1591-1604.
|
|
|
|
|
Foley JA, Ramankutty N, Braumann KA, Cassidy E, Gerber JS, Johnston M, Mueller ND, O'Connell C, Deepak KR, Zaks DPM (2011). Solutions for a cultivated planet. Nature 478(7369):337-342.
|
|
|
|
|
Frankel OH, Brown AHD (1984). Plant genetic resources today: a critical appraisal. In: Holden JHW Williams JT (eds) Crop genetic resources: Conservation and evaluation, George Allen and Unwin, London, pp. 249-259.
|
|
|
|
|
Galyuon IKA, Madhusudhana R, Borrell AK, Hash TC, Howarth CJ (2016). Genetic diversity of stay-green sorghums and their derivatives revealed by microsatellites. African Journal of Biotechnology 15(25):1363-1374.
|
|
|
|
|
Gepts P (2004). Crop domestication as a long-term selection experiment, Volume 24, Part 2: Long-term selection: crops, animals, bacteria. In: Jannick J (ed) Plant Breeding Reviews. New York: Wiley.
|
|
|
|
|
Hamrick JL (1983). The distribution of genetic variation within and among natural plant populations. In: Schoewald-Cox CM, Chamber B, MacBoyde WL, Thomas (eds) Genetics and Conservation. Menlopark: Benjamin Cummings. pp 501-508.
|
|
|
|
|
Haub C (2013). 2013 World population data sheet. View.
|
|
|
|
|
IPCC (Intergovernmental Panel on Climate Change) (2014). Climate Change 2014: Impacts, Adaptation, and Vulnerability. Working Group II. Cambridge, UK: Cambridge University Press.
|
|
|
|
|
Jeya Prakash SP, Biji KR, Gomez SM, Murthy KG, Babu RC (2006). Genetic diversity analysis of sorghum [Sorghum bicolor (L.) Moench] accessions using RAPD markers. Indian Journal of Crop Science 1(1-2):109-112.
|
|
|
|
|
Kearsey MJ (1993). Biochemical genetics in breeding. In: Hayward MD, Bosemark NO, Romagosa I (eds) Plant Breeding Principles and Prospects. Chapman and Hall, London, pp. 103-183.
|
|
|
|
|
Kebede Y (1991). The role of Ethiopian germplasm resources in the national breeding programme. In: Engles JM, Hawkes JG, Worede M (eds.) Plant genetic resources of Ethiopia. Cambridge University Press, Cambridge, UK, pp 315-322.
Crossref
|
|
|
|
|
Lee M (1995). DNA markers and plant breeding programs. Advance Agronomy 55:265-343.
|
|
|
|
|
Loarce Y, Gallego R, Ferrer E (1996). A comparative analysis of the genetic relationships between rice cultivars by RAPD markers. Horticultural Science 31:127-129.
|
|
|
|
|
Manzelli M, Pileri L, Lacerenza N, Benedettelli S, Vecchio V (2007). Genetic diversity assessment in Somali sorghum (Sorghum bicolor (L.) Moench) accessions using microsatellite markers. Biodiversity and Conservation 16(6):1715-1730.
|
|
|
|
|
McNaught SJ (1988). Diversity and stability. Nature 333:204-205.
|
|
|
|
|
Menkir A, Goldsbrough P, Ejeta G (1997). RAPD based assessment of genetic diversity in cultivated races of sorghum. Crop Science 37(2):564-569.
|
|
|
|
|
Menz MA, Klein RR, Unruh NC, Rooney WL, Klein PE, Mullet JE (2004). Genetic diversity of public inbreds of sorghum determined by mapped AFLP and SSR markers. Crop Science 44(4):1236-1244.
|
|
|
|
|
Mohammadi SA, Prasanna BM (2003). Analysis of genetic diversity in crop plants-salient statistical tools and considerations. Review and interpretation. Crop Science 43(4):1235-1248.
|
|
|
|
|
Muench DG, Slinkard AE, Scales GJ (1991). Determination of genetic variation and taxonomy in lentils (Lens miller) species by chloroplast DNA polymorphism. Euphytica 56(3):213-218.
|
|
|
|
|
Muray MM, Geiger HH, Mutegi E, Kanyenji BM, Sagnard F, de Villiers SM, Kiambi D, Parzies HK (2010). Geographical patterns of phenotypic diversity and structure of Kenyan wild sorghum populations (Sorghum spp.) as an aid to germplasm collection and conservation strategy. Plant Genetic Resources: Characterisation and Utilization 1-8.
|
|
|
|
|
Muraya M, Sagnard F, Parzies HK (2010). Investigation of recent population bottlenecks in Kenyan wild sorghum populations (Sorghum bicolor (L.) Moench ssp. verticilliflorum (Steud.) De Wet)
|
|
|
|
|
based on microsatellite diversity and genetic disequilibria. Genetic Resources and Crop Evolution 57(7):995-1005.
|
|
|
|
|
Mutegi E, Sagnard F, Semagn K, Deu M, Muraya M, Kanyenji B, de Villiers S, Kiambi D, Herselman L, Labuschagne M (2011). Genetic structure and relationships within and between cultivated and wild sorghum (Sorghum bicolor (L.) Moench) in Kenya as revealed by microsatellite markers. Theoretical and Applied Genetics 122(5):989-1004.
|
|
|
|
|
Nei M (1973). The theory and estimation of genetic distance. In: Genetic Structure of Populations. Morton NE (ed) University Hawaii Press, Honolulu. pp. 45-54.
|
|
|
|
|
Nei M, Lei WH (1979). Mathematical model for studying genetic variation in terms of restriction endonucleases. Proceedings of National Academy of Science 76(10):5269-5273.
|
|
|
|
|
Nei M, Maruyama T, Chakraborty R (1975). The bottleneck effect and genetic variability in populations. Evolution 29(1):1-10.
|
|
|
|
|
Ng'uni D, Geleta M, Bryngelsson T (2011). Genetic diversity in sorghum (Sorghum bicolor (L.) Moench) accessions of Zambia as revealed by simple sequence repeats (SSR). Hereditas 148(2):52-62.
|
|
|
|
|
Pei Z, Gao J, Chen Q, Wei J, Li Z, Luo F, Shi L, Ding B, Sun S (2010). Genetic diversity of elite sweet sorghum genotypes assessed by SSR markers. Biologia Planetarium 54(4):653-658.
|
|
|
|
|
Sanchez AC, Subudhi PK, Rosenow DT, Nguyen HT (2002). Mapping QTL associated with drought resistance in sorghum (Sorghum bicolor (L.) Moench). Plant Molecular Biology 48(5-6):713-726.
|
|
|
|
|
Shehzad T, Okuizumi H, Kawase M, Okuno K (2009). Development of SSR based sorghum (Sorghum bicolor (L.) Moench) diversity research set of germplasm and its evaluation by morphological traits. Genetic Resources and Crop Evolution 56(6):809-827.
|
|
|
|
|
Slatkin M (1987). Gene flow and the geographic structure of natural populations. Science 236(4803):787-792.
|
|
|
|
|
Smith JSC (1984). Genetic variability within U.S. hybrid maize: Multivariate analysis of isozyme data. Crop Science 24(6):1041-1046.
|
|
|
|
|
Smith JSC, Kresovich S, Hopkins MS, Mitchell SE, Dean RE, Woodman WL, Lee M, Porter K (2000). Genetic diversity among elite sorghum inbred lines assessed with Simple sequence repeats. Crop Science 40(1):226-232.
|
|
|
|
|
Smith OS, Smith JSC (1992). Measurement of genetic diversity among maize hybrids. A comparison of isozymic, RfLP, pedigree, and heterosis data. Maydica 37:53-60.
|
|
|
|
|
Sneath PHA, Sokal RR (1973). Numerical taxonomy: the principles and practice of numerical classification. San Francisco: Freeman. p. 573.
|
|
|
|
|
Taramino G, Tarchini R, Ferrario S, Lee M, Pe ME (1997). Characterization and mapping of simple sequence repeats in sorghum. Theoretical and Applied Genetics 95(1-2):66-72.
|
|
|
|
|
Thomas H, Smart CM (1993). Crops that stay-green. 27 Nov. - 2 Dec. 1983. ICRISAT, Patancheru, A.P., India. Annals of Applied Biology 123:193-219.
Crossref
|
|
|
|
|
Thompson JA, Nelson RL, Vodkin LO (1998). Identification of diverse soybean germplasm using RAPD markers. Crop Science 38(5):1348-1355.
|
|
|
|
|
Thorpe RS (1976). Biochemical analysis of geographical variation and racial affinities. Biology Review 51(4):407-452.
|
|
|
|
|
UNDP (2012). Africa Human Development Report 2012 Towards a Food Secure Future, United Nations Development Programme. New York, USA: United Nations Publications.
|
|
|
|
|
Uptmoor R, Wenzel W, Friedt W, Donaldson G, Ayisi K, Ordon F (2003). Comparative analysis on the genetic relatedness of Sorghum bicolor accessions from Southern Africa by RAPDs, AFLPs and SSRs. Theoretical and Applied Genetics 106(7):1316-1325.
|
|
|
|
|
Vega MP (1993). Biochemical characterization of populations. In: Hayward MD, Bosemark NO, Romagosa I (eds) Plant Breeding: Principles and Prospects. Chapman and Hall, London, pp. 184-200.
|
|
|
|
|
Vittal R, Ghosh N, Weng Y, Stewart BA (2010). Genetic diversity among Sorghum bicolor (L.) Moench genotypes as revealed by prolamines and SSR markers. Journal of Biotechnology Research 2:101-111.
|
|
|
|
|
Zhihong X, Jiayang L, Yongbiao X, Weicai Y (2008). The Africa biofortified sorghum project-applying biotechnology to develop nutritionally improved sorghum for Africa. Springer, Netherlands.
|
|
|
|
|
Zhong-hu H (1991). An investigation of the relationship between the F1 potential and measures of genetic distance among wheat lines. Euphytica 58(2):165-170.
|
|