ABSTRACT
This study investigates the determinants of the corporate effective tax rate (ETR) of Italian private (unlisted) companies in 2016 and 2017. Although a large body of research has addressed the issue of the determinants of the ETR, both the Italian context and the private companies have been the object of scant attention in previous studies. To test research hypotheses, as in several previous studies, a pooled cross-sectional OLS model has been adopted. The study shows a statistically significant and negative (positive) association between ETR and firm size, investment in tangible fixed assets, inventories, investments in subsidiaries, affiliates and other companies, and the firm’s profitability (intangible fixed assets and the firm’s indebtedness). Conversely, it shows no statistically significant association between ETR and tangible fixed assets. The financial year in question, the region where companies are located, and the economic sector they belong to, included as control variables, affect the ETR. Italian public policy-makers and Italian and non-Italian economic operators can benefit from the results of the study in order to make more informed future decisions.
Key words: Effective tax rate, private companies, Italy.
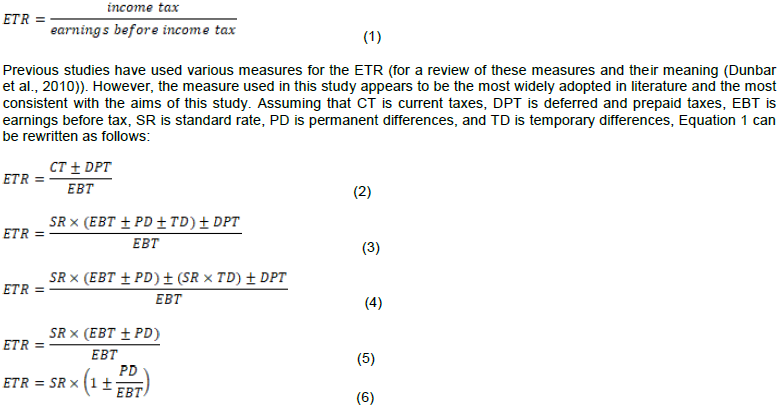
A large body of research has addressed the issue of the determinants of the corporate effective tax rate (ETR). The ETR can be defined as the tax rate that a company actually pays on its earnings. Although the ETR has been measured in different ways in the literature (Hanlon and Heitzman, 2010), in this study it is measured in the most recurrent way, namely as the ratio between income tax (current, deferred and prepaid taxes) and earnings before income tax, as they are reported in the income statement.
A large body of research has addressed the aforementioned issue because the ETR, more than the standard tax rate (that is, the tax rate set by fiscal regulations), provides an actual measure of the tax burden that a company in a given country must bear. In fact, the ETR generally does not correspond to the standard tax rate, but derives from the combination of the level of the standard tax rate and the set of tax rules that determine the tax base on which to apply the standard tax rate.
Public decision-makers may have a vested interest in the ETR because it can serve as an economic policy tool. Indeed, by acting on the ETR level, they can encourage or discourage the birth, development, and localisation of entrepreneurial activities. In this perspective, it is also a competitive tool for individual countries’ governments because it can be used to encourage foreign economic operators to establish their headquarters in their territory (Altshuler and Goodspeed, 2015; Genschel and Schwarz, 2011; Wilson, 1999).
Moreover, even economic operators could have a great interest in the ETR and, above all, in its determinants. Indeed, the latter could be included among those factors able to influence the taking of certain decisions. For example, some studies have shown that the ETR can influence companies’ decisions on capital structure (Huang and Song, 2006; MacKie-Mason, 1990) or foreign direct investment (Bénassy-Quéré et al., 2005; De Mooij and Ederveen, 2003).
The aforementioned interest has led researchers to address the issue of the determinants of the ETR. Although there is a rather broad consensus on the main determinants that seem to be able to explain the variability of the ETR (e.g. firm size, asset mix, leverage, and profitability), previous studies have mainly focused on certain countries (U.S.-centered studies are particularly numerous) and on larger companies (listed ones, generally), and their findings are often inconclusive because differences have been found from country to country and, even within the same country, from one time period to another. This suggests that the determinants of the ETR are country- and time-specific. In other words, the significance of certain determinants could depend on the set of accounting and fiscal rules in force in the country and in the time period under investigation.
Starting from these premises, this study aims to investigate the determinants of the ETR in the context of Italian private (unlisted) companies. Neither the Italian context nor private companies appear to have been the object of much attention in literature. To the best of our knowledge, only Parisi (2016) and Santosuosso (2017) have addressed the issue of the determinants of the ETR with specific reference to the Italian context. However, the former has investigated private companies operating decades ago (1998-2006), while the latter has investigated only public companies. Due to the fact that accounting and tax rules are affected by frequent changes, it is believed that those that may be interested in the determinants of the ETR, particularly policy-makers and economic operators, would find it more useful to know what is happening today (or certainly in a more recent time period) rather than what happened in the somewhat distant past. Therefore, in order to maximise the usefulness of the findings of the investigation, this study is focused on a very recent time period (2016-2017).
The reasons underlying this choice are two-fold. Firstly, we believe the findings of the investigation to be more useful. While we acknowledge that the year 2018 should also have been included, at the time when the necessary data was extracted for the investigation, the data for 2018 was only available for a small number of companies.
Secondly, the time period investigated had to be relatively homogeneous with regards to the accounting and fiscal rules in force in the context investigated. In reference to this point, we underscore that as of 1st January 2016 new accounting and tax rules came into force and remained relatively constant thereafter.
THE ITALIAN CORPORATE TAX SYSTEM: AN OVERVIEW
Italian companies are subject to a state corporate income tax, known as “imposta sul reddito delle società” (IRES), regulated by the Decree of the President of the Republic (D. P. R.) of 22nd December 1986, n. 917, and to a regional production tax, known as “imposta regionale sulle attività produttive” (IRAP), regulated by the Legislative Decree (D. Lgs.) of 15th December 1997, n. 446.
The standard IRES rate was 27.5% until fiscal year 2016. Since fiscal year 2017 it is 24% (art. 1, par. 61, of the Law of 28th December 2015, n. 208). IRES is charged on the total net income reported in a company’s financial statements as adjusted for specific tax rules.
The standard IRAP rate is 3.9% and is levied on a regional basis. The regions are allowed to increase or decrease the standard IRAP rate up to 0.92%. Moreover, different standard IRAP rates are applicable for certain entities. Companies with facilities in different regions must allocate their overall taxable base to the different regions based on the employment costs of personnel located at the various sites. There are different methods of computation for the IRAP taxable base, depending on the nature of the business carried out by the taxpayer. For sales and manufacturing companies, it is broadly represented by the company’s gross margin in its financial statements. Interest income and expenses, provisions for bad debts, provisions for liabilities and risks, and certain extraordinary items are excluded from the IRAP taxable base. In addition, the deduction of labor costs depends on the type of hiring contract adopted.
Determinants of the effective tax rate and proposed hypotheses
In order to develop the research hypotheses, three main aspects are taken into consideration: (a) the way the ETR is measured in this study, (b) the findings of previous studies, and (c) the main tax rules in force in Italy in the time period subject to investigation that may affect the associations between the characteristics of the companies and the variability of their ETR.
With reference to the first aspect, in this study the ETR is measured as the ratio between income tax (current, deferred and prepaid taxes) and earnings before income tax:
Equation 6 shows that the variability of the ETR is due to the sign and magnitude of permanent differences. It is given that permanent differences between accounting income, before income tax, and taxable income result when expenses (losses) or revenues (gains) are recognised in the former but are never recognised in the latter or vice versa. The differences are permanent as they do not reverse in the future. Permanent differences result in a difference between the company’s ETR and the statutory tax rate. Therefore, hypothesising associations between the companies’ characteristics and the companies’ ETR should take into account the fact that companies’ characteristics may or may not generate permanent differences.
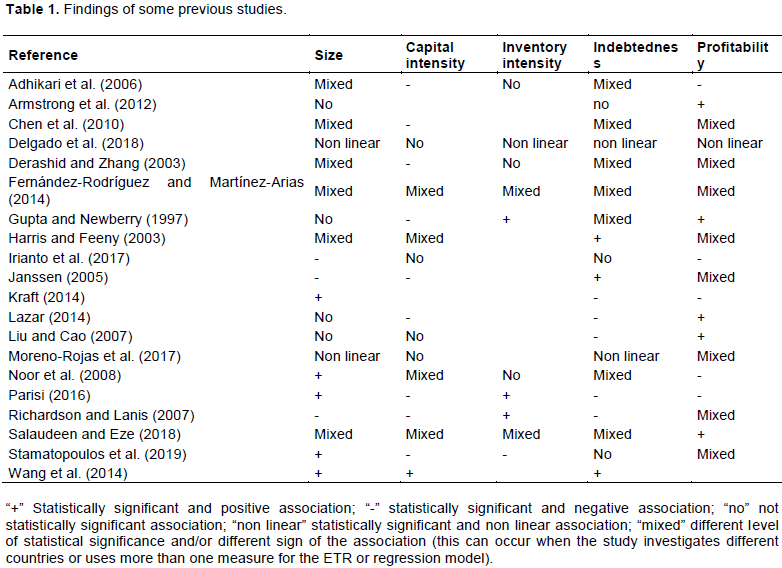
With reference to previous studies, some of their findings are shown in Table 1. With no claim of being exhaustive, it shows the results of some studies, focusing on the characteristics of companies whose impact on the ETR is being investigated in this study. The other characteristics that have been investigated in previous studies are not taken into consideration in this study due to the unavailability of the necessary data. With reference to all the features shown in Table 1, the findings of previous studies appear inconclusive. The research hypotheses tested in this study are developed as shown in the following.
Firm size
Two competing theories could explain the association between firm size and ETR. According to the “political cost theory” (Zimmerman, 1983), “larger firms are subject to more governmental regulations” and “they are politically more prone to public pressure and scrutiny, which forces them to act socially responsible and to adjust their actions and corporate behavior to what their social environment expects” (Belz et al., 2019). In line with this view, the firm size should positively affect the ETR. Conversely, according to the “political power theory” (Siegfried, 1972), “larger firms have lower ETRs because they have substantial resources available to them to manipulate the political process in their favor, engage in tax-planning and organize their activities to achieve optimal tax savings” (Richardson and Lanis, 2007). In line with this view, the firm size should negatively affect the ETR.
The fact that both of these theories suggest that the firm’s size has an impact on the ETR and that most of the previous studies have found that this impact, whether positive or negative, is statistically significant, leads to hypothesise that firm size should have an impact on ETR in the context of Italian private companies. However, there are not enough elements to hypothesise the sign of this impact.
Therefore, the research hypothesis that is tested is the following:
H1: Firm size affects ETR.
Asset mix
Tangible fixed assets
The association between investments in tangible fixed assets and ETR has been widely investigated. Previous studies have generally hypothesised that the former should have a negative impact on the ETR due to the fact that (1) tangible fixed assets are associated with amortisation which constitutes a deductible cost for tax purposes and (2) they are often encouraged through tax incentives (Gupta and Newberry, 1997; Richardson and Lanis, 2007). However, this way of justifying the existence of said association and the related (negative) sign appears to be open to criticism on at least two points.
First, when the ETR is measured as it is in this study, tangible fixed assets would affect the ETR only if they are related to costs (revenues) that constitute permanent differences and these costs (revenues) are proportional to tangible fixed assets. Although the Italian tax legislation provides for cases of non-deductibility (non-taxable) of costs (revenues) related to tangible fixed assets (D. P. R. of 22nd December 1986, n. 917), the link between them and the magnitude of tangible fixed assets is not conceivable.
Second, any effect produced by any tax incentives attributed to companies to encourage the acquisition of tangible fixed assets should not be formulated generically. Rather, it should be referred to it if the tax legislation actually provides for it. However, in this case, its impact would not be associated with the magnitude of total tangible fixed assets. Rather, it would be associated with the magnitude of the tangible fixed assets that get the benefit. In this regard, the context investigated in this study allows us to better verify the relationships under examination. In fact, in the investigation timeframe (2016-2017), the Italian government introduced a tax benefit, the so-called “super-amortisation”, for companies that make certain types of investments in tangible fixed assets (Law 28th December 2015, n. 2008 and Law 11th December 2016, n. 232). In practice, companies can, through the amortisation process, deduct from their taxable base a cost for the tangible fixed assets that is higher than the purchase cost. For the purposes of determining the tax base, this generates a negative permanent difference; therefore, it would negatively impact on the ETR.
In light of all the aforementioned, the following research hypotheses are tested:
H2: In the presence of tax incentives that encourage the purchase of fixed tangible assets, if the effect of these incentives is controlled, tangible fixed assets do not affect ETR.
H3: In the presence of tax incentives that encourage the purchase of fixed tangible assets, increments of investments in tangible fixed assets negatively affects ETR.
Intangible fixed assets
The association between investments in intangible fixed assets and the ETR has been studied by some scholars (Chen et al., 2010), albeit infrequently, compared to other associations. In some studies, investments in intangible fixed assets have been considered along with investments in tangible fixed assets (Dias and Reis, 2018; Wang et al., 2014).
However, in Italy these investments may be a significant determinant of the degree of variability of the ETR. With reference to patents, the tax-deductible portion is 50% of their cost (art. 103 of the D. P. R. of 22nd December 1986, n. 917). With reference to goodwill, two aspects must be noted. The first relates to the fact that the amortisation period prescribed by the Italian GAAP is different from the amortisation period prescribed by the tax legislation. However, this does not generate permanent differences. In fact, this generates only temporary differences; thus, it has no effect on the ETR. The second aspect concerns the deductibility of amortisation. The amortisation of goodwill is deductible only if the goodwill cost is tax-relevant (art. 103 and 176 of the D. P. R. of 22nd December 1986, n. 917), but this is not always the case. In fact, for the amortisation to be deductible, the company must pay a “special” tax. However, the amount of this tax could be considered too burdensome for the company. Consequently, the company could decide not to pay this tax, not giving tax relevance to the cost of goodwill. In this case, permanent differences are generated. In light of the aforementioned, the research hypothesis tested is as follows:
H4: Intangible fixed assets do not negatively affect ETR.
Inventories
Some previous studies that have explored the impact of the asset mix on ETR have included inventory level as an explanatory variable (Adhikari et al., 2006; Derashid and Zhang, 2003; Gupta and Newberry, 1997; Noor et al., 2008; Richardson and Lanis, 2007; Salaudeen and Eze, 2018). Gupta and Newberry (1997) argue that given the tax benefits associated with capital investments, capital intensive firms should face a lower ETR and, to the extent that the investment in inventories is a substitute for the investment in tangible fixed assets, inventory intensive firms should face a relatively higher ETR.
In developing the previous H2 and H3 research hypotheses, it has been argued that the magnitude of investments in tangible fixed assets should not have an effect on the ETR. In addition, when the ETR is measured as in this study, inventories would affect the ETR only if there were related costs (revenues) that constitute permanent differences and they were proportional to the magnitude of inventories. The Italian tax legislation does not provide for cases of non-deductibility (non-taxable) of costs (revenues) related to inventories.
In light of the aforementioned, the research hypothesis tested is as follows:
H5: Inventories do not affect ETR.
Investments in subsidiaries, affiliates, and other companies
The association between investments in subsidiaries, affiliates, and other companies and the ETR appears to have been under investigated in literature. However, an analysis of Italian accounting and tax rules suggests that this association may exist.
Italian companies can account for (some of) these investments, adopting either the equity method – very rarely used – or the cost method. This implies that, when the investee company decides to distribute dividends, the investor company (that adopts the cost method) recognises them in the income statement. These dividends are taxed only for IRES purposes and only at a rate of 5% of their value (art. 89 of the D. P. R. of 22nd December 1986, n. 917). This implies that dividends generate a permanent difference for an amount almost equal to their value. In addition, dividends are IRAP-exempt revenues. Assuming that the higher the investments in subsidiaries, affiliates, and other companies are, the higher the amounts of dividends will be, and that the higher the amounts of dividends are, the higher the negative permanent differences will be, the research hypothesis tested is as follows:
H6: Investment in subsidiaries, affiliates and other companies negatively affect ETR.
Leverage
According to most of the previous studies, the degree of indebtedness should have a negative impact on the ETR because it generates financial charges that are (usually) deductible costs. However, this is not completely true in the context of Italian companies.
The financial charges incurred in a given fiscal year are deductible costs for IRES purposes, within the limit set by the tax legislation (art. 96 of the D. P. R. of 22nd December 1992, n. 917). The part that exceeds this limit can be deducted in subsequent fiscal years if the conditions prescribed by the law are met. This part gives rise to deferred taxes and a deferred tax asset. However, the financial charges incurred in a given fiscal year are non-deductible costs for IRAP purposes. Therefore, considering how the ETR is measured in this study, financial charges would not have an effect on the effective IRES tax rate, but would have an effect on the effective IRAP tax rate. These considerations suggest the following research hypothesis:
H7: Leverage positively affects ETR.
Profitability
With reference to the association, and to the relative sign, between firm profitability and ETR, two main contrasting strands of research have emerged in literature.
Most previous studies (Armstrong et al., 2012; Gupta and Newberry, 1997; LazÓ‘r, 2014; Richardson and Lanis, 2007) have found a positive association. These scholars usually justify the positive sign by arguing that the higher the profitability, the higher the amount of taxes paid by a company. This reasoning, however, is open to criticism. In fact, paying more taxes on profitability does not imply having a higher ETR. Equation 6 shows that the variability of the ETR depends on the sign and magnitude of permanent differences. The fact that a company is more profitable does not imply that it has lower, positive permanent differences or greater, negative permanent differences.
However, a few prior studies have found, instead, a negative association. These authors usually justify this negative association arguing that companies with higher profitability have more incentives and resources to put in place strategies for reducing the taxable base (Manzon and Plesko, 2001; Rego, 2003).
In light of the aforementioned, the research hypothesis tested is as follows:
H6: Profitability affects ETR.
RESEARCH DESIGN AND SAMPLE SELECTION
To test the research hypotheses developed earlier, as in Derashid and Zhang (2003), Janssen (2005), and Richardson and Lanis (2007), a pooled cross-sectional OLS model is adopted, as follows:
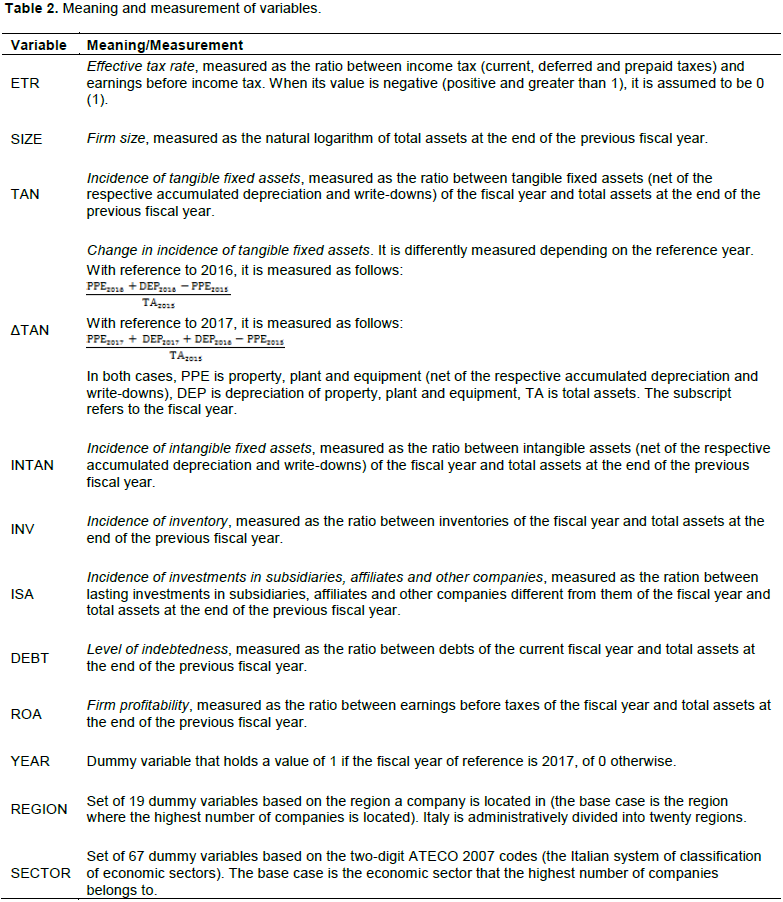
The meaning of the variables and the way they are measured are analytically shown in Table 2. The subscripts i and t refer to company i and financial year t, respectively.
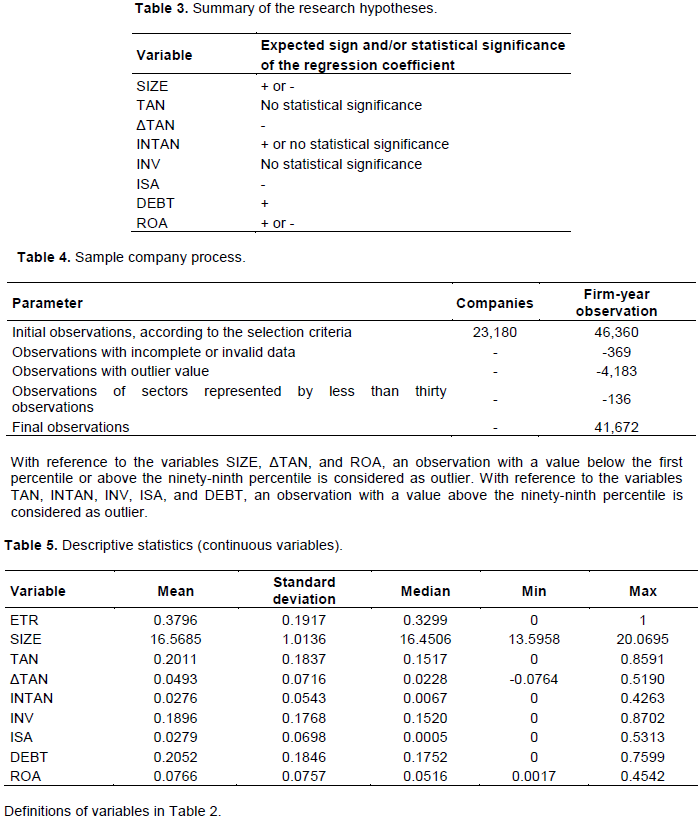
The first eight variables of Equation 7 are related to the research hypotheses. The confirmation or the rejection of the research hypotheses depend on the sign and/or the statistical significance of the respective regression coefficient, as shown in Table 3. The remaining variables of Equation 7 are control variables. The variable YEAR is included to control for the effect of the financial year and the change in the standard IRES rate. As stated earlier, in fact, the standard IRES rate was 27.5% in 2016 and 24% in 2017. The variable REGION is included to control for the effect of the Italian region in which a company is located because the standard IRAP rate may vary from region to region. In addition, companies located in certain regions may have benefited from specific tax incentives. The variable SECTOR is included to control for the effect of the economic sector in which a company operates; in fact, the standard IRAP rate may also vary from one economic sector to another. In addition, companies operating in certain sectors may have benefited from specific tax incentives.
The sample of companies was extracted (on 2nd May 2019) from the AIDA database supplied by Bureau van Dijk; it is the largest database of financial statement data of Italian companies. The sample of companies was selected on the basis of the following criteria:
(1) limited liability companies;
(2) active companies;
(3) private (unlisted) companies;
(4) (non-consolidated) financial statements prepared in ordinary form according to Italian legislation and generally accepted accounting standards available for years 2017-2016-2015;
(5) companies operating in economic sectors other than the financial one;
(6) number of employees at least equal to ten so as to exclude micro enterprises (as defined by European legislation);
(7) positive earnings before taxes.
The companies that reported losses (negative earnings before taxes) were eliminated because the interpretation of the tax burden in such cases would have been complex and questionable (Fernández-Rodríguez and Martínez-Arias, 2014; Omer et al., 1993; Richardson and Lanis, 2007; Wilkie and Limberg, 1993; Zimmerman, 1983).
The number of companies meeting the aforementioned selection criteria amounted to 23,180, corresponding to 46,360 firm-year observations. After making the deletions indicated in Table 4, the final observations totaled 41,672 (20,984 observations refer to the fiscal year 2016; 20,688 observations refer to the fiscal year 2017).
Table 5 shows the main descriptive statistics referring to the sample observations. Two aspects merit highlighting; by distinguishing the observations by fiscal year, the mean (median) value of the ETR (not tabulated) amounts to 0.3972 (0.3457) for fiscal year 2016 and 0.3617 (0.3107) for fiscal year 2017. Both the mean value and the median value of the ETR decreased by about 3.5% which corresponds exactly to the reduction in the standard IRES rate (from 27.5 to 24%).
With reference to firm size (SIZE), 50% of the observations reveal total assets of less than 14 million euros, while 75% of the observations show total assets of less than 28 million euros. These values show that the sample mainly consists of small- and medium-sized companies, which is the typical size of Italian private companies.
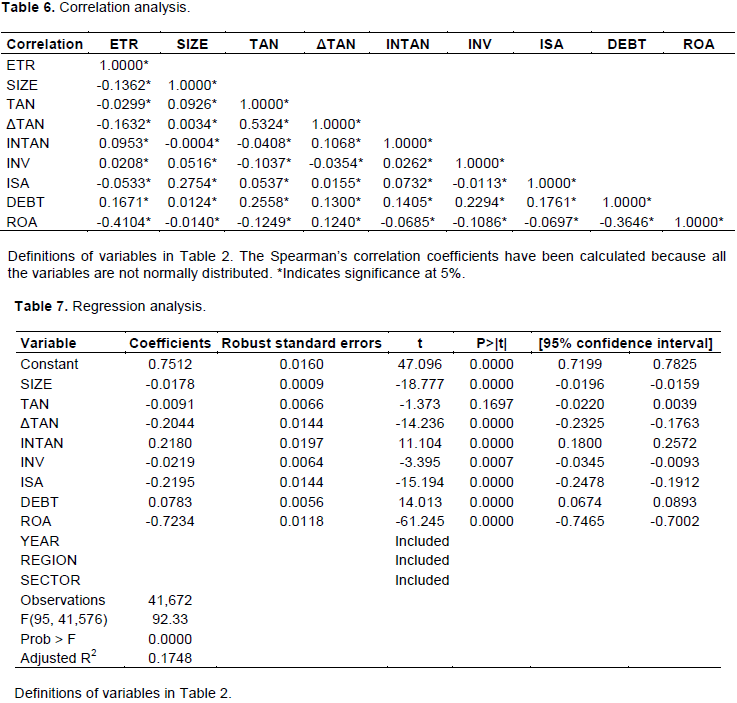
Table 6 shows the results of the correlation analysis. With reference to the correlation coefficients between the dependent variable and the independent variables, all of them are statistically significant. Their sign is negative (positive) with reference to the variables SIZE, TAN, ΔTAN, ISA, and ROA (INTAN, INV and DEBT). These results are not completely in line with the research hypotheses. In fact, with reference to SIZE, ΔTAN, INTAN, ISA, DEBT, and ROA, the association with the ETR has been hypothesised (regardless of its sign). Instead, with reference to TAN and INV, the non-association with the ETR has been hypothesised.
As concerns the correlation coefficients between the independent variables, none of them are of a magnitude that would suggest the presence of multi-collinearity problems. The calculation and analysis of the Variance Inflation Factors (VIF) (not tabulated) confirm that there are no multi-collinearity problems.
Table 7 shows the results of the regression analysis. The regression coefficient of SIZE is statistically significant. Thus, the related research hypothesis (H1) is confirmed. It is negative and therefore, the larger the company, the lower the ETR. This result is in line with Irianto et al. (2017), Janssen (2005), and Richardson and Lanis (2007). It supports the “political power theory” (Siegfried, 1972). However, considering the dimensional characteristics of the observations of the sample, it is not believed that larger companies have substantial enough resources available to them to manipulate the political process. Rather, it is believed that they have the resources to engage in tax-planning and to organise their activities so as to achieve optimal tax savings. The result differs from that obtained by Parisi (2016) who investigated the impact of firm size on the ETR in a sample of Italian private companies for the 1998-2006 time period and found that it was statistically significant and positive. In accordance with Gupta and Newberry (1997), the inconsistent results suggest that firm-size effects could be sample-specific and not likely to exist over time in firms with longer histories.
The regression coefficient of TAN is not statistically significant, whereas ΔTAN is statistically significant and negative. Thus, the related research hypotheses (H2 and H3) are confirmed. The result concerning the first variable is in line with Delgado et al. (2018), Irianto et al. (2017), Liu and Cao (2007). Most previous studies (Gupta and Newberry, 1997; Richardson and Lanis, 2007) that did not directly control for the effect of tax benefits envisaged to incentivise the investment in tangible fixed assets initially hypothesised and later found that a statistically significant and negative association exists between the incidence of tangible fixed assets and the ETR. This justifies the statistical significance and the sign of this association by the fact that (1) the amortisation of tangible fixed assets is a deductible cost for tax purposes and (2) the investment in tangible fixed assets is often incentivised by tax benefits. Parisi (2016) is included among this group of studies. It has been highlighted that the mere fact that the aforementioned amortisation is a deductible cost for tax purposes is not a valid theoretical justification for a negative association between the incidence of tangible fixed assets and the ETR, at least in the case in which ETR is measured following the method used in this study. It has also been pointed out that the effect produced by the tax benefits envisaged to incentivise investments in tangible fixed assets should be considered if they are actually envisaged and in the terms in which they are envisaged. The results of this study show that, if an independent variable capable of measuring, at least approximately, the aforementioned incentives is introduced in the regression model, the incidence of tangible fixed assets loses statistical significance, while the variable that approximates the aforementioned incentives is statistically significant and negative. If ΔTAN had not been included in the regression model used in this study, the regression coefficient of TAN would have been statistically significant and negative as in most previous studies. The results of this study, therefore, suggest that greater caution should be used in the development of the research hypothesis on the significance and sign of the association between the incidence of tangible fixed assets and the ETR.
The regression coefficient of INTAN is statistically significant and positive. Thus, the related research hypothesis (H4) is confirmed. This means that the higher the investment in intangible fixed assets is, the higher (in absolute value) the positive permanent differences are. Considering that the magnitude of investments in intangible fixed assets is usually positively associated with the magnitude of goodwill recorded on the balance sheet and considering the tax rules in force in Italy, this result could mean that companies have not found it convenient to recognise, for tax purposes, the cost of goodwill. As stated earlier, some previous studies (Dias and Reis, 2018; Wang et al., 2014) added investments in intangible fixed assets together with investments in tangible fixed assets, to make a single and overall variable in the regression model. Had this been done the same way in this study (and ΔTAN had not been included in the regression model), the regression coefficient of TAN would have been statistically significant and negative, but its magnitude, in absolute value, would have been less than when INTAN is included separately. In this case, in fact, the regression coefficient of TAN would have reflected the contrasting effects produced by TAN and INTAN on the ETR.
The regression coefficient of INV is statistically significant and negative. Thus, the related research hypothesis (H5) is rejected. This result contrasts with both the research hypothesis developed in this study (no association) and with that most frequently found in previous studies (positive association) (Gupta and Newberry, 1997; Parisi, 2016; Richardson and Lanis, 2007). Recently, Stamatopoulos et al. (2019), exploring the determinants of the variability of the ETR in Greek companies, have found a statistically significant and negative association between the ETR and INV. According to them, “it is reasonable to expect that if inventory grows faster than sales, a price reduction will follow leading to lower sales revenue and income and consequently to lower tax” (Stamatopoulos et al., 2019: 246). This justification rests on the assumption that the lower the profitability of the company is, the lower the ETR will be. However, as will be shown subsequently, this assumption is not reflected in the context investigated in this study. In addition, in order to control for the robustness of the results of this study, double-clustered standard errors (by region and economic sector) have been computed in order to account for within-cluster correlation and heteroscedasticity (results are not tabulated). With this different way of calculating standard errors, the only variable that lost statistical significance was INV. With the different way of calculating standard errors, therefore, the regression coefficient of INV is not statistically significant, in line with the related research hypothesis (H5). The findings relative to INV, therefore, should be interpreted with caution and the association under examination requires further research.
The regression coefficient of ISA is negative and statistically significant. Thus, the related research hypothesis (H6) is confirmed. To the best of our knowledge, this study is the first to investigate the type of association under consideration. This result confirms the fact that the search for determinants of the variability of the ETR should be more focused on the characteristics (the fiscal system, in particular) of the context under investigation.
The regression coefficient of DEBT is positive and statistically significant. Thus, the related research hypothesis (H7) is confirmed. This result is in line with Harris and Feeny (2003), Janssen (2005), and Wang et al. (2014). It confirms the fact that, when the ETR is measured as the way it is in this study, indebtedness can influence the ETR when it generates cost (or revenue) elements that constitute permanent differences, as in the Italian case, and not merely because the financial charges are deductible costs for tax purposes. This result is different from that obtained by Parisi (2016), who found a statistically significant and negative association. The inconsistency between the results could depend on the different tax rules regarding the deductibility of the financial charges in force in the two time periods under investigation (2016-2017 in this study; 1998-2006 in the other study).
The regression coefficient of ROA is statistically significant and negative. Thus, the related research hypothesis (H8) is confirmed. This result is in line with Adhikari et al. (2006), Iranto et al. (2017), Kraft (2014), Noor et al. (2008), and Parisi (2016). As suggested by Manzon and Plesko (2001) and Rego (2003), this result could be justified by arguing that companies with higher profitability have more incentives and resources to put in place strategies for reducing their taxable base.
With reference to YEAR, the analysis has shown that the regression coefficient is negative and statistically significant. This result is consistent with the fact that, as mentioned earlier, the standard IRES rate was reduced (from 27.5 to 24%).
With reference to REGION, the analysis has shown that the regression coefficient is statistically significant (at the 5% level) for 11 of the 19 dummy variables included in the regression model (results not tabulated). This result can be explained by the fact that the standard IRAP rate can vary from region to region and there may be tax incentives to support the establishment and development of entrepreneurial activities in certain regions. This result suggests that the tax burden is not equally distributed among the regions. A similar result was found by Vandenbussche et al. (2005) with reference to Belgium. However, as regards the Italian context, this aspect requires further and specific research.
With reference to SECTOR, the analysis has shown that the regression coefficient is statistically significant (at the 5% level) for 33 of the 67 dummy variables included in the regression model (results not tabulated). As with reference to REGION, this result can be explained by the fact that the standard IRAP rate can vary from economic sector to economic sector and there may be fiscal benefits that favor specific economic sectors. This result suggests that the tax burden is not equally distributed even among the economic sectors. Nevertheless, this aspect also needs additional and targeted research.
The coefficient of determination of the linear regression model appears to be low, although it is in line with those found in some previous studies and the model has included the main independent and control variables that have generally been used in previous studies. This means that the percentage variation in the ETR, which is explained by all the independent and control variables together, is low. In addition, although most of the relationships found have very high statistical significance, the relative effect size of most determinants appears to be scarcely significant in substantial terms. This suggests that the line of research on the determinants of the ETR, with reference to Italy but also to other countries of the world, requires further attention by researchers.
The study has shown a statistically significant and negative (positive) association between ETR and firm size, investment in tangible fixed assets, inventory, investments in subsidiaries, affiliates, and other companies, and firm profitability (intangible fixed asset and firm indebtedness). Conversely, it has shown no statistically significant association between ETR and tangible fixed assets. The study has also shown that companies’ ETR is affected by the financial year of reference, the region where they are located, and the economic sector to which they belong.
By focusing on Italian private companies, the study extends the scope of investigation on the determinants of the ETR to both a geographical context (Italy) and to companies (private companies) that have been the object of scant attention in previous studies. Italian public policy-makers and Italian and non-Italian economic operators can benefit from the results of the study in order to make more informed future decisions.
The study highlights the importance of paying more attention to the specificities of the investigated context when formulating research hypotheses on the associations between the ETR and the specific characteristics of companies.
The present study is not without limitations, the most significant of which is related to the way some independent variables have been measured. This is particularly relevant for the variable ΔTAN. It has been included to observe the impact of the tax benefit linked to investments in tangible fixed assets. However, the tax benefit applies only to certain types of investments. Because of the lack of data that would be necessary to measure only these investments, ΔTAN measures the total investments. As a result, the findings should be interpreted with caution.
Two main future research paths can be envisaged. The first one is suggested by the low level of the coefficient of determination of the regression model obtained in this study. In this regard, as in the main previous studies, the characteristics of companies have been measured using variables constructed on the basis of balance sheet data. However, they could be measured using variables constructed on the basis of income statement data. For example, the effect of the level of indebtedness has been verified using the incidence of debts on total assets, assuming that the higher this incidence is, the higher the amount of financial charges recorded in income statement will be. However, the effect of the level of indebtedness could be verified using the incidence of financial charges on an appropriate parameter in the income statement. In fact, the first measure may fail to fully and correctly capture the magnitude of the permanent difference which, as shown earlier, is the real cause of the variability of the ETR. Similar considerations can be extended to the other characteristics of the companies investigated in this study. The second future research path is related to the reduction in the standard tax rate that occurred in Italy. There are few studies in literature that have investigated what hap
The author has not declared any conflict of interests.
REFERENCES
|
Adhikari A, Derashid C, Zhang H (2006). Public policy, political connections, and effective tax rates: Longitudinal evidence from Malaysia. Journal of Accounting and Public Policy 2(5):574-595.
Crossref
|
|
|
|
Altshuler R, Goodspeed TJ (2015). Follow the leader? Evidence on European and US tax competition. Public Finance Review 43(4):485-504.
Crossref
|
|
|
|
Armstrong CS, Blouin JL, Larcker DF (2012). The incentives for tax planning. Journal of Accounting and Economics 53(1-2):391-411.
Crossref
|
|
|
|
Belz T, von Hagen D, Steffens C (2019). Taxes and firm size: Political cost or political power? Journal of Accounting Literature 42:1-28.
Crossref
|
|
|
|
Bénassy-Quéré A, Fontagné L, Lahrèche-Révil A (2005). How does FDI react to corporate taxation? International Tax and Public Finance 12:583-603.
Crossref
|
|
|
|
Chen S, Chen X, Cheng Q, Shevlin TJ (2010). Are family firms more tax aggressive than non-family firms? Journal of Financial Economics 95(1):41-61.
Crossref
|
|
|
|
De Mooij RA, Ederveen S (2003). Taxation and foreign direct investment: a synthesis of empirical research. International Tax and Public Finance 10(6):673-693.
Crossref
|
|
|
|
Delgado FJ, Fernández-Rodríguez E, Martínez-Arias A (2018). Corporation effective tax rates and company size: evidence from
Crossref
|
|
|
|
Germany. Economic Research-Ekonomska Istraživanja 31(1):2081-2099.
|
|
|
|
Derashid C, Zhang H (2003). Effective tax rates and the 'industrial policy' hypothesis: Evidence from Malaysia. Journal of International Accounting, Auditing and Taxation 12(1):45-62.
Crossref
|
|
|
|
Dias PJVL, Reis PMG (2018). The relationship between the effective tax rate and the nominal rate. Contaduría y Administración 63(2):23-24.
Crossref
|
|
|
|
Dunbar A, Higgins D, Phillips J, Plesko G (2010). What do measures of tax aggressiveness measure? In Proceedings of the National Tax Association Annual Conference on Taxation 103(103):18-26.
|
|
|
|
Fernández-Rodríguez E, Martínez-Arias A (2014). Determinants of the effective tax rate in the BRIC countries. Emerging Markets Finance and Trade 50(sup 3):214-228.
Crossref
|
|
|
|
Genschel P, Schwarz P (2011). Tax competition: a literature review. Socio-Economic Review 9(2):339-370.
Crossref
|
|
|
|
Gupta S, Newberry K (1997). Determinants of the variability in corporate effective tax rates: Evidence from longitudinal data. Journal of Accounting and Public Policy 16(1):1-34.
Crossref
|
|
|
|
Hanlon M, Heitzman S (2010). A review of tax research. Journal of Accounting and Economics 50(2-3):127-178.
Crossref
|
|
|
|
Harris M, Feeny S (2003). Habit persistence in effective tax rates. Applied Economics 35(8):951-958.
Crossref
|
|
|
|
Huang G, Song FM (2006). The determinants of capital structure: evidence from China: China Economic Review 17(1):14-36.
Crossref
|
|
|
|
Irianto BS, Sudibyo YA, Wafirli A (2017). The influence of profitability, leverage, firm size and capital intensity towards tax avoidance. International Journal of Accounting and Taxation 5(2):33-41.
Crossref
|
|
|
|
Janssen B (2005). Corporate effective tax rates in the Netherlands. De Economist 153(1):47-66.
Crossref
|
|
|
|
Kraft A (2014). What really affects German firms' effective tax rate? International Journal of Financial Research 5(3):1-19.
Crossref
|
|
|
|
Lazar S (2014). Determinants of the variability of corporate effective tax rates: Evidence from Romanian listed companies. Emerging Markets Finance and Trade 50(sup4):113-131.
Crossref
|
|
|
|
Liu X, Cao S (2007). Determinants of corporate effective tax rates: Evidence from listed companies in China. Chinese Economy 40(6):49-67.
Crossref
|
|
|
|
MacKieâ€Mason JK (1990). Do taxes affect corporate financing decisions? The Journal of Finance 45(5):1471-1493.
Crossref
|
|
|
|
Manzon Jr GB, Plesko GA (2001). The relation between financial and tax reporting measures of income. Tax Law Review 55:175-214.
Crossref
|
|
|
|
Moreno-Rojas J, González-Rodríguez MR, Martín-Samper RC (2017). Determinants of the effective tax rate in the tourism sector: A dynamic panel data model. Tourism & Management Studies 13(3):31-38.
Crossref
|
|
|
|
Noor RM, Mastuki NA, Bardai B (2008). Corporate effective tax rates: A study on Malaysian public listed companies. Malaysian Accounting Review 7(1):1-20.
|
|
|
|
Omer TC, Molloy K, Ziebart D (1993). An investigation of the firm size-effective tax rate relation in the 1980s. Journal of Accounting, Auditing and Finance 8(2):167-182.
Crossref
|
|
|
|
Parisi V (2016). The determinants of Italy's corporate tax rates: An empirical investigation. Public and Municipal Finance 5(4):7-14.
Crossref
|
|
|
|
Rego SO (2003). Taxâ€avoidance activities of US multinational corporations. Contemporary Accounting Research 20(4):805-833.
Crossref
|
|
|
|
Richardson G, Lanis R (2007). Determinants of the variability in corporate effective tax rates and tax reform: Evidence from Australia. Journal of Accounting and Public Policy 26(6):689-704.
Crossref
|
|
|
|
Salaudeen YM, Eze UC (2018). Firm specific determinants of corporate effective tax rate of listed firms in Nigeria. Journal of Accounting and Taxation 10(2):19-28.
Crossref
|
|
|
|
Santosuosso P (2017). Rethinking the corporate tax base: evidence of the relationships between cash flow and net income. Corporate Ownership and Control 15(1):100-107.
Crossref
|
|
|
|
Siegfried J (1972). The relationship between economic structure and the effect of political influence: Empirical evidence from the corporation income tax program. Unpublished doctoral dissertation (University of Wisconsin)
|
|
|
|
Stamatopoulos I, Hadjidema S, Eleftheriou K (2019). Explaining corporate effective tax rates: Evidence from Greece. Economic Analysis and Policy 62:236-254.
Crossref
|
|
|
|
Vandenbussche H, Crabbé K, Janssen B (2005). Is there regional tax competition? Firm level evidence for Belgium. De economist 153(3):257-276.
Crossref
|
|
|
|
Wang Y, Campbell M, Johnson D (2014). Determinants of effective tax rate of China publicly listed companies. International Management Review 10(1):10-20.
|
|
|
|
Wilkie PJ, Limberg S (1993). Measuring explicit tax (dis)advantage for corporate taxpayers: An alternative to average effective tax rates. Journal of the American Taxation Association 15(1):46-71.
|
|
|
|
Wilson JD (1999). Theories of tax competition. National Tax Journal 52(2):269-304.
|
|
|
|
Zimmerman JL (1983). Taxes and firm size. Journal of Accounting and Economics 5:119-149.
Crossref
|