Full Length Research Paper

ABSTRACT
The Kenyan economy in the recent past has witnessed a considerable exit of multinational companies due to high-energy costs. Similarly, a comparative analysis among the East African community partners places the country among the list of those nations with high-energy charges levied on consumers. This phenomenon disadvantages the competitiveness of local industries while discouraging potential players. This is detrimental to the government efforts of ensuring economic growth and development. Such exits reduce investor confidence, and drives away potential investors. In addition, it adds more pressure on the government’s efforts to create more jobs, creation of more goods and services, increased household and national income. The objective of the study was to assess the effect of energy costs on attaining competitive advantage among manufacturing firms in Kenya. A quantitative research approach using survey research design was adopted by the study. Purposive sampling of 14 firms was done representing a total of 14 company representatives who filled the self-administered questionnaire. Data analysis was done using both descriptive statistics and inferential statistics. The hypothesis test showed that energy costs on electricity and petroleum had a significant effect on manufacturing firm’s efforts in attaining competitive advantage and was a significant predictor of competitive advantage in Kenya at 37.2% explanatory power. The results also showed that manufacturing companies in Kenya spend an average of 10.5% of their total income on electricity and petroleum products, thus reducing their competitiveness both nationally and internationally. The study posits that, since energy management practices yields significant benefits not just to the firms, but the society, environment and the government, there is a need to foster a cooperative approach in efficient energy use investment.
Key words: Energy cost, cooperative strategy, energy efficiency, competitive advantage, Kenya.
Abbreviation: UNIDO, United Nations Industrial Development Organization; ERC, Energy Regulatory Commission of Kenya; KAM, Kenya Association of Manufacturers; KNBS, Kenya National Bureau of Statistics; GOK, Government of Kenya; KES, Kenya Shillings; IEA, Institute of Economic Affairs; KIPPRA, Kenya Institute for Public Policy Research and Analysis; CCPs, Centre for Cooperation with the Private Sector; EBITDA, Earnings Before Interest, Taxes, Depreciation and Amortization; UNEP, United Nations Environmental Programme; CEOs, Chief Executive Officer’s; USA, United States of America.
INTRODUCTION
Energy efficiency refers to the installation of energy efficient technologies and implementation of practices that are designed to reduce energy wastage and eliminate energy losses in homes and business firms (Taylor, 2012). Manufacturing firms across the world incur huge energy costs through energy bills. The fundamental question is whether modern manufacturing firms practice energy efficiency or not. If they do, what are the significant benefits arising out of energy efficiency practices? Can energy efficiency practice be carried out cooperatively with other industries? Can the gains assist a firm in attaining competitive advantage? In modern economies, if the above significant questions are adequately addressed, then a sustainable competitive firm can be fostered. In 2013, the U.S. was just 39% efficient in energy use; this implies that 61% of the firms and households did not practice energy efficiency (Fischer, 2013). Bai (2013) observed that 41% of all global firms considered energy efficiency management as an extremely important endeavor to their firms. However, 64% of these global firms focused on carbon reduction and not as a cooperative practice of energy efficiency as a strategy in attaining all firms’ competitive advantages. In addition, cost savings was noted to be the leading driver of all energy efficiency initiatives (Bai, 2013).
A study by McCoy et al. (2014) commissioned by the Australian government found that 72% of the sampled companies spent more than 10% of their total revenue on energy sources before interest, taxes, depreciation and amortization. It further revealed that businesses consider energy costs of 2 to 3% of sales revenue to be high. The same study also showed that companies that spend more than 3% on energy costs and profitability less than 10% are classified as having high exposure to energy costs while those that spend less than 3% with profitability greater than 10% are classified as low exposure companies. The study proposed the following classification with regard to energy costs:
Very high impact: Energy Costs is >15%
High impact: Energy Costs is between 3-15%
Medium impact: energy Costs is >1%
Low impact: Energy Costs is <1%.
The National Statistics publication of the United Kingdom notes that in UK, energy prices have been increasing steadily since 2004 (Johnson, 2012). Price increase on electricity and petroleum products erodes competitive strategies attained by firms; hence there is need for manufacturing firms to practice energy management in support of its competitive initiatives. The U.S.A Energy Information Administration in its Annual Energy Outlook predicted a continued energy price increase both for petroleum products and for electrical energy in the years to come (Conti, 2013). In this regard, there is need to practice energy management so as to reduce costs and transfer the gains to other firms’ competitive strategies.
Audrie (2008) stated that energy efficiency efforts in the US between 2002 and 2007 helped reduce 5% of the nation’s electricity demand and saved Americans $16 billion on energy bills, which is equivalent to 27 million cars. This is a tremendous achievement which if replicated by manufacturing firms in developing economies such as Kenya, can assist their firms’ attain an overall competitive performance. A study carried out by Singh (1995) stated that in countries such as Malaysia, Indonesia, Ghana, Zimbabwe, Colombia, and Turkey, the average energy costs from total income was not more than 10% and that firms would seek alternative sources of energy if the costs were too high. According to Beck and Chaves (2011) government taxes on energy efficient equipment are passed forward into a firm’s input costs. This has the net effect of increasing a firm’s product price and negating its competitiveness international markets.
Alegana (2014) also concurs with the argument that taxation in Kenya influences the choices that firms make in their investments quests. This implies that manufacturing firms may perform poorly in the international business environment and there is need for energy efficiency practices to be intensified so as to reduce the effects of taxation on firm’s efforts of attaining competitive advantage.
Energy Efficiency Practices in Kenya’s
In Kenya, Kirai (2004) presented findings of a study that showed poor uptake of energy efficiency practices by industrial firms. This owed to the fact that there was no assistance given by government to firms, low involvement by company CEOs, perception of expensive technology, and the size of firm as the challenges facing adoption of energy efficiency practices. Although, there was notable training of over 250 firms in efficiency practices, few firms invested in the exercise. The payback period for such practices was 1 year and 2 months. The study recommended seminars, awareness training, energy audits, and technology upgrades as the measures of promoting energy efficiency practices.
Under its Vision 2030, the Government of Kenya-GOK (2007) observed that the manufacturing and commercial sectors are dominated by electricity and petroleum energy sources while the traditional sector is dominated by wood. Energy costs are noted to be one of the critical challenges towards economic prosperity; hence, efficiency in these energy sources is essential. It is on this premise the Kenya Energy Regulatory Commission (ERC) published the Energy Management Regulations, 2012 which spelt out a raft of energy efficiency measures that consumers can implement on their firms or households with guidance from licensed auditors recommended by Energy Regulatory Commission (ERC). The government further recommends that for the country to attain economic prosperity, increase in energy management practices is essential. The current study proposes that with such significant attention given to energy efficiency practice, it should be a shared responsibility by all firms in attaining their individual competitive strategies.
The study by Kirai (2007) further established that the ever-increasing energy costs, severe lack of energy efficiency practices in Kenya, insecure energy sources and reliance on imported petroleum products are some of the challenges affecting the economy. His study focused on the entire economy and not on the manufacturing sector only. He also recommended for the energy sector continuous efficiency awareness and information sharing among players. The study also proposed guidelines, short courses, legal frameworks, and government support programs which can be instituted in all manufacturing firms to boost their efforts on energy efficiency and attaining their competitive strategies. The findings of the study indicated poor energy efficiency adherence with up to 30% energy losses among sector players for which Kenyan manufacturers are the largest consumers of electricity and fuel. The reluctance in the practice of energy efficiency practices renders the salient benefits of energy efficiency elusive. The study however did not address the ability of such practices being practiced by all firms to attain a firm’s competitiveness. United Nations Environment Programme (UNEP) (2011) observed that for efficient use of petroleum products by motor vehicles; the average consumption of diesel driven vehicles in Kenya was 1 L/11 km while consumption of petrol was 1 L/13.88 km. Consumption per kilometre in developed economies such as the US, Japan, China and European Union is lower at an average of 16.3 km/L, showing that the efficiency of their motor vehicles is higher than their Kenya counterparts (UNEP, 2011). A report by Kenya National Bureau of Statistics-KNBS (2012) showed that the manufacturing firms own fleets of vehicles which consume significant amounts of petroleum products and that most of its fleet are not fuel efficient due to age factor.
The average age of vehicles driven in Kenyan roads is 15 years and their efficiency erodes as it ages. American vehicles have a road lifespan of 11.4 years, European Union is less than 5 years while Japan it is between 7-8 years. In Kenya, the average road usage is double the world standard and three times the average of the most efficient road transport systems (Kenya Motor Industry Association, 2014). The Association asserts that when vehicles get older, they consume more fuel, and become inefficient in energy usage, thus increasing operating costs. In their recommendations, they propose the use of the newest possible efficient technologies in their fleet of motor vehicles. Energy efficiency is one of the core functional strategies as noted by Hill and Gareth (2007). Increasing energy prices erodes Kenya’s competitiveness in international trade (Kenya Association of Manufacturers (KAM), 2013). It is therefore evident that manufacturing firms which use much of electrical and petroleum energy for most of their processes bear the burden of being less competitive in both national and international economies.
Manufacturing sector in Kenya
There are strong pointers that manufacturing firms in Kenya end up paying high energy costs occasioned by energy wastage, inadequate supply and continuous instability in prices (Energy Regulatory Commission, 2012; Kirai, 2004; CCPs, 2013; KAM, 2015). This erodes their competiveness in national, regional and international markets, as well as reducing their profit margins. Olingo (2016) contends that high power costs are pushing manufacturers out of Kenya to other countries such as Egypt, South Africa and Ethiopia. The report shows that Sameer Africa, Cadbury, Eveready, Procter and Gamble, Reckitt Benckiser, Johnson and Johnson, Bridgestone, Unilever and Colgate Palmolive have left the Kenyan market for Egypt and South Africa, where electricity costs are lower. In Kenya, the cost of electricity ranges from KES 15-17 per kWh compared with Uganda’s KES. 4 per kWh; Tanzania’s KES.12 per kWh; Egypt’s KES 11 per kWh; Ethiopia’s KES 9 per kWh and South Africa’s KES 6 per kWh (Wakiaga, 2017; Kenya Institute for Public Policy Research and Analysis (KIPPRA), 2016).
RESEARCH AND METHODOLOGY
This study carried out in Nairobi County adopted a quantitative research approach, using a survey research design. The data were collected using a self-administered questionnaire (Annex 1) and analyses were made using both descriptive and inferential statistics. It was then presented using tables. The study carried out a multi-stage sampling that involved purposive sampling of all the 14 manufacturing companies, and a census of all 14 member of management from the 14 manufacturing companies.
RESULTS AND DISCUSSION
Firm’s annual energy costs
Table 1 shows that costs of electricity and petroleum were relatively high at an average of  = 10.5%. This means that majority of manufacturing companies spent a high percentage of their gross revenues on electricity and petroleum products. Also, the Standard deviation 𜎠= 1.25797, showed that costs on electricity and petroleum were fairly diverse among firms in the manufacturing sector. This implied that there are strong indicators for energy costs to decrease or increase depending on companies’ desire to practice energy management and vice versa. It should be noted that there is tendency for such changes in cost savings to differ from one nation to the other due to historical development of a country, transparency of government regimes, composition of the energy supply and demand, differences in end uses, and in political agendas (The Regulatory Assistance Project, 2012).
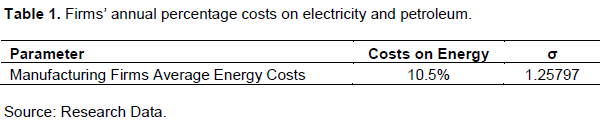
The study findings concur with the findings of Henri et al. (1999) who noted that firms have limited knowledge on newer technologies, and usually spend less finance on energy efficient technologies or related strategies which in turn increases consumption and thus costs. However, it disagrees with the findings of Singh (1995) who showed that in countries such as Malaysia, Indonesia, Ghana, Zimbabwe, Colombia, and Turkey, the average energy costs from total income by manufacturing firms was not more than 10% of total revenue before EBITDA; while in Kenya, the average costs is significantly high at 10.5%. This implies that manufacturing firms in Kenya spend a high percentage of its revenues on energy compared to other competing firms on a global perspective and that energy inefficiencies are significantly high.
Findings by ERC (2013) show that manufacturing firms are aware of rising energy costs and the implications of energy management with regard to production costs. However, from the study findings, the high electricity and petroleum costs reveal that manufacturing companies in Kenya have not taken steps to mitigate the high costs. The findings are also in agreement with ERC (2013) which showed that in Kenya, energy management practices can lead to firm’s savings of between 10 to 20% in energy usage with a payback period of less than 2 years.
The study findings are further supported by the findings from Australia by McCoy et al. (2014) commissioned by the Australian government which found that 72% of the sampled companies spent more than 10% of their total revenue on energy sources. It further revealed that businesses consider energy costs of 2 to 3% of sales revenue to be high. The above study carried out in Australia also revealed that energy cost of between 3-15% of total revenue is considered to be of “high impact”, hence the costs by Kenyan manufacturers of 10.5% falls under this category and that energy management practices can reduce this to a moderate impact or low impact of less than 3%. With an average costs of 10.5%, the findings also agree with the findings of McCoy et al. (2014) that found 72% of firms in Australia spend an average of more than 10% of their revenues on energy sources. Although, the current study only focused on electricity and petroleum costs being the highest amount of resource utilized by manufacturing companies, the same is also valid for manufacturing companies in Australia.
Correlation analysis
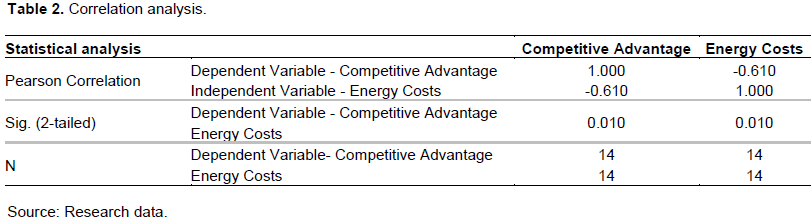
Pearson’s correlation coefficient is r = -0.610 at p = 0.05 (2-tailed) between energy costs and competitive advantage as shown in Table 2. This implied that there is a strong negative and significant correlation between energy costs in attaining competitive advantage. It implied that, increased energy costs negatively affected the competitiveness of a firm at local, national and international markets and a decrease in energy costs increased a firm competitiveness significantly. The finding is supported by Willox (2012) who observed that more than 25% of firms incur high-energy expenses from (electricity, gas and other fuels) in Australia and this is not different in the manufacturing sector in Kenya. He further found that on average, 27% of companies he studied spent the equivalent of more than 2% of their sales revenue on energy, and 73% of the firms spent 2.5%. The report asserted that business expenses on energy as a percentage of turnovers increased between 2008 and 2011 and the trend was expected to continue. For the manufacturing sector in Kenya to attain and retain a competitive edge, there is need for energy management practice so as to lower the costs further. According to UNIDO (2012), high-income consumers of petroleum, electricity and related sources energy spend between 5 to 10% of their income and this is a replica of the current scenario in the Kenyan manufacturing sector, where energy expense stands at 10.5%. In this case, the study considered the expenses as of high impact which may hurt the firms’ competitiveness in the long run both at local, national and international business economies (McCoy et al., 2014).
Regression analysis
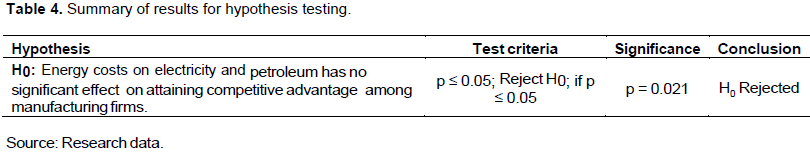
The correlation results as shown in Table 2 revealed a strong and negative relationship which showed that energy costs had a negative effect on competitive advantage. The finding was statistically significant at p = 0.05. From Table 3, the regression results revealed that energy expenses on electricity and petroleum had an overall significant relationship with competitive advantage at 5% significance level (p-value = 0.021). From the regression results, the study therefore rejected the null hypothesis at p-value = 0.05 and concluded that there was a statistically significant effect of energy costs on competitive advantage among manufacturing firms.
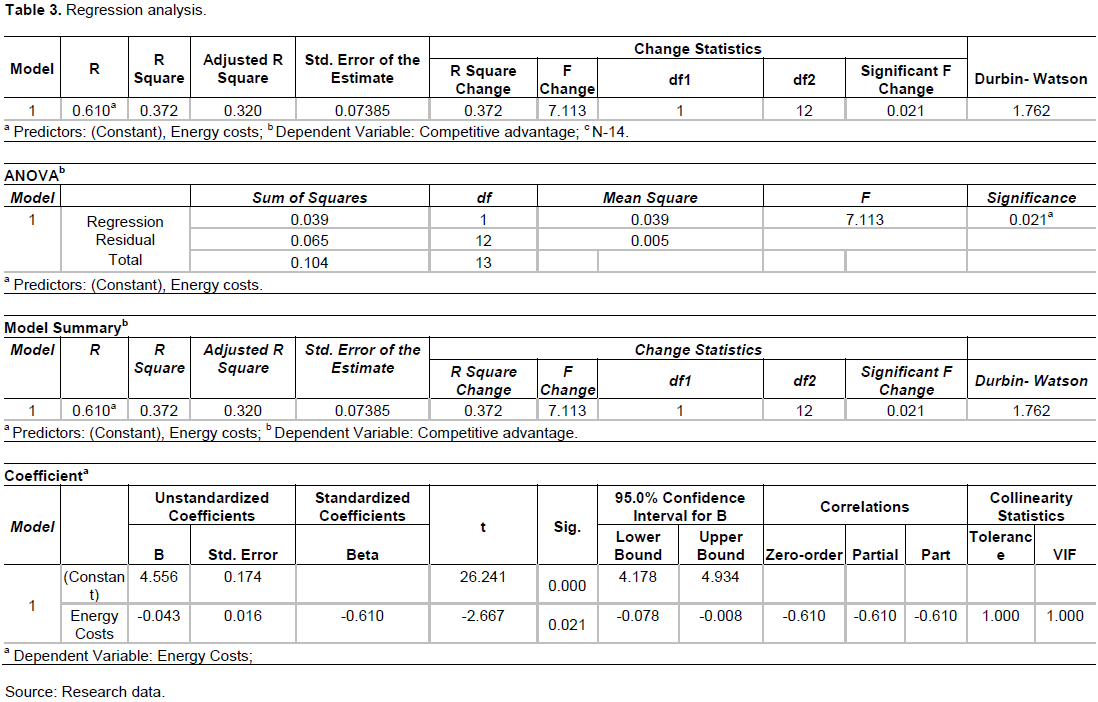
The regression results showed that 37.2% change in competitive is explained by the firm’s energy costs; hence, making cooperative energy efficient programs a strategic approach for enhanced firm competitiveness. The coefficient result showed a one percentage increase in energy costs led to a 61% decrease on competitive advantage and vice versa. This implied that an increase in energy expenses affects the competitiveness of a firm negatively and a decrease in energy expenses increased competitiveness of a firm. The average energy expenses as shown in Table 1 by manufacturing companies in Nairobi were high and stood at 10.5% of total revenues.
With such high energy expenses, manufacturing companies are at risk of losing the gains that otherwise would have been transferred to other competitive strategies so as to attain competitiveness among rival firms.
Energy management practices also enable a company to reduce their energy cost as a proportion of total cost. This highlights the need for energy management practices in the manufacturing sector. McKane (2011), as cited by IEA (2012) and the Retail Industry Leaders Association report (2013) as cited by Jamieson and Hughes (2013) argued that the practice of energy management has a pay-back period of 3 years with reduction on energy consumption costs of between 10 to 30%. Kenyan firms thus need to enhance its energy management practices if they are to enjoy the resultant benefits and thus lead them in attaining a competitive edge.
In addition, the study results also agree with those from Australia by Willox (2012) who showed that more than 25% of manufacturing firms incur high energy expenses from (electricity, gas and other fuels). He further found that, on average 27% of companies he studied spent the equivalent of more than 2% of their revenues on energy, and 73% of the firms spent 2.5%. The report asserted that expenses on energy as a percentage of turnovers increased between 2008 and 2011 and the trend was expected to continue. This is consistent with the current study findings with an average consumption of 10.5% which causes a significant reduction on revenues. The report further showed that in Kenya, energy costs and reliability have remained the biggest challenge to be overcome. In contrast, this study also shows that manufacturing companies in Nairobi spend a high percentage of its income on energy as compared to the manufacturing companies in developed countries that have embraced the use of technology and have implemented energy management practices (Hartmann and Huhn, 2009; Victoria, 2007; Willox, 2012)(Table 4).
Summary of hypothesis tests
The study thus revealed that energy costs had significant effect on competitive advantage and firms are obligated to embed energy efficiency practices in their strategic initiatives to attain competitive advantage.
CONCLUSION
The study results from Table 1 showed that energy costs on electricity and petroleum product as a percentage of firm revenue were high at 10.5%. Tables 2 and 3 revealed that energy costs had overall negative statistically significant relationship with competitive advantage at 5% significance level (p-value = 0.05). This implied that an increase in energy expenses led to a decrease in competitive advantage and vice versa.
Carbon Trust (2011) stated that energy efficiency practice yields a cost savings of 5 to 25% and this should be encouraged in developing countries so as to remedy the current scenario. The finding is further supported by Kiema (2014) who showed that one unit of energy saved, corresponds to a saving of three units generated as a result of implementation of energy efficiency practices and that in Kenya, energy costs and reliability has remained the biggest challenge to be overcome. Similar findings in USA were attained by Jasinowski (2000). The findings showed that nearly 60% of manufacturers in USA foresaw electricity management as providing a saving of up to 20% on their energy costs. Further, Jamieson and Hughes (2013) argues that the practice of energy efficiency has a pay-back period of 3 years with reduction on energy consumption costs of between 10 to 30% of firm revenues.
Findings by Kinyanjui (2015) showed that the Kenyan government should reduce the production costs for manufactured goods by reducing energy tariffs and tax levied on petroleum products. This has been identified as a factor making manufacturing companies to exit the local markets to external markers such as Ethiopia, Egypt and South Africa (Olingo, 2016).
Based on the study findings, the study concurred that energy management practices can be practiced cooperatively through non-equity strategic alliance among manufacturers and government so as to boost the competitiveness of firms operating in the country at national and international markets. Such pooling of resources will help cushion the companies from the high costs of energy, capital intensive equipment and related technologies such as solar power, wind power among other forms of green energy.
Non-equity alliances will enable manufacturing firms to share unique resources and capabilities in energy technologies, knowledge, equipment and machines that will propel them to greater competitive advantage.
RECOMMENDATIONS
The current business environment is evolving and opportunities continuously arise that can enable a firm to leverage competitive advantage. The study recommends the need for a dynamic change where firms continuously share and adopt energy management practice that leads to enhanced competitive advantage. A cooperative strategic approach is gaining thrust and non-equity strategic alliances among firms will enhance resource pooling, and knowledge sharing. Such efforts will encourage investment in high-energy efficient technologies that individual firms may not afford on their own. Similarly, government support on tax rebates and waivers on energy efficient technologies is highly encouraged.
CONFLICT OF INTERESTS
The authors have not declared any conflict of interests.
REFERENCES
|
Alegana MH (2014). The Effect of Tax Incentives on Economic Growth in Kenya. Research Project Submitted In Partial Fulfillment of The Requirements For The Award of The Degree in Masters of Science In Finance, University Of Nairobi. |
|
|
Audrie H (2008). Energy efficiency in buildings. Climate Leaders Conference. Washington: U.S. |
|
|
Bai M (2013). Energy efficiency indicator survey: A global analysis of trends in energy efficiency. Johnson Controls. A paper presented at the world workplace 2013 conference and exhibitions, September, 2013 by Johnson Controls at Shanghai Marriot Hotel. Shanghai: China. |
|
|
Beck S, Chaves A (2011). The Impact of Taxes on Trade Competitiveness. Department of Economics, University of Delaware, Newark. |
|
|
Carbon Trust (2011). Energy management: A comprehensive guide to controlling energy use. London. |
|
|
Centre for Cooperation with the Private Sector (CCPS) (2013). Kenyan manufacturers save costs by improving energy efficiency, A business case in corporate social responsibility. Journal of Deutsche Gesellschaft für Internationale Zusammenarbeit Bonn. |
|
|
Conti J (2013). Annual Energy Outlook. A Publication of the U.S. Energy Information. |
|
|
Energy Regulatory Commission (ERC) (2013). Energy Performance Baselines and Benchmarks and The Designation of Industrial, Commercial and Institutional Energy Users in Kenya. |
|
|
Fischer B (2013). Energy efficiency: Greentechmedia. |
|
|
Government of Kenya (GOK) (2007). Kenya Vision 2030, The popular version. National Economic and Social Council of Kenya, Nairobi. Kenya. |
|
|
Hartmann A, Huhn W (2009). Energy: A key to competitive advantage-New sources for growth and productivity. McKinsey & Company, Inc. |
|
|
Henri LF, Erik TV, Peter N (1999). Energy saving by firms: decision-making, barriers and policies. Amsterdam. Department of Spatial Economics, Vrije Universiteit. |
|
|
Hill J, Gareth C (2007). Strategic management theory (7th ed.). Boston, USA: Houghton Mifflin Company. pp. 3, 6, 77, 110-126. |
|
|
Institute of Economic Affairs IEA (2012). Energy Management Programmes for Industry: Gaining Through Savings. Institute for Industrial Productivity. International Energy Agency. |
|
|
Jamieson M, Hughes D (2013). A practical guide to sustainability and energy management in retail environments. Schneider Electric. White Paper Revision 1. USA. Schneider Electric. |
|
|
Jasinowski JJ (2000). Energy efficiency toolkit for manufacturers: eight proven ways to reduce your costs. National Association of Manufacturers. USA. |
|
|
Johnson R (2012). Industrial Lighting Best Practices. US Lamp, Inc. |
|
|
Kenya Association of Manufacturers (2013). High Energy Prices erodes Competitiveness in trade. The Standard Newspaper, March 8 p.33. |
|
|
Kenya Association of Manufacturers (2015). KAM Sectors. |
|
|
Kiema M (2014). 10th Energy Awards celebrate over Sh10bn in energy savings. |
|
|
Kinyanjui S (2015). Response by Kenyan Firms to Globalization: A Survey of Manufacturing Firms in Nairobi and Athi – River. Unpublished Thesis. Jomo Kenyatta University of Agriculture and Technology. Nairobi, Kenya. |
|
|
Kenya Institute for Public Policy Research and Analysis (KIPPRA) (2016). Kenya Economic Report 2016. Kenya Institute for Public Policy Research and Analysis (KIPPRA). Nairobi, Kenya. |
|
|
Kirai P (2004) Removal of barriers to energy efficiency and conservation in small and medium scale enterprises (SME) in Kenya. Industrial energy efficiency project Kenya. Presentation at UNFCCC mitigation in Buenos Aires. |
|
|
Kirai P (2007). Promotion of energy efficiency in industries: experiences from Kenya. Kenya Association of Manufacturers. Paper presented at the UN Forum on Energy Efficiency and energy security in Seoul, Korea 17-18 December 2007. Nairobi: Kenya. |
|
|
Kenya Association of Manufacturers (KNBS) (2012). Kenya Facts and Figures. Kenya National Bureau of Statistics Nairobi. Kenya. |
|
|
McCoy K, Eve T, Marcia M (2014). Energy management and company competitiveness. Melbourne, Victoria. Climate Works Australia. |
|
|
Olingo A (2016). Cheap Imports, High Power Costs Pushing Manufacturers out of Kenya. The Standard. |
|
|
Singh EH (1995). Energy Price Increases in Developing Countries. Washington: The World Bank, Policy Research Department. |
|
|
Taylor M (2012). Energy efficiency and alternative energy programmes. Legislative Analyst's Office, CA. p3. |
|
|
The Regulatory Assistance Project (2012). Best Practices in Designing and Implementing Energy Efficiency Obligation Schemes. RAP publications, |
|
|
United Nations Environment Programme (UNEP) (2011). Developing a National Vehicle Fuel: Economy Database & Baseline: UNEP. Kenya United Nations Industrial Development Organization (UNIDO) (2012). Energy for sustainable development: Policy options for Africa. UN- Energy/Africa publication to CSD15. United Nations Economic Commission for Africa. |
|
|
Victoria (2007). Energy Management in Practice Manual. Melbourne, Victoria. Sustainability Victoria. |
|
|
Wakiaga F (2017). Manufacturing Priority Agenda 2017. Driving Industrial Transformation for Job Creation and Inclusive Economic Growth- Kenya Association of Manufacturers. Nairobi, Kenya. |
|
|
Willox RT (2012). Energy shock: pressure mounts for efficiency action. Australian Energy Group report, pp. 6-12. |
|
Copyright © 2024 Author(s) retain the copyright of this article.
This article is published under the terms of the Creative Commons Attribution License 4.0


