Full Length Research Paper

ABSTRACT
The Kenyan government strives for every Kenyan to have access to water and sanitation services, primarily through Water Works Development Agencies (WWDAs). This paper sought to understand the effect of resource allocation on service delivery by WWDAs in Kenya. A census of all the agencies in Kenya was done, while a sample of 80 employees across these agencies responded to the questionnaire. Primary data were collected through questionnaires; data were cleaned up and coded into the Statistical Package for Social Sciences. Descriptive statistics measures of central tendency were used to analyze and interpret the data, while skewness and kurtosis was used to confirm the normal distribution of data. Inferential statistics in ordinal regression were tested for a possible relationship between the independent and dependent variables. Results from the evaluation revealed that resource allocation had a significant effect on service delivery of WWDAs in Kenya. According to the findings, the dependent variable and resource allocation had a strong positive and significant association (service delivery). As a result, this study established that resource allocation influenced the delivery of services by Kenya’s WWDAs in a positive and significant way. The study concluded that any variability in resource allocation results in a corresponding variability in service delivery by WWDAs in Kenya.
Key words: Resource allocation, service delivery, strategy implementation.
INTRODUCTION
The government’s drive to improve water services in Kenya started in 1967. By 1970, Kenya had achieved high urban water supply service coverage but due to rural-urban migration, water delivery services in the urban areas was strained. Even with interventions such as policies and regulatory measures, the sector continues to face challenges that range from water scarcity, water quality, population pressure, climate change etc. (Chepyegon and Kamiya, 2018). These challenges have worsened in developing countries like Kenya due to rapid population growth, economic development and urbanization which has made it so difficult to address the issue (Mulwa et al., 2021). As a result, access to safe drinking water and basic sanitation has become a global human rights issue in the twenty-first century. Although the United Nations (UN) has been putting measures to address the world’s water crisis for a long time, water coverage remains a concern for various countries around
the world, including Kenya (World Economic Forum, 2019). For this reason, the Government of Kenya under the Water Act 2016 established the Water Works Development Agencies (WWDAs) as state corporations under section 152 of the Water Act 2016. The agencies formed part of the reforms in the water sector. The Act in section 68 provides the functions of the WWDAs which were established through the Kenya Gazette Notice No. 28 of 2019. The agencies are eight and they include; Tana, Athi, Rift Valley, Lake Victoria North, Lake Victoria South, Tanathi, and Northern (Water Act, 2016). The main purpose of these agencies is to build, maintain, and manage national public water systems. In addition, they operate the waterworks and offer water services until they are given over to the county government, joint committee, authority of county governments, or water services providers’ whose jurisdiction or supply the waterworks are located (Water Act, 2016). Through the WWDAs, the Kenyan government aims at improving water coverage by providing water and sanitation for all its citizens by the year 2030 under the social pillar of Kenya Vision 2030 (Government of the Republic of Kenya, 2007). However, current access to water is low. Only 26% of the population are served by regulated providers, and the remaining 74% rely on small private operators, community-managed systems, or self-supply (Kenya Markets Trust, 2019). Hence, water supply in Kenya is unreliable with mimimal coverage. Although, the United Nations (UN) has been putting in measures and providing resource support to address the world’s water crisis for a long time, water coverage remains a concern for various countries around the world including Kenya (Mwihaki, 2018). In effect, this has caused a look at service delivery by WWDAs as one avenue that may explain this discrepancy. In order for WWDAs to achieve the Kenya Vision 2030 offer effective service delivery, resource allocation is a major factor. Little research work has been done to uncover how resource allocation affects the service delivery of WWDAs. Towards this cause, this paper examines literature, reviews, studies, reports, and other relevant information regarding WWDAs service delivery in relation to resource allocation. The paper further examines opportunities for improvement in WWDAs and offers a solution proposal. Findings from this study will assist policymakers and government agencies in creating policies to manage the country's water resources. In addition, this study will assist the managers of WWDAs to understand how strategy implementation affect their service delivery and hence they will know the better way to deliver water services to the Kenyan citizens.
Statement of the problem
The Government of Kenya has put in place measures to ensure that everyone has access to water and sanitation. This was also included under the social pillar of Kenya Vision 2030, where water access and coverage is expected to be universal to all Kenyans by 2030 (Government of the Republic of Kenya, 2007). From progress reports, water coverage was at 57% as of 2018, with a 100% target projection and universal access by 2030 (Kenya Markets Trust, 2019). This shows a slow progress from the previous years, that is 48% in 2010 and 55% in 2017 (Arnold, 2018). This does not reconcile with WWDAs mandate which was to primarily provide water services. Their main function was to carry out this mandate, have strategic plans with a detailed strategy for increasing water and sanitation access but still water coverage, access and sanitation provision remains below the target levels. In effect, this has caused a look at service delivery by WWDAs as one avenue that may explain this discrepancy. In order for service delivery to be as effective, there needs to be a considerable amount of resource allocation. Resource allocation is necessary for effective service delivery and most organizations cannot gain maximum performance due to lack of adequate resources. Resources especially financial resources, positively influence organizational performance (Elbanna and Abdel-Maksoud, 2020). When organizations fail to employ resources, the results are unnecessarily high operation costs, uncoordinated public activities, and failure to attract and keep experienced and skilled personnel in the position (Sadiq, 2019).
LITERATURE REVIEW
Resource based theory
The paper adopted the Resource-Based Theory to assess the impact of resource allocation on service delivery by Kenya’s WWDAs. The theory was introduced by Wernerfelt in 1984 where an organizations competitive advantage is defined by the resources it can access and exploit rather than its ability to manage the environment (Ahmed and Othman, 2017). Resources as defined by Barney Jay in 1991 include; ‘all assets, capabilities, organizational processes, firms‘ attributes, information, and knowledge controlled by the firm.’ (Luján Salazar, 2017). These resources further comprise organizational assets/capabilities. They include shared knowledge, employee’s competency, capital equipment, employer brand and organizational reputation and are great sources of competitive advantage and hence enhance organizational performance ((Ahmed and Othman, 2017). Firms have a collection of assets, competences, processes, skills, and knowledge, that are valuable, rare and difficult to copy and substitute that provides them a competitive advantage (Ande et al., 2018). Therefore, firms use their unique resources and capabilities to execute activities in order to ensure value maximization. The basis of the theory is that a firm has resources and capabilities which it can translate to a strategic advantage (Mwikya and Khamah, 2020). Therefore, the success of WWDAs lies in their ability and capacity to manage their resources effectively so as to improve service delivery. Understanding the resources available to an organization and how they can be leveraged to enhance goal attainment is key to better perforamnce (Karama et al., 2019). Therefore, it plays an instrumental role in establishing how WWDAs employ their financial resources to improve their attainment of service delivery goals. According to the resource-based perspective, managers must generate and secure strategic resources that are valued, uncommon, non-imitable, and non-substitutable in order to gain competitive advantage. But the resource-based perspective does not explain how managers may accomplish this.
In addition, the value creation idea that has been proposed based on this theory regarding valuable resources implies that the theory is self-verifying and is not empirically testable (Utami and Alamanos, 2022). The applicability of the resource-based paradigm is also limited, according to the authors. This is because the concept itself cannot be used in facing market challenges that are rapidly changing or dynamic, due to the static nature of the theory, and requires a long process of building the resources needed (Widjaja and Yuga, 2020). Hence, smaller enterprises are excluded from the resource-based paradigm since sustained competitive advantage cannot be built on static resources, and thus fall outside of its scope. The theory displays elements of strategy implementation that influences service delivery, especially resource allocation. As a theory of competitive strategy, it explains “competitive heterogeneity”: differences in performance among firms and the underlying heterogeneity that explains these differences. Competitive advantage occurs only when there is resource heterogeneity (different resources among organizations) and resource immobility (competing firms’ incapacity to get resources from other enterprises (Stoelhorst, 2021). If a resource is not totally mobile (that is, it cannot readily move between firms) or if a firm faces a large cost penalty in producing, acquiring, or employing it, the resource is likely to be a source of sustained competitive advantage. Any benefits received by copying or substituting a resource may be transient (Campbell and Park, 2017).
Resource allocation and service delivery
Service delivery is getting services as effectively and as quickly as possible to the intended recipient. In most instances, it implies a degree of excellence on the part of the organization (Karanja and Juma, 2020). Mengich and Kiptum (2018)investigated the impact of strategic plan resource allocation on quality service delivery in Kenya’s sugar producing enterprises in the Western Region of Kenya. The findings showed that allocating strategic plan resources to quality service delivery in the sugar production business had a considerable positive impact (p-value 0.000). According to the findings, allocating skilled human resources in strategy implementation to improve service quality, allocating financial resources to intended strategies to ensure quality service delivery, allocating adequate inventory in strategy implementations, and allocating information technology improve the service quality of the organization. In addition, Scott (2019)investigated the impact of public spending management systems on service delivery in the public sector using the case of Ghana’s District Assemblies. According to the findings, the District Assemblies have procedures, structures, regulations, and policies in place to govern their expenditure management approaches. There were also hints that some expenses were given higher priority than others. While DA personnel rated the District Assemblies’ existing spending management practices as efficient or very efficient, key informants noted that the District Assemblies’ recurrent expense was almost always greater than the development expenditure. This tendency, according to the informants, made it difficult for the assembly to manage financial resources intended for public service initiatives effectively. As a result, the study indicated that district assembly’ public expenditure management procedures had a major impact on service delivery in Ghana. Lemarleni et al. (2017)looked into the effects of resource allocation on strategy implementation at the Kenya Police Service in Nairobi County. The study’s precise goals were to see if financial resource allocation, human resource allocation, and technical resource allocation all impact strategy implementation in the Kenyan police force. The analysis found that the Kenya Police Service’s financial resource allocation is woefully inadequate for implementing strategy and related activities. As a result, financial resources are insufficiently and improperly dispersed, hampering strategy implementation efforts and resulting in shortcomings in Kenya police service delivery and a halt in the police reform process. The study also found that the Kenyan police force's human resources are under-empowered in terms of professional growth and participation in plan implementation. In addition, the survey found that the Kenya Police Service does not fully embrace information and communication technology. The study found that plan execution is to blame for the Kenya Police Service's observed improvements in key areas, including increased internal process efficiency‚ improved service delivery, and lower crime rates. The Service's strategy implementation needs to be strengthened even more.
As a country, Kenya aims to provide water and sanitation for all its citizens by the year 2030 under the social pillar of Kenya Vision 2030. To achieve this, WWDAs need to allocate a considerable amount of resources to deliver these services. A research conducted by Ongeti and Machuki (2018)on Kenyan State owned corporations shows that there is a significant relationship between organizational resources and performance. Hence they are a prerequisite for a smooth operating organization. Thus, they need to be allocated carefully and generously. On the downside, allocating these resources requires careful practice by an organization to acquire them. Some examples of organizational resources are technology, people, and finances. These organizational resources are crucial to the success and growth of an institution (Ongeti and Machuki, 2018).For a firm to reach optimum performance and improve on service delivery, resource allocation needs to be a top priority. Besides resource allocation, service delivery is essential as it increases the worth of clients (Rasul and Rogger, 2018). Hence, service providers should know what consumers desire from public services to improve service delivery. The service providers should be empowered with what they need, including resources, to offer the best services (Zeithaml, 2018). Depending on the type of service offered, each service has a primary intervention to transform the customer. Hence, delivering quality service to the citizens is critical for the success and survival of any public organization in today’s competitive business environment.
METHODOLOGY
A cross-sectional research design was used for this study. It entails the researcher gathering data from a large number of people at the same time while maintaining control over the factors. It is recommended because it provides a detailed description of a scenario and guarantees that data collection is conducted without bias (Zangirolami-Raimundo et al., 2018). The study's target population was 434 workers from Kenya’s WWDAs. All the eight water agencies nationwide were targeted, hence a census for the unit of analysis. The study sampled 80 respondents (Heads of Departments and Divisions) as they were deemed to have a direct responsibility in strategy implementation. The study managed to collect an excellent response rate of 88.75%, using questionnaires deemed sufficient for the data analysis to proceed; they provide enough evidence for drawing study conclusions. Data from questionnaires administered were edited, structured, and sorted before being coded into a data usable table in the Statistical Package for Social Sciences (SPSS Version 26 for analysis. The data were analyzed using a variety of statistical methods, including descriptive statistics, cross tabulations, and ordinal logistic regression, all of which were tested against their respective assumptions. The statistical parameters obtained by the software were displayed in the tables for easy comprehension and interpretation. The data were evaluated using inferential statistics such as ordinal regression to see if there was a relationship between the independent and dependent variables. The researcher was able to draw conclusions from the responses based on the statistical data.
RESULTS
The study's major goal was to understand the effect of resource allocation on service delivery by Kenya’s WWDAs.
Response rate
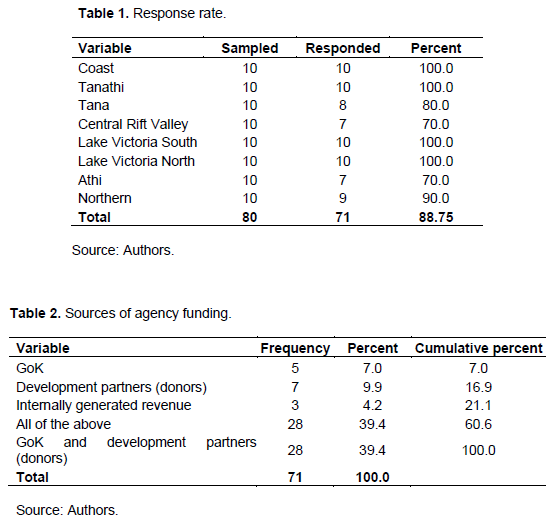
The study distributed 80 questionnaires to the respondents from the eight (8) WWDAs, of which 71 were completed and returned to the researcher; and the data analysis was based on those 71 questionnaires. As seen in Table 1, this equated to an 88.75 percent response rate. All the responses by the respondents (Unit of observation) were consolidated into one forming the unit of analysis (the WWDAs).
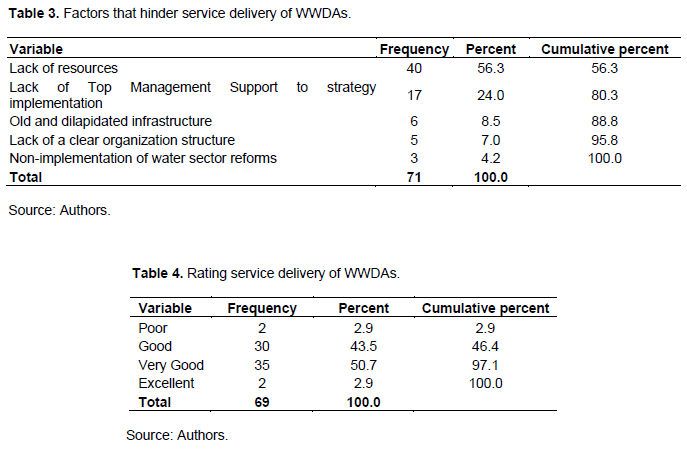
Descriptive statistics for resource allocation
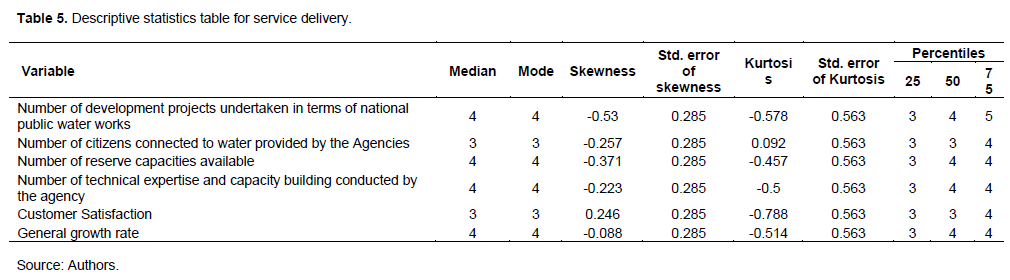
Table 2 summarizes the outcomes of the study, which tried to identify the sources of agency funding. Table 2 indicates that 7.0% of the agency funding came from the Government of Kenya (GoK), 9.9% said the source of agency funding was the development partners (Donors), 4.2% said internally generated revenue, 39.4% said all of the above (that is GoK, Donors and Internally Generated Revenue); while another 39.4% said GoK and development partners (Donors). The study's next goal was to identify obstacles that could block Kenya’s WWDAs from providing services. The findings are summarized in Table 3. The findings of the study, which aimed to assess the rating of Kenyan WWDAs' service delivery, are summarized in Table 4. In Table 4, most of the respondents (50.7%) assessed the service delivery of Kenya’s WWDAs as very good, 43.5 percent rated it as good, 2.9 percent said it was excellent, and another 2.9 percent said it was terrible. In Table 5, majority of the respondents rated number of development projects undertaken in terms of national public water works as very good (median, mode = 4, 4 and skewness, kurtosis = -0.53 and -0.578 respectively), majority rated number of citizens connected to water provided by the Agencies as good (median, mode = 3, 3 and skewness, kurtosis = -0.257 and 0.092 respectively), majority of the respondents rated number of reserve capacities available as very good (median, mode = 4, 4 and skewness, kurtosis = -0.371 and -0.457 respectively), majority rated number of technical expertise and capacity building conducted by the agency as very good (median, mode = 4, 4 and skewness, kurtosis = -0.223 and -0.5 respectively), majority rated customers‘ satisfaction as good (median, mode = 3, 3 and skewness, kurtosis = 0.246 and -0.788 respectively), and majority of the respondents further rated general growth rate as very good (median, mode = 4, 4 and skewness, kurtosis =-0.088 and -0.514, respectively).
Crosstabulation of service delivery against resource allocation
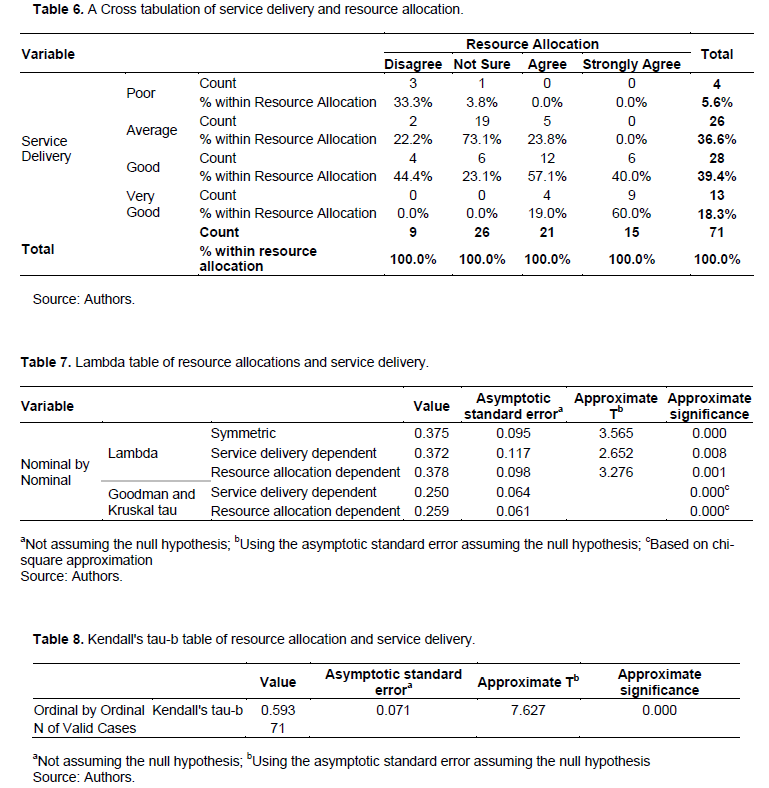
Table 6 displays the findings of the study's crosstabulation of service delivery vs. resource allocation.
Majority (73.1%) of those who said they were not sure on the Resource Allocation rated service delivery as average, 57.1% of those who agreed on the Resource Allocation rated service delivery as good, while majority (60.0%) of those who strongly agreed on the Resource Allocation rated service delivery as very good. The value of lambda (.372, p-value = .001 < 0.05) indicated in Table 7 shows that the independent variable, resource allocation had statistically significant relationship with the dependent variable, service delivery.
Reliability analysis
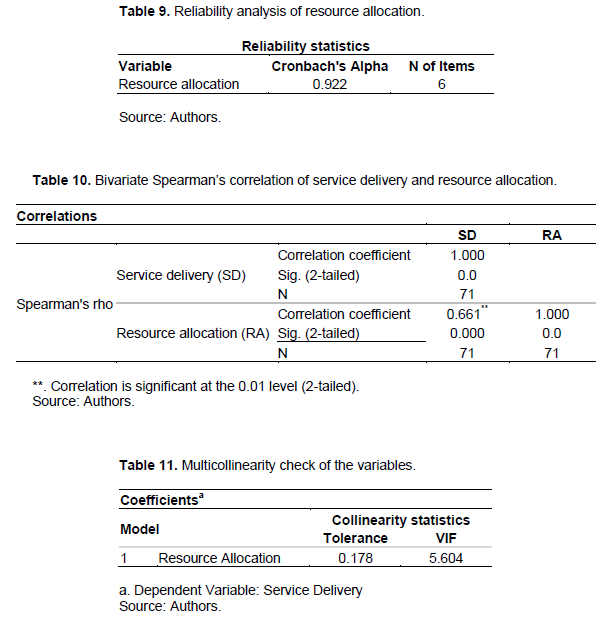
According to Taber (2018), Cronbach's Alpha reliability co-efficient was used as a measure of reliability. The Cronbach's Alpha reliability co-efficient was calculated using SPSS software to test reliability, and a value of 0.7 or higher was considered sufficient for further data analysis (Table 8). The variable resource allocation was found to be reliable at Cronbach's Alphas of above 0.7 as presented in Table 8. As a result, the data obtained had a high level of internal consistency, making it reliable for data analysis.
Descriptive statistics for resource allocation
The study generated a descriptive statistics table of resource allocation and the findings are summarised in Table 9.
Correlation between the variables
The researcher generated a Bivariate Spearman’s correlation between service delivery and resource allocation with the help of SPSS software. The results are listed in Table 10. Resource allocation (RA) had a strong positive and statistically significant (R = .661, at p-values =.000 < .05) relation with the dependent variable (Service Delivery) as shown in Table 10. This implies that a variability in resource allocation would result in subsequent variability in the dependent variable (Service Delivery) and the vice versa is true.
Ordinal logistic regression
Checking for the assumptions of ordinal logistic regression
Using ordinal regression, according to Harrell (2015), requires first ensuring that the data in question can be analyzed using ordinal regression. This entails testing for four assumptions that ordinal regression requires in order to get accurate findings. This also assures that the data understudy's results are not fictitious. According to one of the assumptions, the dependent variable should be assessed on an ordinal scale. This was ascertained by checking the way the data were entered in SPSS and ensuring that the measure selected was ordinal and further ensuring that the dependent variable data itself was ordinal. The second assumption involved checking whether the independent variables were continuous, ordinal or categorical. In this case, the study ascertained that the independent variables’ data were continuous. The third and fourth assumptions involved checking for multicollinearity as well as proportional odds that were both checked from tables generated from the dataset using SPSS. In the subsections that follow, the findings are presented and discussed.
Checking for multicollinearity
The researcher aimed to see if the dependent and independent variables had any multicollinearity. To establish whether or not there is multi-collinearity, the tolerance level and the variance inflation factor (VIF) diagnostic parameters are used (Leech et al., 2015). Table 11 summarizes the findings. Table 11 reveals that there was no multicollinearity existing between service delivery and independent variable, resource allocation because the VIF was less than ten.
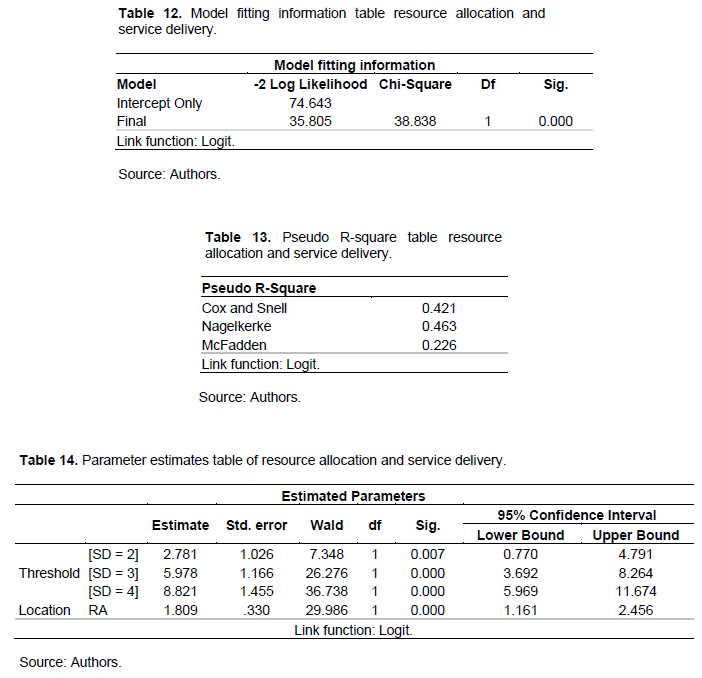
Ordinal logistic regression for resource allocation and service delivery
The results of an Ordinal Logistic regression research between the independent variable (resource allocation) and the dependent variable (service delivery) are presented in Tables 12 to 14. The Chi-Square statistic is 38.838 with a p-value of.000.05. The Chi-Square statistic is 38.838 with a p-value of.0000005, according to Model Fitting Information Table 9. As a result, the model seems to have a good fit with the data. The Pseudo R-Squares values derived from the data in Table 13 range from.226 to.463. The Nagelkerke's Pseudo R-Square has a range of 0 to 1, with a higher value indicating a greater influence of the independent factors on the dependent variable. Thus, from Table 13, resource allocation contributes .463 for every unit increase in the total variability of the dependent variable (Service Delivery). From the Parameter Estimates in Table 14, resource allocation was statistically significantly (β = 1.809, p-value = .000 < 0.05 threshold). This means that as the resource allocation increases the likelihood of service delivery increasing will also significantly increase and vice versa. The study rejected the H0: resource allocation has no significant influence on service delivery by WWDAs in Kenya. The results of the study showed that there was statistically significantly relationship between the independent variable (resource allocation) and the dependent variable (Service delivery).
DISCUSSION
The research objective was to examine the impact of resource allocation on service delivery by Kenya’s WWDAs. Resource Allocation demonstrated a positive and statistically significant (p.05) association with the dependent variable, according to the correlation analysis results (Service Delivery). As a result, a variability in resources allocation would result in a similar variability in service delivery by WWDAs in Kenya. The findings of this study corroborated those of Mengich and Kiptum (2018), who discovered that strategic plan resource allocation had a positive significant contribution to sugar manufacturing enterprises' quality service delivery in Kenya's Western Region (p-value 0.000).
CONCLUSION AND RECOMMENDATIONS
This paper sought to look into the impact of resource allocation on Kenya’s WWDAs' service delivery. According to the findings, the dependent variable and resource allocation had a strong positive and significant association (Service Delivery). As a result, this study established that resource allocation influenced the delivery of services by Kenya’s WWDAs in a positive and significant way. As such any variability in resource allocation results in a corresponding variability in service delivery by WWDAs in Kenya. ?Policymakers and government agencies can use the findings of this study in creating policies to manage the country's water resources. The study identified the areas of weakness in service delivery by WWDAs and in effect, the government can use them to develop policies for water resource management and provision in the country. More specifically the results of this study would help the Ministry of Water, Sanitation and Irrigation as the main policy makers in the water sector in devising policies that would help in improving service delivery to Kenyan citizens. The study found that lack of resources is a challenge in the delivery of service by WWDAs in Kenya. Therefore, this study recommends that the WWDAs in Kenya should be empowered with sufficient resources so as to enable it provide adequate and proper services to the citizens.
CONFLICT OF INTERESTS
The authors have not declared any conflicts of interests.
REFERENCES
|
Ahmed A, Othman IBL (2017). Relationship between organizational resources and organizational performance: A conceptualize mediation study. European Online Journal of Natural and Social Sciences 6(1):10. |
|
|
Ande DF, Dahlan RM, Sukardi S (2018). From Penrose to Sirmon: The Evolution of Resource Based Theory. Journal of Management and Leadership 1(2):1-13. |
|
|
Arnold K (2018). Evaluating the effect of Devolution on Performance of Water Service Provision in Kenya [Masters]. Pan African University Institute of Water and Energy Sciences. |
|
|
Campbell JM, Park J (2017). Extending the resource-based view: Effects of strategic orientation toward community on small business performance. Journal of Retailing and Consumer Services 34:302-308. |
|
|
Chepyegon C, Kamiya D (2018). Challenges Faced by the Kenya Water Sector Management in Improving Water Supply Coverage. Journal of Water Resource and Protection 10(01):85-105. |
|
|
Elbanna S, Abdel-Maksoud A (2020). Organizational Resources and Performance: The Case of an Oil-Rich Country. Public Performance and Management Review 43(3):713-739. |
|
|
Government of the Republic of Kenya (2007). Kenya Vision 2030. |
|
|
Harrell FE (2015). Ordinal Logistic Regression. In: Harrell FE (ed.), Regression Modeling Strategies. Springer International Publishing. pp. 311-325. |
|
|
Karama F, Iravo M, Kagiri A, Shale NI (2019). The Effect of Strategic Planning on the Delivery of Devolved Services in Selected Counties in Kenya. Public Policy and Administration Research 9(10):50-59. |
|
|
Karanja MN, Juma D (2020). Effect of Strategic Management practices on Service Delivery in State Parastatals in Kenya. A case of National Transport and Safety Authority. The Strategic Journal of Business Change and Management 7(4):1247-1259. |
|
|
Kenya Markets Trust (2019). The Journey of Changing Water Services Delivery in Kenya. KMT Water Case Study (Water Case Study No. 01; p. 50). Kenya Markets Trust. |
|
|
Leech NL, Barrett KC, Morgan GA (2015). IBM SPSS for intermediate statistics: Use and interpretation (Fifth edition). Routledge, Taylor & Francis Group. |
|
|
Lemarleni JE, Ochieng I, Gakobo T (2017). Effects of resource allocation on strategy implementation at Kenya Police Service in Nairobi County. International Academic Journal of Human Resource and Business Administration 2(4):1-26. |
|
|
Luján Salazar LA (2017). The Resource-Based View and The Concept of Value: The Role of Emergence in Value Creation. Mercados y Negocios 35:27-46. |
|
|
Mengich JK, Kiptum GK (2018). Effect of Strategic Plan Resource Allocation on Quality Service Delivery in the Sugar Manufacturing Companies in Western Region, Kenya. Available at: |
|
|
Mulwa F, Li Z, Fangninou FF (2021). Water Scarcity in Kenya: Current Status, Challenges and Future Solutions. Open Access Library Journal 8(1):1-15. |
|
|
Mwihaki NJ (2018). Decentralisation as a tool in improving water governance in Kenya. Water Policy 20(2):252-265. |
|
|
Mwikya BN, Khamah AH (2020). Effects of turn around strategies on service delivery of microfinance institutions: A case of Rafiki Microfinance Bank, Mombasa County, Kenya. International Journal in Management and Social Science 8(9):30-44. |
|
|
Ongeti WJ, Machuki VN (2018). Organizational Resources and Performance of Kenyan State Corporations. European Scientific Journal 14(34):91-117. |
|
|
Rasul I, Rogger D (2018). Management of Bureaucrats and Public Service Delivery: Evidence from the Nigerian Civil Service. The Economic Journal 128(608):413-446. |
|
|
Sadiq AM (2019). Effect of resource allocation strategy on the performance of Water Services Board in Kenya [PhD]. Jomo Kenyatta University of Agriculture and Technology. |
|
|
Scott GK (2019). Effects of Public Expenditure Management Practices on Service Delivery in the Public Sector: The Case of District Assemblies in Ghana. Journal of Public Administration and Governance 9(2):71. |
|
|
Stoelhorst JW (2021). Value, rent, and profit: A stakeholder resource?based theory. Strategic Management Journal 2021:3280. |
|
|
Taber KS (2018). The Use of Cronbach's Alpha When Developing and Reporting Research Instruments in Science Education. Research in Science Education 48(6):1273-1296. |
|
|
Utami H, Alamanos E (2022). Resource-Based Theory. In Resource-Based Theory. A review. Water Act 2016:1-26. |
|
|
Widjaja AW, Yuga A (2020). Is the RBV Theory Important for MSMEs?: Competitive Advantage Analysis of Tokopedia Seller with Resource Based Theory Views. Competitive Advantage Analysis of Tokopedia Seller with Resource Based Theory Views. Available at: |
|
|
World Economic Forum (2019). Global risks 2019: Insight report. Available at: |
|
|
Zangirolami-Raimundo J, Echeimberg JDO, Leone C (2018). Research methodology topics: Cross-sectional studies. Journal of Human Growth and Development 28(3):356-360. |
|
|
Zeithaml VA (2018). How do you measure service quality. Mapping Out Marketing: Navigation Lessons from the Ivory Trenches. 35. Routledge. |
|
Copyright © 2024 Author(s) retain the copyright of this article.
This article is published under the terms of the Creative Commons Attribution License 4.0


