ABSTRACT
The study attempts to investigate the relation between news articles and stock returns, focusing on immediate impact of Pak and Gulf Economist articles. It endeavors to figure out whether such quantification of news articles has a relation with Karachi Stock Exchange (KSE)-100 index. Sample comprised of 511 words picked manually for analysis from 760 weekly issues of Pak and Gulf Economist. Correlation and regression analysis was applied to word indices and KSE excess returns for a period of 16 years from 1999 to 2014. Main finding was that words were not only correlated with KSE- excess returns rather they also had a causal relation with index. Augmenting benchmark models with word indices enhanced the forecasting power of those models.
Key words: Behavioral finance, Karachi Stock Exchange (KSE)-100 index, text mining, R-word index, word count index, efficient markets.
Premises and background factors necessitating need for this study
The principle behind market efficiency is that security prices incorporate all relevant information. Fama (1991) was the first to distinguish three forms of efficiency. The traditional efficient market hypothesis posits that ongoing stock prices have already taken into account the information from all sources.
This view received a serious setback during some major financial crunches. That was when researchers in this community turned to variables outside economic and financial realm. For the past two decades, behavioral finance has been contributing by incorporating emotional aspects and psychology of investors in determining their behavior on stock market.
Suciu (2015) proves that in real market scenario one could easily disregard many key assumptions of efficient market hypothesis and mathematical finance. This is because traditional finance persists on proving market hypothesis rational. But today’s erratic markets are facing a new reality that with the dramatic increase in news instantly available, the market participants are easily carried away by trends. There was a time when investors used to pay dearly for stock pricing services. They even used to wait for receiving earning announcements by mail before taking a buy-hold-sell decision but the days have gone. Information is cheap and widely available. They may buy on the rumor of company takeover and sell when another announcement hits the newswire.
Sometimes this approach could work like a charm. At others, it would bring disaster. But that’s the way heuristic works. Rational decision making is simply not possible given the sheer volume and speed with which information bombards the market (Logue, 2006).
Behavioral finance stands in sharp contrast to technical and fundamental analysis too. It is imperfect people who determine market prices not highly perfected valuation models. Price is less a function of company’s facts and more a function of how investors perceive and feel about those facts. Everyday decision making takes place on the basis of social, motivational and psychological factors and is very often not based on stringent economic logic.
A general reactive human behavior cannot be forecasted by the strict quantitative finance provision of a classical fundamental analysis nor can human tendencies be modeled in the form of a Cup and Handle, Double Top and Bottom or Flag and Pennant charts put forward by technical analysis.
Behavioral finance today is shaping service delivery platforms and models (Schlichting, 2008). This fact has been well embraced by some of the leading management firms and investment houses who are aggressively embracing key tenants of behavioral finance into their day-to-day operations. With billions and trillions of dollars in motion, with thirty years of research in unveiling human cognitive biases and with irrational exuberance bringing about crunches like Dot com bubble and Global Financial Crisis 2008 to 2009, behavioral finance is growing in importance.
Aim of the study
Here we make an attempt to analyze the novel tactic of converting professional news into manageable information flows for out-psyching the market and for driving sharper trading decisions.
Research questions
1. Do news articles foretell forthcoming aggregate stock returns?
2. To what extent are stock market returns linked to reporting done by financial media?
3. How far can models based on such quantified news content predict future movement on the bourse?
Study contribution
The study contribution to literature is manifold. First of all, it is the first research of its kind to be conducted in emerging market of Pakistan. By identifying effect of financial media on returns of Pakistan’s biggest and world’s third best performing stock exchange, we contribute to a burgeoning literature that examines media’s power to influence actual outcomes on stock exchange. The study results forms the first systematic identification of financial media’s consequences and capacity to shape trader’s behavior. We lay foundation for future studies that are expected to delve deeper into the role played by qualitative news content in decision making. Secondly, majority of words were found to have considerable linkage with future returns. These words came mostly from economic and financial background for example, we found words like ‘inflation’, ‘GST’, ‘tranche’, ‘negative’, ‘borrowing’, ‘corrupt’, ‘debts’, ‘declining’, ‘shortfall’, ‘deficits’, ‘poor’ and ‘floods’ significantly associated with future excess returns on the bourse. Thirdly, words were found not only significant but Granger Causative of future stock market movements. Fourthly, word indices predicted future movement on stock market both in and out of sample. Fifthly, predictability of model maximized with a month lag indicating that impact of news articles became pronounced on stock market and got incorporated in returns after a month.
“The stock market is a device to transfer money from the impatient to the patient. Most people get interested in a stock when everyone else is. The time to get interested is when no one else is”--- Warren Buffet Behavioral finance and economics took birth with Adam Smith coining the “Theory of Mortal Sentiments” in early 18th century. Subsequently, hundreds of studies have been published on the subject. This mini review is limited in scope to present a complete overview of the field; therefore, the interested reader is referred to Bikas et al. (2013) for a comprehensive review of intriguing discoveries and development trends in the field of behavioral finance.
The area has enjoyed huge burst of research work and has exploded with new discoveries in recent past. This phenomenon rocked the financial markets during global financial crisis. It is now an indubitable reality that psychology permeates the financial landscape. Many asset management and financial service firms now explicitly base their strategies on the core principles of behavioral finance. The examples range from Goldman Sachs, Merrill Lynch, Nuveen, Panagora, Vanguard, Fuller and Thaler Asset Management, Martingale Asset Management to European financial institutions J.P. Morgan, KBC, ABN Amro among many others.
Sentiment and emotional analysis of text for stock market prediction is a vibrant and ongoing topic with contradictory findings. Main approaches to sentiment detection have been reviewed by Tang et al. (2009).
There is a body of research concerned with processing text and classifying its emotional stance as positive or negative for market prediction (Schumaker et al., 2012). However, their approach was not quite successful. A more successful example recently is that of Yu et al. (2013) who used a set of seed words expanded with the help of contextual entropy model to classify sentiment expressed by news articles resulting in improved classification performance. Using this approach, they were able to improve accuracy results from 52 to 91.5%.
Media speculation and performance of financial markets are interconnected. The literature is already overwhelming with numerous studies identifying interesting relationship between journalistic views and financial market performance. Successful attempts have been made to study the response of stock markets to the internet stock message boards (Antweiler and Frank, 2004; Das and Chen, 2007), twitter mood of investors (Bomfim, 2000), scheduled monetary policy announce-ments (Bollen et al., 2011), corporate governance press news (Carretta et al., 2011), announcements about money supply, inflation and real economic activities (Pearce and Roley, 1984), Wall Street Journal analysts’ recommendations (Barber and Loeffler, 1993), abreast of the Market-WSJ Column (Tetlock, 2007), Dow Jones News Servic (Tetlock, 2011) and breaking financial news (Chen, 2006).
A recent piece of research by Kim and Jeong (2012) discovered that bad news disseminated faster in social media and aroused negative purchase sentiments among investors. Another interesting development is effort by (Wisniewski and Lambe, 2013), who showed that there is sentiment implicit in media reports to which investors react vehemently.
They indicated negative media attention Granger Caused banking sector stock returns during Global Financial crisis 2008 to 2009. Some researchers have gone over and beyond the stocks to study impact of economic news on prices of other securities such as bonds (Balduzzi et al., 1996), foreign currency (Chatrath et al., 2014) and mutual funds (Fang et al., 2014).
Others have taken a tangent approach and endeavored to predict industrial production (Kholodilin et al., 2014) as well as track business cycle (Iselin and Siliverstovs, 2013) using media data. The former study was conducted in Germany and the latter was performed for both Germany and Switzerland. Iselin and Siliverstovs (2012) constructed R-Word Index specifically for Switzerland and evaluated its predictive ability for gross domestic product (GDP) growth. They witnessed statistically significant improvement in forecasting ability that surpassed benchmark autoregressive model. The study belongs to the stream of literature exploiting news content for stock market prediction. We find following studies worth mentioning to build a robust comprehension of this research problem.
Barber and Odean (2012) posited that the individual investors are net buyers of attention grabbing stocks, those that appeared more frequently in news. Machine learning, that uses computational modeling and pattern recognition, was implemented by Chen (2006). They presented a system that by learning the importance of breaking news on performance of a stock, predicted stock price changes. Out of the different textual representations, like bag of words, noun phrases, named entities, they found proper noun scheme most pertinent and articulate with best performance results. Engle and Victor (1993) concluded that huge positive and unanticipated negative shocks were responsible for bringing about big fluctuations and exacerbating market volatility.
In the department of Systems Engineering and Engineering Management at Chinese University Hong Kong, Fung et al. (2002) developed a method to forecast price trends following publication of news. Using top software available on the market, IBM’s Intelligent Miner for Text and SVMlight from Dortmund University for classification, this approach for identifying stock trends proved to be profitable. It is also possible to use linear regression directly.
Tetlock et al. (2008) estimated unknown parameters in linear regression using ordinary least square (OLS) and suggested that fraction of negative words found in news stories accurately predicted firms’ future earnings and stock returns. Kaminsky and Schmukler (1999) discovered that during chaotic financial environment of 1997 to 98, market jitters were triggered primarily by herd instinct of investors who overreacted to certain news such as news about international agreements and credit ratings having substantial effect. In addition, they confirmed investors’ overreaction to bad news. They proclaimed; however, that investors exhibited this overreaction particularly during good times (Veronesi, 1999).
In this regard, main reference is Ammann et al. (2014) who summarized articles published in Handelsblatt, a leading financial newspaper, by constructing word count indices and found them valuable predictors of future DAX (German Stock Exchange) returns, both in and out of sample. They extended the study with cluster analysis and showed that optimal level of fragmentation of news content, for best predictive values, was seven clusters.
In our native country, past research has focused mostly on event study methodology. On the one hand, there is Hanan et al. (2012) who determined the impact of natural catastrophes, terrorist attacks and political bedlams on KSE-100 index and found terrorist attacks most profoundly affected stock markets. On the other hand, we have Sohail and Yasmin (2014) who studied under or over reaction of KSE to the aftermath of Global Financial Crisis and found insignificant reaction from the bourse owing primarily to the weak linkages of country to the international securities market.
Since in the past, numeric data had been widely explored as an indicator of profitable stock market opportunities in Pakistan, we, therefore, focused our research on textual indicators. News articles were quantified and scored by the construction of word count indices for individual words. We, hereby, demonstrate a sophisticated system for monitoring and predicting future stock market behaviors. We discriminate our study from existing forecasting techniques by relying on non-quantifiable data – news articles. Several text and data mining techniques were employed and correlation as well as t-test based stepwise multiple regression served as major techniques for offering us a glimpse into stock market-press linkages.
Finally, out of the sample analysis using very simple, rolling window regression was carried out and results indicated that our approach was successful in predicting future stock returns.
In this study, we construct word count indices in an attempt to explore the relation between structured news content and lagged Karachi Stock Exchange returns. Word indices, for the purpose of this study take on a specific meaning. It refers to an index of a particular word established over previous 24 weeks.
Word index is a crude measure as it is mix of information, emotion, noise, and error of estimation. Nonetheless, it proved useful in predicting forthcoming stock market returns in some previous studies (Ammann et al., 2014; Barber and Loeffler, 1993; Fang et al., 2014; Tetlock et al., 2008).
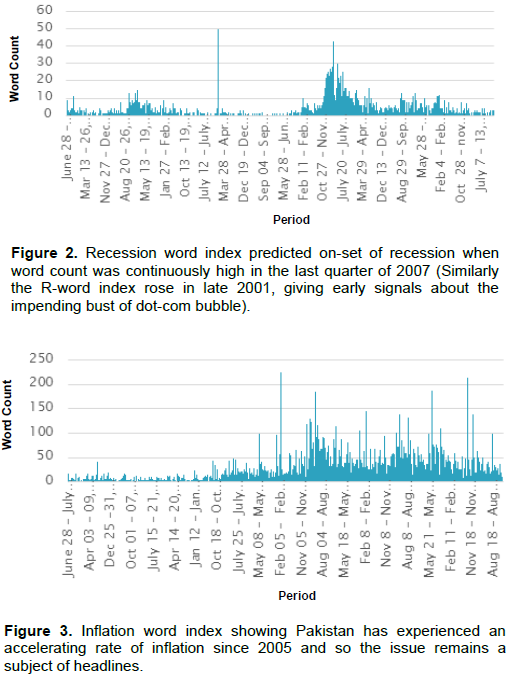
The Economist (The Economist, 1998) first coined the term “recession index” during the major financial crunch of 1990s, the R-index mirrored troughs of business cycle pretty closely. MarketPsych (2010) indices analyze real time news and have created Gloom, Fear and Joy indicators. Because psychological states exert influence on trading behavior of market participants, creating indices of violence, conflict, urgency etc. can prove vital to determine timing to market intervention by investors as well as allocation or sector rotation decisions.
We experiment with a defined set of keywords that are more likely to trigger investors’ sentiments and urge them to change position on bourse. We analyzed 16 years of news articles in a business and financial magazine, Pak and Gulf Economist, and created an index of words at weekly basis. Pak and Gulf Economist is an influential magazine having reach to a wide audience across all ages and walks of life.
So, we aimed at assessing the impact the weekly magazine had on KSE, ranked 3rd best performing stock market in the world. We did not restrict ourselves to front page banner headlines like previous studies (Casarin and Squazzoni, 2012) rather, we comprehensively covered periods of market volatility like Dot Com bubble and Sub-prime crisis 2008 to 2009.
Albeit, we could not unearth any temporal significance primarily because of Pakistan’s limited international financial linkages that averted contagion repercussions of Dot Com bubble and domino effect of Sub-prime crisis. We first tested the extent to which word indices tend to correlate with KSE returns and then looked for any possible causal relation between the two. We came to an intriguing finding. Numerous word indices were not only correlated to KSE returns but also Granger Caused future returns.
In addition, word indices continued to have explanatory power over and above several benchmark economic predictors. This is because word indices are source of supplementary information which remains unexploited by conventional macroeconomic predictors.
Data
Data set used in this study comprises of magazine news articles, Karachi Stock Exchange data, risk-free interest rate and data on control variables.
Our chief data set comprises 16 years of financial and business articles published in “Pak and Gulf Economist”, a weekly magazine, which covers the business and economic issues of Pakistan. Since established in 1977, it has been the leading weekly financial magazine having wide readership nationally and internationally. The magazine is also subscribed by some major libraries across the world.
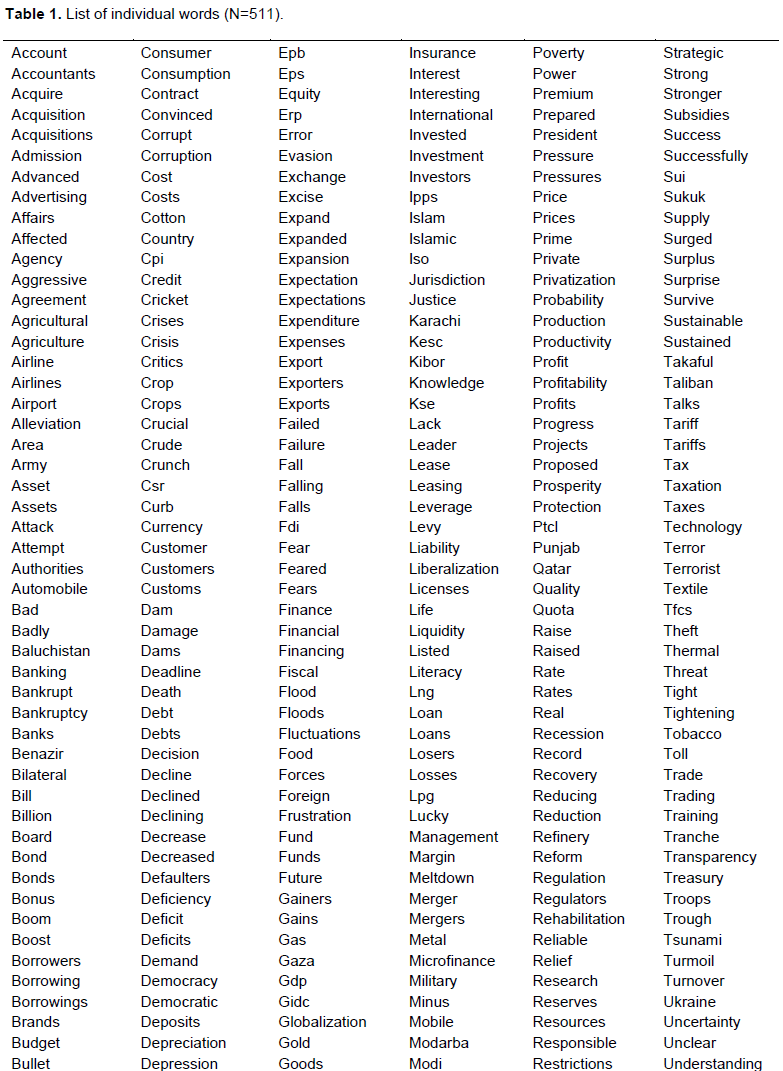
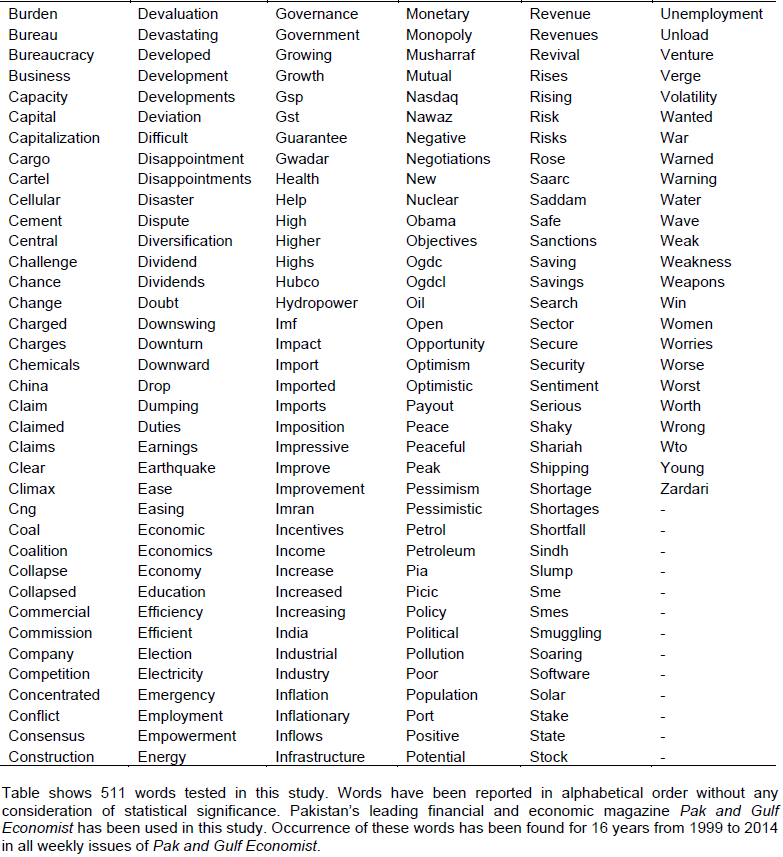
For gaining intuition on importance of language in stock returns, we scored and quantified qualitative news data by constructing indices for 511 individual words (Table 1). Instant availability, ease of construction, and potential zero correlation with macro-economic indicators makes word count indices handy and worthwhile financial indicators. Intense research in this realm documents word indices as reliable and valid construct. We subject this view to empirical scrutiny in our return predictability tests. We now begin to examine whether words provide some novel information not already incorporated in stock market prices. The higher the frequency of a word over the past couples of weeks, the higher the value of word index.
We construct these indices using a standardized approach according to the study of Tetlock et al. (2008). We test the hypothesis that words act as stimuli for market response and vice versa. This is the same view held by The Economist (The Economist, 1998) that if the number of news articles reporting dreaded R-word has increased then perhaps another recession is looming around the corner. To keep things simple, we do not however measure the degree of sentiment or emotion expressed by a particular sentence.
Several standard control variables have been included to assess whether words can predict returns above and beyond previously acknowledged sources of predictability. Data on interest-free rate, Quantum Index of Large Scale Manufacturing (QILSM), Broad Money (M2), Balance of Trade (BOT), Consumer Price Index (CPI), and Term Spread (difference between 10 year and 1 year government bond yield) was retrieved from the website of State Bank of Pakistan. The index points for KSE-100 were taken from KSE website.
Study design
We conduct univariate and multivariate analysis on the study data set.
Univariate correlation analysis
Out of a variety of methods available to analyze financial news articles, we choose to construct word count indices. In order to create quantitative variable from unstructured text of news store, we had to devise a meaningful representation.
So, we collapsed the document containing news stories into two columns, one representing word count and the other word indices. Word indices were constructed on the basis of frequency with which that particular word appeared over prior 24 calendar weeks. We standardized each word by subtracting past 24 weeks’ mean and dividing by past 24 weeks’ standard deviation. The word indices are a stationary measure of media content that is later employed in regression analysis.
Since Pak and Gulf Economist is a weekly magazine, we use weekly news stories and stock returns because this is the highest frequency for which both data are readily available. One drawback of this choice is that news and stock returns frequency do not match with each other.
We browsed the article through the online archive of “Pak and Gulf Economist” and passed the data through qualitative data analysis software to obtain individual word occurrences. Number of hits or occurrences of words were standardized to form z-score word count index as shown as follows:
zn,t = (cn,t- µc) / σc (1)
Where n=1,…..W words. ‘t’ is time step while Δ t = 1 week. The value of ‘t’ ranges from week 1 (1st weekly issue of the magazine) up till week T (last weekly issue of the magazine). cn,t represents count of word ‘n’ at time ‘t’. zn,t is the standardized word count index of word ‘n’ at time step ‘t’. µc denotes the mean and σc symbolizes standard deviation of that particular word over past 24 weekly issues of the magazine. In addition, we carried out Granger Causality test (Granger, 1969) to check whether word indices hold a probabilistic account of causality for future movements on bourse. We also classified the words according to Harvard Psychosocial Dictionary IV.
In-sample analysis
After univariate correlations, we performed multivariate stepwise regression to gain further insight into the existence and development of “news articles-stock market relationship”.
The model we use here for predicting asset returns is the one selected out of broad range of econometric tools for predicting future financial asset returns. Our model has inherited most of its features from the study of Ammann et al. (2014). Because of the highly multivariate nature of the data, we employ stepwise regression which is an automated tool, having the ease of acting as a single model. It has been widely deployed in exploratory stages to build the best model with right predictors.
Stepwise regression fits regression models by choosing predictor variables in an automated procedure. Each variable to be added to or subtracted from the set of explanatory variables is chosen based on pre-specified criteria. Though other techniques are possible, but in our algorithm, this decision to add or subtract a variable takes place via a sequence of F-tests. We employ two main approaches to stepwise regression here:
Forward selection: Starting with zero variables in the model, the addition of each variable in the model is tested against a pre-specified criterion which is the p-value of F-statistic. We use p-value threshold of 5% for entrance. The variable whose inclusion yields the highest statistical improvement of fit is added to the model. This process is repeated until no statistically significant improvement to the model can be made.
Backward elimination: The model, again considering all candidate variables, tests each variable against pre-set criterion and excludes the variables whose loss results in most insignificant model fit deterioration.
Criterion is again the p-value of F statistic fixed at 10% threshold for exit. This process is repeated iteratively until no variable can be excluded without a significant loss of model deterioration. When employed properly, stepwise regression results in more powerful information than does OLS. Poking variables in and out, this algorithm is especially useful for fine tuning a model containing highly multivariate dataset.
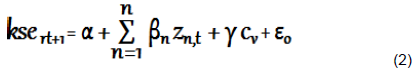
The equation for stepwise regression algorithm stated earlier can be put together as follows:
Where ksert+1 denote excess return on Karachi Stock Exchange as measured at time t+1. These excess returns are a function of word-indices (zn,t) and control variables(cv). Here, zn,t means the index of word ‘n’ at time period ‘t’. α is the intercept; β exposes excess return to n word indices while γ is a vector which represents factor loading for control variables. cv a vector representing seven control variables: rt, CPI, TS, volati, M2, BOT, QILSM. Each of these variables has been explained below. εo refers to disturbance term.
We mostly rely on control variables evidenced to have forecasting power in previous work (Schrimpf et al., 2007; Walkshaeusel and Lobe, 2011; Ammann et al. 2014). As one would expect, these control variables have been ascertained to exhibit a forecasting effect. In case a control variable is a return itself, we take excess return over KSE to avoid multicollinearity.
Term spread (TS) added here controls for interest rate fluctuations in economy (Domian and Reichenstein, 1998). rt, which stands for lagged KSE excess return, has been taken into consideration here to take autocorrelation into account. Control variable volati, in accordance with Tetlock et al. (2008), has been introduced as a proxy for past volatility in Karachi Stock Market. Volati is meant to wane the confounding effect of past market volatility. It was computed by demeaning KSE log returns, squaring the residuals and then subtracting rolling average over past 36 weekly issues of the magazine. CPI, another control variable, has been entered to limit seasonal variation in data. CPI trend component was computed as rolling average of past 12 weeks of log CPI (Ammann et al., 2014).
Co-integration of broad macro-economic factors and stock market movements is well-documented in literature. Brighter prospects of large scale industrial production in country are sure to lead to a bullish market (Levine and Zervos, 1996). QILSM (Quantum Index of Large Scale Manufacturing) controls for this fact and is computed on the basis of latest production data of 112 items. To control for other macro-economic influences, we add Broad Money Supply (M2) (Friedman, 1988) and Balance of Trade (Chen, 2009).
Out of sample analysis
We segregated the time series data into in-sample and out-of-sample portions. In sample tests the model’s goodness of fit whereas an out of sample analysis, also known as back testing, assesses the actual forecasting ability of the model. The significance of out of sample analysis cannot be overemphasized. It results in empirical evidence far more reliable than that based on in-sample analysis which is prone to data mining and outliers.
According to Giacomini and White (2006), while in-sample analysis might yield a good model fit and a high co-efficient of determination, it could partly be due to over-fitting. To gauge actual predicting capability of word count indices, we, thereby, resort to out of sample analysis. This test has gained reputation as an “Ultimate test of a forecasting model” Stock and Watson (2007) because it is better able to represent information available to forecaster in real time Diebold and Rudebusch (1991). Our first sample split takes place at the beginning of the evaluation period. To check our model’s ability to effectively perform while its variables are altered, we back test our statistical model on historical data. We compute the KSE Excess Return estimates over rolling windows of fixed size through sample Zivot and Wang (2006). Rolling estimation windows ensure that we obtain maximum number of forecasts.
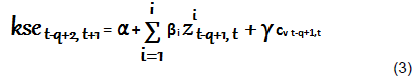
As the power of out of sample forecast evaluation test is strongest with lengthy sample periods (Hansen and Timmermann, 2012), we, therefore, set the rolling estimation window size to span 200 weekly issues of the magazine. We check predicting performance with the help of Equation 3 given as follows:
The usual procedure for this technique calls for splitting the historical data into estimation and prediction samples. We fit the model using estimation sample and make T-q step ahead predictions of KSE excess returns for the prediction sample.
We, then, roll estimation sample ahead at a preset increment of 1 week and repeat the estimation and prediction exercise until we are not able to make any more step-ahead predictions. In Equation 3, dependent variable is regressed on standardized word count indices using standard rolling window size of 200 weeks, q=200. T-q estimates of regression coefficients are obtained as a result of this stepwise regression. We denote these coefficients as αroll, βi, roll and γroll. Where roll is rolling window index and roll = 1,…,T-q. The regression coefficients thus obtained are then substituted in Equation 4 to calculate fitted one step ahead KSE Excess Returns.
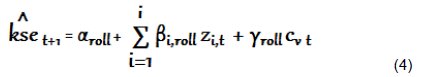
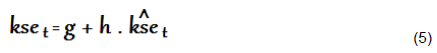
Where t=q,…., Total Observations-1 and roll=1,…,T-q. Equation 4 yields as many data points for predicted KSE Excess Returns as there are rolling windows. These predicted returns are regressed against actual; we then observe how closely these predicted returns track actual ones. We evaluate the accuracy of forecasted values, KseÌ‚t+1, by plotting them against realized returns. We find best fit regression line in accordance with equation (v) given below:
Intercept of regression equation is ‘g’ while ‘h’ represents the slope. If ‘h’ turns out to be significant, then we have sufficient evidence to claim that model is statistically robust to portend one step ahead KSE Excess Returns.
Univariate correlations
We are able to replicate (Ammann et al., 2014) finding that one month ahead expected returns are predicted more accurately by employing news content and that news articles impact stock returns substantially. To correct for fluctuations in total volume of news articles spidered each week, we use standardized article word count instead of raw count. We make some noteworthy observations follows:
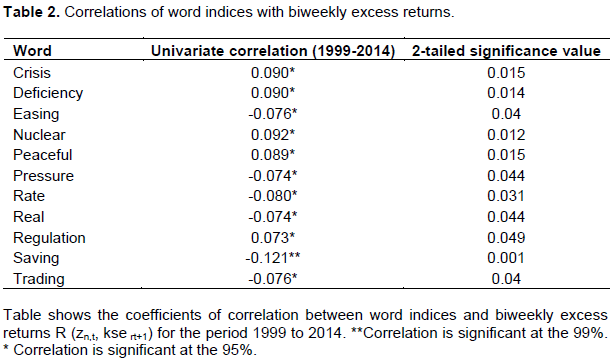
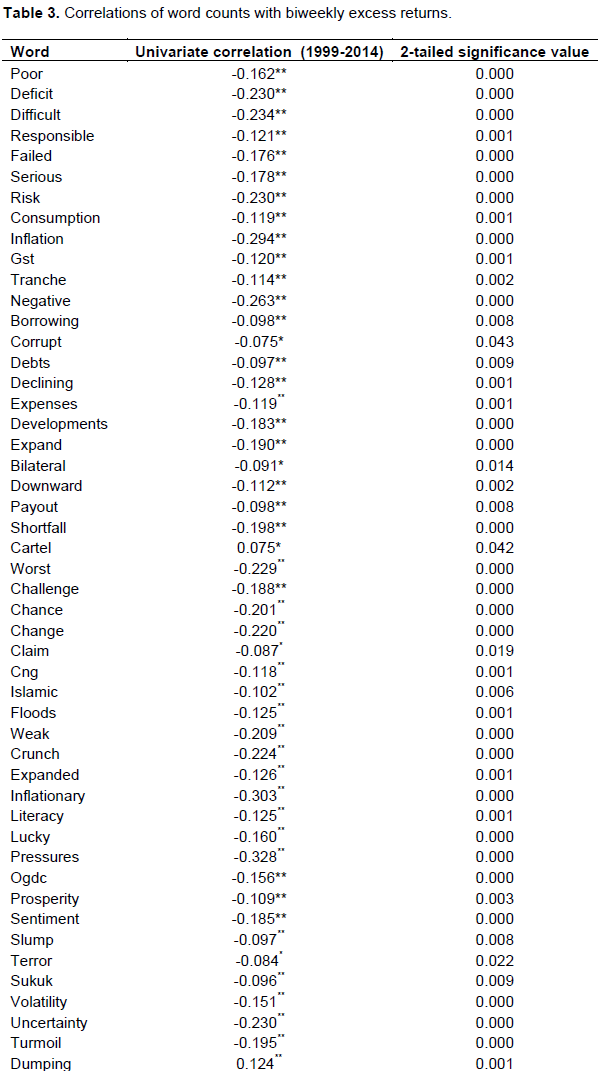
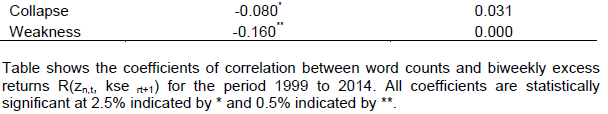
Numerous significant correlations were reported between word indices and KSE Excess Returns. Majority of the words had an algebraic sign of correlation coefficient that was in agreement with the words’ connotation. For instance, correlation co-efficient of ‘peaceful’ was positive while that of ‘failed’ and ‘serious’ were negative. We take lagged KSE Excess Returns and allow two lags one biweekly and second monthly. Results of this analysis for biweekly and monthly excess returns have been set out (Tables 2 to 5).
13 ‘word indices’ and 64 ‘word counts’ had statistically significant negative correlation with biweekly excess returns. We were able to pick out more than half of the word indices having negative correlation with monthly excess returns. We detected 96% word counts having negative correlation with biweekly excess returns and 93% having negative correlation with monthly excess returns.
On the whole, 75% words appeared to be negatively correlated. Highest reported correlation co-efficient with biweekly excess returns was that of word ‘saving’ at -0.121 while with monthly excess returns maximum correlation co-efficient was that of word ‘deficiency’ at -0.124. Almost 70% words having statistically significant association were nouns. ‘inflation’, ‘GST’, ‘tranche’, ‘negative’, ‘borrowing’, ‘corrupt’, ‘debts’, ‘declining’, ‘shortfall’, ‘deficits’, ‘poor’ and ‘floods’ were some of the negatively correlated words. No doubt, the words reported here, expressed going concerns over financial issues engulfing economy of Pakistan.
In addition, macro-economic issues like burgeoning ‘inflation’, escalating ‘IMF’ debt burden, alarming rates of ‘corruption’ and recent ‘floods’ were also spotted. It’s clear that investors are substantially influenced by the tone of news. Buy, sell or hold decision making is done on the basis of news heard or read.
In consistence with research objective set at the beginning of the study, we found substantial evidence that a relation exists between media reporting and subsequent stock returns. Initially, we had set out to discover relation between press coverage and stock market returns. Strong evidence has been found which supports the belief that language content has an inherent explanatory power which if accounted for can neatly elaborate on stock market developments.
Correlation coefficients ranged between -1.121 to 1.124 inclusive. Indices of words ‘IMF’ and ‘president’ had negative correlation coefficients. These results appear genuine given the likely impact of political upheavals on stock market (Figure 2 and 3).
In our opinion, there are several reasons for low correlation coefficients. First, words counts are considered noisy and crude measures to approach a text and cannot dominate traditional fundamental measures. Second, viewership and audience of Pak and Gulf Economist is limited. Third, Pak and Gulf Economist had low performance basically because it did not have plenty of data. News articles data set should have been much larger for more accurate results.
We also note that daily news has recency effect which does not last longer whereas knowledge, sentiment and information conveyed by magazine articles are expected to last longer. This underscores very important difference between magazines and daily newspapers.
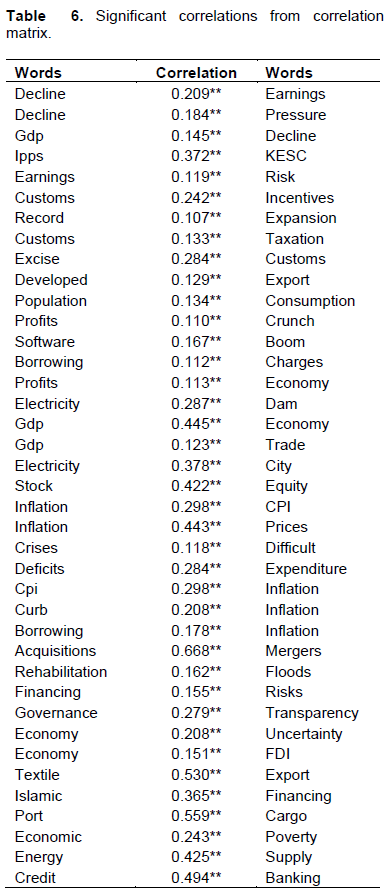
Results have been analyzed more closely by Due to space constraint, it is not possible to report correlation matrix here. However, in this table, we do highlight some important results. We infer that since words do speak a lot about actual situation, it is possible to leverage their ability to form an overall opinion about forthcoming market returns. **Correlation is significant at the 99%. *Correlation is significant at the 95%. “Borrowing” is associated with “inflation”, “financing” brings about “risk”, “rehabilitation” follows “floods”, “CPI” is an indicator of “Inflation”, “Textile” is one of the biggest “Export” of Pakistan, hence the two co-occur 31% of time. Well known and most commonly associated macro-economic variables “GDP” and “trade” and “GDP” and “economy” were also reported to have positive correlation coefficient significant at 99% confidence level.constructing a correlation matrix. We checked the significance at 99 and 95% confidence level using two-tailed test. Out of numerous statistically significant correlations observed, we report only a few here for precision and brevity. A remarkable discovery is that correlation matrix mirrored and imitated some well-established economic relationships like those between “GDP” and “Trade”, “CPI” and “Inflation”, “Financing” and “Risk” and “Acquisitions” and “Mergers”. In general, results suggested strong positive association between many economically associated terms (Table 6).
All in all, the results suggest that words are a potentially useful media indicator that must be employed in forecast combination for accurate predictability. We also notice that correlation coefficients become stronger and stronger with the increasing news frequencies as it leads to higher word counts.
After correlation analysis, Bi-variate Granger Causality Test was conducted to find possible causal relations between words and excess returns. Univariate causality was reported in 31.3% cases or in nearly 1/3 of the instances. Causality occurrences increased once a greater lag was allowed for words to have their impact pronounced on bourse. This finding is consistent with Multiple Linear Regression results. Feedback was reported in only 2.9% instances eliminating the possibility of endogeneity. We employed Granger Causality test at 5% significance level allowing a maximum of eight lags. Overall, the predictability trend of words towards the bourse was manifested. Here, we do not take causality to imply that influence between variables is direct. Rather, we interpret it to mean that stock market prices capture the impact of news stories and new information provided by media.
Besides, the up and down of KSE returns induced occurrence of certain words, mostly negative ones, in news articles. Mass media has the ability to affect prices and returns even after supplying us with in-genuine news. An important factor determining security prices is breadth of information dissemination owing to the fact that news has certainly far broader reach than corporate or stock market analysis reports. This finding is particularly consistent with Fang et al. (2014).
In-sample analysis
Results of multivariate stepwise regression taking control variables and word indices as independent variables and biweekly and monthly KSE-100 Excess Returns as dependent variables was documented here. In earnings predictability regressions, we identify seven control variables that could impact our returns substantially.
Before carrying out in-sample stepwise multiple regression analysis, data was tested for all assumptions of Multiple Linear Regression. We prevented autocorrelation by taking lagged KSE excess returns.
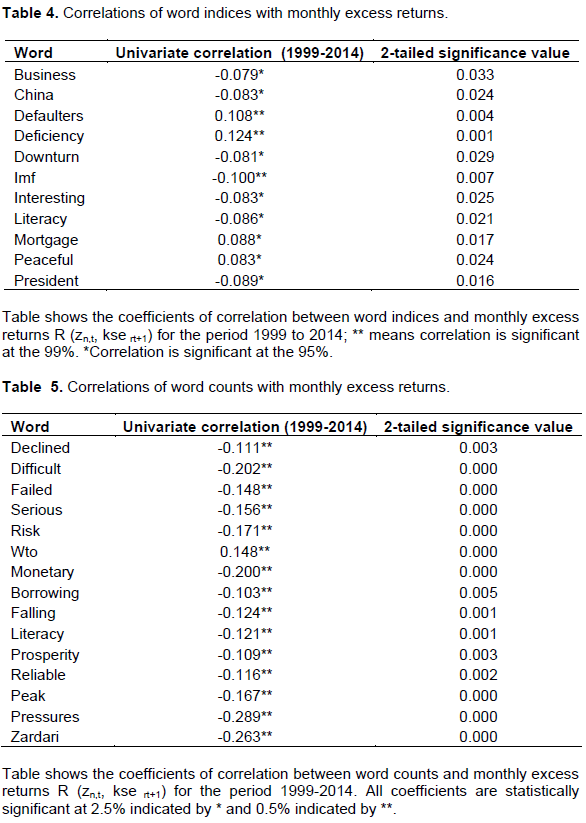
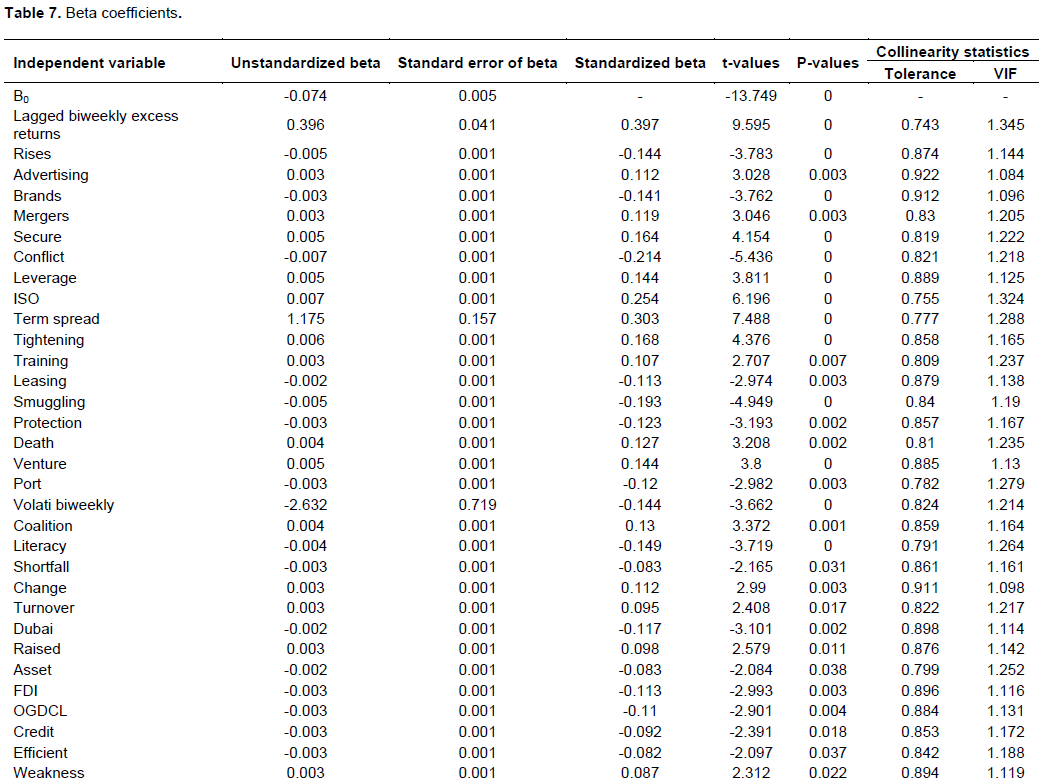
Absence of multi-collinearity was ensured by checking correlations between control variables which were found to be insignificant. The final model we reached in stepwise fashion, by taking biweekly excess returns as dependent variable, had 39 variables. Even though, we introduced benchmark macro-economic indicators; nevertheless, individual words continued to possess great explanatory power. This finding is in line with Tetlock et al. (2008).
To a large extent, the study findings are consistent with the study of Ammann et al. (2014) for both univariate and multivariate analysis. What is more, a somewhat different set of words appeared to have explanatory power in the presence of control variables.
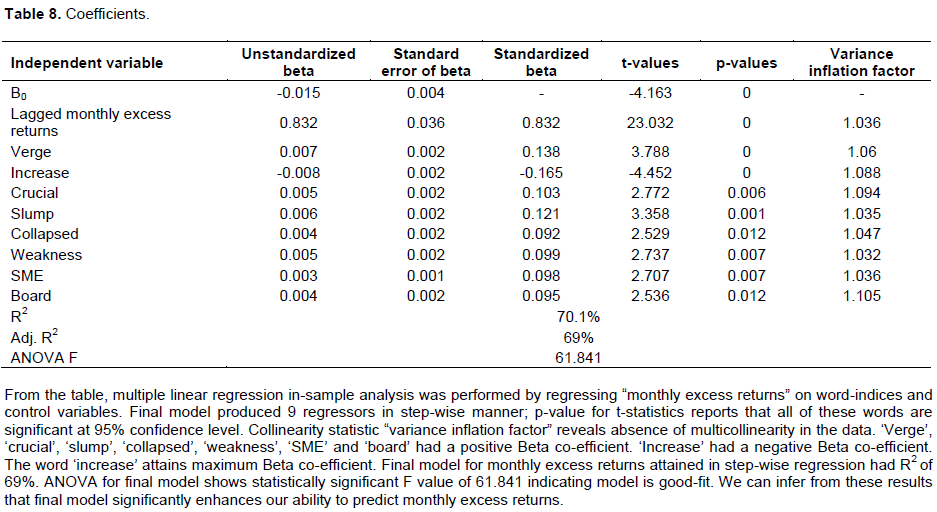
The multivariate stepwise regression resulted in many words with considerable explanatory power; though, nouns emerged most frequently as compared to other word classes. The adjusted R2, for multivariate in-sample analysis, reported here (69%) is substantially larger than 15% documented by (Ammann et al., 2014).
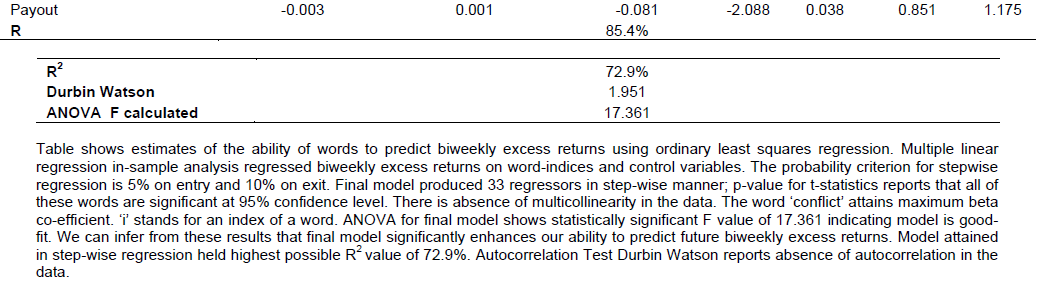
Stepwise regression was run with a rolling window size of 200 weeks. That means for every window regression was run, once. No word was persistently chosen through entire period, though, “shortfall” and “payout” appeared more often (Tables 7 and 8).
We noticed some words attaining signs opposite of their connotation for example, the word “literacy” had negative factor loading. It can be explained in the light of the context the word appeared. In Pakistan, literacy is critically low which is hampering the economic progress of the country. Press keeps on highlighting this issue from time to time. In this case “literacy” is not acting as an economic stimulator.
We observe that economic crisis in country stimulated news reporting which strengthened explanatory power of news articles. Words found significant in multivariate setting were almost entirely different from those found in Univariate analysis. In additional unreported tests, we run regressions separately for sub-periods but the pattern in these correlations is not fairly analogous to that for all periods. These temporal regressions did not appear to have prominent effect for future returns.
The evidence makes it clear that even a crude measure of language could robustly predict returns even beyond these popular indictors of stock market peaks and valleys. This is primarily because language content has incremental explanatory power for future earnings. Quantitative variables do not accurately represent expectation of investors whereas; a rudimentary linguistic measure of news can contribute significantly to a useful measure of returns.
In this study, we developed and applied a novel empirical approach for return forecasts. The study findings clearly show that when press coverage goes negative KSE falls and vice versa. Columnists and writers act as disseminator of information. Their beliefs get converged when all traders get to see same piece of information. If noise traders are going to have an impact on market security prices, there must be a common element in their belief formation. Our study concentrates on one such common component (Tetlock, 2010). After this analysis we are now in a position to make definite conclusions about impact of print media on future stock returns.
Out-of-sample analysis
As far as model’s goodness-of-fit is concerned, we report higher goodness-of-fit measure as compared to some previous studies (Ammann et al., 2014; Campbell and Thompson, 2008).
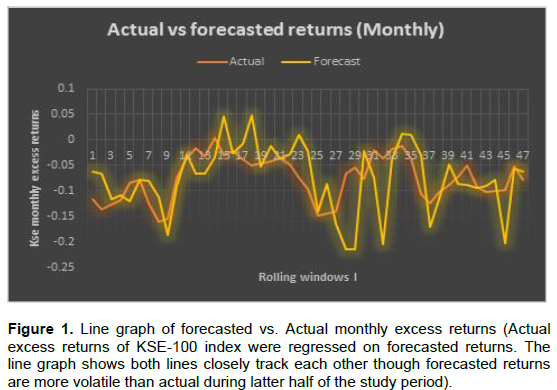
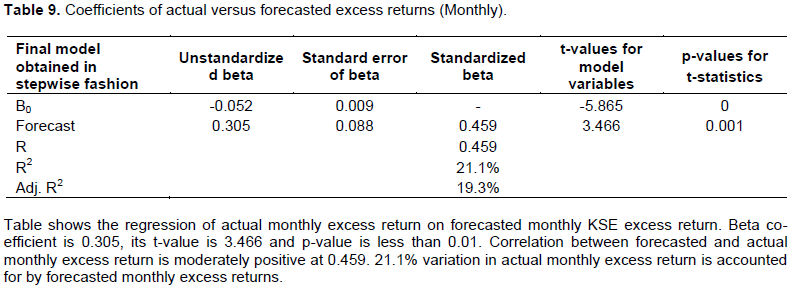
Figure 1 plots forecasted returns against actual KSE excess returns given a month’s lag. It provides striking evidence that forecasted returns concentrate fairly closely around actual KSE excess returns over the entire sample period suggesting that press stories could play a vital role in disseminating and communicating information about stock market returns. Further support for this interpretation is provided by t-statistic of B-coefficient, in Equation 5 which is statistically significant.
We report Adjusted R2 of 19.3%. Many previous studies reported single digit R2 values. The study closely resembling ours (Ammann et al., 2014) documented an Adjusted R2 of 1.27%. It must be noted, though, that our study rolling window size is 200 compared to 60 used in aforementioned study. Our study findings largely consistent with those of Ammann et al. (2014) suggest that out of sample analysis fares better with large rolling window sizes as compared to small ones.
We see however, that forecasted returns have become more volatile during latter half of the study period. Predictability varied over financial time series but we find lower predictability during second half of analysis period when markets had become more volatile. We also tested with varying rolling window sizes and observed higher predicting accuracy with large window sizes. This phenomenon can be attributed to the fact that very small sample sizes are prone to the issues of over fitting and multicollinearity.
Forecasted monthly excess returns manifest predictive potential for actual monthly excess returns but we were unable to detect statistically accurate prediction of actual biweekly returns by forecasted biweekly returns (Table 9). It is our study interpretation that news gets incorporated into stock returns within a month. Some readers might perceive this statement as a possible rejection of efficient market hypothesis, but it is not so, as the efficient market hypothesis is concerned with current stock prices, not the future stock returns.
One of the possible explanations of why forecasting ability enhances when a month’s lag is allowed is provided by Campbell (1991) and Cochrane (1992) who discovered that predictability increases with time horizon. Another explanation is outlined by Tetlock et al. (2008) who holds the opinion that investors never respond fully to information embedded in news, immediately. In general, results allow us to draw the conclusion that investors’ psychology is shaped by news content and information from all sources available. General findings of behavioral finance suggest that fundamental factors have lost their predictability overtime as investors’ sentiments are tied more to the unbiased sentiment expressed by news articles than traditional financial data. Having established that media induces market returns, we come to the conclusion that print media’s impact on bourse could have been much stronger had the press not been cautious in delivering bad news.
Given the freedom allowed to press, one could easily object that press reporters have never been cautious and never deliberately could follow a less critical stance in reporting unpleasant news. But our conjecture is supported by firm evidence of press indeed having become cautious during times of crisis. We refer the reader to a recent study of US media coverage of financial crisis. In this report, Peter S. Goodman (Schiffrin, 2010), a renowned US economics author and journalist, submitted with evidence that U.S. journalists were wary in covering bad news in global crisis 2008 to 2009 because during market turmoil such influential streamers could have had dramatically swayed market sentiments.
Researchers have mixed claims about how publicly available news predicts subsequent market returns. Despite extensive work in this field, previous literature, in Pakistan, supplies few studies examining the ability of financial or business magazine to predict stock market returns. Such elaborate analysis, on the ability of a financial or business magazine to foretell stock returns, has not been carried out before. Particularly, our finding that financial and economic news articles are valuable predictors of future KSE returns in and out of sample have not been reported before. Our results though economically small, possess statistic robustness. We advise that similar analysis must be carried out by varying time lags and by incorporating myriad media sources so that we arrive at a model most apt and robust to apply in natural investment setting.
Theoretical and managerial implications
The main goal of the study is to address almost complete lack of research evidence on empirical relation between financial press and stock market returns in Pakistan. The study results serve as a guide to investment and portfolio managers, corporate financial managers, personal finance planners, stock brokers, investment advisors among others. They may consider taking press news into account while making investment analysis to better gauge security risks. Quantifying qualitative news data in the manner presented here can help improve decision making, execution will get better and so will the results. Digital news on the wire is available instantly and can be incorporated in the models as shown in this study, to predict forthcoming returns on stock market. Employing qualitative and quantitative techniques simultaneously lead to more precise estimates of fair value and future returns. Recession, inflation and poverty indices can prove to be immensely useful to policy makers and other administrative bodies (Figures 2 and 3).
Peter S. Goodman, Global Editor-in-Chief of Business Times reports that:
‘…Investors and markets and ordinary people would move their money in reaction to what we and other major media were reporting and this would in turn affect the policy climate, the perception of need for emergency measures, the politics of the debate over those measures, and the public mood, which then reverberated back on everything else’ (Schiffrin, 2010) The study systematically explores the predictive power of business news articles for KSE excess returns. We find monthly return predictability pattern following news articles. We construct a straight forward measure of news content that corresponds to the ongoing market situation. It should give a vivid picture of where the economy is heading to. Ebbs and flows of economy are mirrored by surge and decline in occurrence of positive or negative connotations. Whether economy is on path of recovery or another crisis is unfolding itself is evident from news content. The study measure, word count indices are potentially uncorrelated to benchmark macro-economic indicators. Therefore, they are highly valuable indicators of economic activity.
The hypothesis that word indices are correlated to future KSE excess returns receives support from data. Many of these words Granger caused future KSE Excess Returns. Second finding is that news content had an explanatory power for future KSE returns that went beyond other well-established predictors In and Out of sample. Thus word indices are reasonable proxies for stock exchange activity.
Most words which were found significant in correlation and in-sample regression pinpoint critical macro-economic issues. These words had a socio-economic background. This attests to the unquestionable prominence of seemingly random content of news articles. Investors start trading on news after it is published. News content has a linkage with investor’s psychological makeup. The study research also points out that at least a month is required for words to have their impact pronounced on bourse.
Delimitations of the study
Major limitation of this study relates to sample design. The study data comes solely from Pak and Gulf Economist, the viewership of which varies among different stakeholders. So, we restrain ourselves from claiming that these findings are widely applicable. That leaves a lot of room for further exploration of financial media and stock market relationship in an emerging economy like that of Pakistan’s.
Future developments
Preliminary results are highly encouraging. We aim to carry out a research in future to assess purely causal impact of media on stock market returns after controlling for all simultaneous determinants of trader’s demand. Furthermore, we have laid the ground for future studies to examine myriads of sources of investor information like utilizing news coming from all print and electronic media and assessing its impact on various financial markets such as mercantile exchange, bond market, stock market, real estate market, simultaneously.
The authors have not declared any conflict of interests.
REFERENCES
|
Ammann M, Frey R, Verhofen M (2014). Do Newspaper Articles Predict Aggregate Stock Returns? J. Behav. Financ. 15(3):195-213.
Crossref
|
|
|
|
Antweiler W, Frank MZ (2004). Is all that talk just noise? The information content of internet stock message boards. J. Financ. 59(3):1259-1294.
Crossref
|
|
|
|
|
Balduzzi P, Elton EJ, Green TC (1996). Economic news and the yield curve: Evidence from the US Treasury market. Retrieved from
View
|
|
|
|
|
Barber BM, Loeffler D (1993). The "Dartboard" column: Second-hand information and price pressure. J. Financ. Quant. Anal. 28(02):273-284.
Crossref
|
|
|
|
|
Barber BM, Odean T (2012). All that glitters: The effect of attention and news on the buying behavior of individual and institutional investors. Professor David J. Hand, Professor of Statistics, Imperial College, London; Chief Scientific Advisor, Winton Capital Management; and President, Royal Statistical Society, 173 p.
|
|
|
|
|
Bikas E, JureviÄienÄ— D, Dubinskas P, NovickytÄ— L (2013). Behavioural finance: The emergence and development trends. Procedia-soc. Behav. Sci. 82:870-876.
Crossref
|
|
|
|
|
Bollen J, Mao H, Zeng X (2011). Twitter mood predicts the stock market. J. Comput. Sci. 2(1):1-8.
Crossref
|
|
|
|
|
Bomfim AN (2000). Pre-Announcement Effects, News, and Volatility: Monetary Policy and the Stock Market. Retrieved from
View
|
|
|
|
|
Campbell JY (1991). A Variance Decomposition for Stock Returns. Econ. J. 101(405):157-179.
Crossref
|
|
|
|
|
Campbell JY, Thompson SB (2008). Predicting excess stock returns out of sample: Can anything beat the historical average? Rev. Financ. Stud. 21(4):1509-1531.
Crossref
|
|
|
|
|
Carretta A, Farina V, Martelli D, Fiordelisi F, Schwizer P (2011). The impact of corporate governance press news on stock market returns. Euro. Financ. Manage. 17(1):100-119.
Crossref
|
|
|
|
|
Casarin R, Squazzoni F (2012). Financial press and stock markets in times of crisis. Retrieved from
Crossref
|
|
|
|
|
Chatrath A, Miao H, Ramchander S, Villupuram S (2014). Currency jumps, cojumps and the role of macro news. J. Int. Money Financ. 40:42-62.
Crossref
|
|
|
|
|
Chen RP (2006). Textual Analysis of Stock Market Prediction Using Breaking Financial News: The AZFinText System. 12th American Conference on Information Systems (AMCIS), pp. 1-18, 26-27.
|
|
|
|
|
Chen S (2009). Predicting the bear stock market: Macroeconomic variables as leading indicators. J. Banking Financ. 33(2):211-223.
Crossref
|
|
|
|
|
Cochrane JH (1992). Explaining the Variance of Price-Dividend Ratios. Rev. Financ. Stud. 5(2):243-280.
Crossref
|
|
|
|
|
Das SR, Chen MY (2007). Yahoo! for Amazon: Sentiment extraction from small talk on the web. Manage. Sci. 53(9):1375-1388.
Crossref
|
|
|
|
|
Diebold FX, Rudebusch GD (1991). "Forecasting Output with the Composite Leading Index: An Ex Ante Analysis," J. Am. Stat. Assoc. 86:603-610.
Crossref
|
|
|
|
|
Domian DL, Reichenstein W (1998). Term spreads and predictions of bond and stock excess returns. Financ. Serv. Rev. 7(1):25-44.
Crossref
|
|
|
|
|
Engle RF, Ng VK (1993). Measuring and testing the impact of news on volatility. J. Financ. 48(5):1749-1778.
Crossref
|
|
|
|
|
Fama EF (1991). Efficient capital markets: II. J. Financ. 46(5):1575-1617.
Crossref
|
|
|
|
|
Fang LH, Peress J, Zheng L (2014). Does media coverage of stocks affect mutual funds' trading and performance? Rev. Financ. Stud. 27:3441-3466.
Crossref
|
|
|
|
|
Friedman M (1988). Money and the stock market. J. Polit. Econ. 96(2):221-245.
Crossref
|
|
|
|
|
Fung GPC, Yu JX, Lam W (2002). News sensitive stock trend prediction. In: Pacific-Asia Conference on Knowledge Discovery and Data Mining. Springer Berlin Heidelberg, pp. 481-493.
Crossref
|
|
|
|
|
Giacomini R, White H (2006). "Tests of Conditional Predictive Ability," Econometrica 74:1545-1578
Crossref
|
|
|
|
|
Granger CW (1969). Investigating Causal Relations by Econometric Models and Cross-spectral Methods. Econometrica 37(3):424-438.
Crossref
|
|
|
|
|
Hanan MA, Noshina S, Siddiqui SA, Imran S (2012). Impact of Natural Disasters, Terrorism and Political News on KSE-100 Index. Forman J. Econ. Stud. 8:13-30.
|
|
|
|
|
Hansen PR, Allan T (2012). Choice of sample split in out-of-sample forecast evaluation, Working paper, Stanford University. Retrieved from View
|
|
|
|
|
Iselin D, Siliverstovs B (2012). The R-word index for Switzerland. Appl. Econ. Lett. 20(11):1032-1035.
Crossref
|
|
|
|
|
Iselin D, Siliverstovs B (2013). Using newspapers for tracking the business cycle: A comparative study for Germany and Switzerland. Retrieved from
Crossref
|
|
|
|
|
Kaminsky GL, Schmukler SL (1999). What triggers market jitters? A chronicle of the Asian crisis. J. Int. Money Financ. 18(4):537-560.
Crossref
|
|
|
|
|
Kholodilin KA, Thomas T, Ulbricht D (2014). Do media data help to predict German industrial production?. Discussion Paper. Retreived from
View
|
|
|
|
|
Kim J, Cha M, Kim H, Jeong J (2012). Managing bad news in social media: A case study on domino's pizza crisis. Proceedings of the Sixth International AAAI Conference on Weblogs and Social Media. Retreived from
View
|
|
|
|
|
Levine R, Zervos S (1996). Stock market development and long-run growth. World Bank Econ. Rev. 10(2):323-339.
Crossref
|
|
|
|
|
Logue AC (2006). Hedge Funds For Dummies Hoboken, NJ: Wiley Publishing, Inc.
|
|
|
|
|
MarketPsych (2010). 'Investor fear'. URL: http://www.marketpsych.com
|
|
|
|
|
Pearce DK, Roley VV (1984). Stock prices and economic news. J. Bus. 58(1):49-67.
Crossref
|
|
|
|
|
Schiffrin A (2010). Bad News: How America's Business Press Missed the Story of the Century (Large Print 16pt). ReadHowYouWant.com. ISBN145960864X, 9781459608641. 396 p.
|
|
|
|
|
Schumaker RP, Zhang Y, Huang CN, Chen H (2012). Evaluating sentiment in financial news articles. Decis. Support Syst. 53(3):458-464.
Crossref
|
|
|
|
|
Sohail A, Yasmin A (2014). The Global Financial Crisis and Investors' Behaviour, Evidence from the Karachi Stock Exchange. Pakistan Institute of Development Economics. PIDE Working Papers; No. 106. Retrieved from
View
|
|
|
|
|
Tang H, Tan S, Cheng X (2009). A survey on sentiment detection of reviews. Expert Sys. Appl. 36(7):10760-10773.
Crossref
|
|
|
|
|
Suciu T (2015). From The Classical Finance To The Behavioral Finance. J. Public Admin. Financ. Law. 7:80-88. Retrieved from
View
|
|
|
|
|
Schlichting T (2008). Fundamental Analysis, Behavioral Finance and Technical Analysis on the Stock Market. Theoretical Concepts and Their Practical Synthesis Capabilities. Diploma Thesis, 115 p.
|
|
|
|
|
Schrimpf A, Schröder M, Stehle R (2007). Crossâ€sectional Tests of Conditional Asset Pricing Models: Evidence from the German Stock Market. Euro. Financ. Manage. 13(5):880-907.
Crossref
|
|
|
|
|
Stock J, Watson M (2007). Introduction to Econometrics. 2nd Edition, Addison Wesley.
|
|
|
|
|
Tetlock PC (2010). Does public financial news resolve asymmetric information? Rev. Financ. Stud. 23(9):3520-3557.
Crossref
|
|
|
|
|
Tetlock PC, Saarâ€Tsechansky M, Macskassy S (2008). More than words: Quantifying language to measure firms' fundamentals. J. Financ. 63(3):1437-1467.
Crossref
|
|
|
|
|
Tetlock PC (2007). Giving content to investor sentiment: The role of media in the stock market. J. Financ. 62(3):1139-1168.
Crossref
|
|
|
|
|
Tetlock PC (2011). All the news that's fit to reprint: Do investors react to stale information? Rev. Financ. Stud. 24(5):1481-1512.
Crossref
|
|
|
|
|
The Recession Index (1998, December 10). The Economist.
View
|
|
|
|
|
Veronesi P (1999). Stock market overreactions to bad news in good times: a rational expectations equilibrium model. Rev. Financ. Stud. 12(5):975-1007.
Crossref
|
|
|
|
|
Walkshaeusel C, Lobe S (2011). 'The Alternative Three-Factor Model: An Alternative beyond US Markets?' Eur. Financ. Manage. 00(0):1–38.
|
|
|
|
|
Wisniewski TP, Lambe B (2013). The role of media in the credit crunch: The case of the banking sector. J. Econ. Behav. Organ. 85:163-175.
Crossref
|
|
|
|
|
Yu LC, Wu JL, Chang PC, Chu HS (2013). Using a contextual entropy model to expand emotion words and their intensity for the sentiment classification of stock market news. Knowl-Based Syst. 41:89-97.
Crossref
|
|
|
|
|
Zivot E, Wang J (2006). Rolling Analysis of Time Series. In: Modeling Financial Time Series with S-PLUS®. Springer, New York, NY.
|
|