ABSTRACT
Manual steps including preparation of samples and gel, and launching of automatic sequences can cause many difficulties in the interpretation of electrophoresis. Three observations of electrophoretic profiles on Hydragel 15β1-β2 agarose gel media led us to look for interference in the manual step of the technique used. After reconsidering all the steps of the manipulation and carefully observing the profiles obtained on the three plates of the agarose gel, the management of the deposition of the filter paper was identified as the cause in the first observation. The holding of the gel plate and the insufficient deposition of serum were identified as the main causes in the second observation. Mismanagement of the plate was identified as the cause in the third observation. All of these assumptions were confirmed by tests done on the bench. These observations remind us of the importance of the manual phase with semi-automatic devices for obtaining reliable results and for easy interpretation of results.
Key words: Electrophoresis, migration, albumin, gamma, densitometer.
Protein electrophoresis is an inexpensive tool that is widely available to the practitioner for the investigation of hyperglobulinaemia. Distinguishing polyclonal (that is, inflammatory) gammopathies from monoclonal gammopathies is obviously of paramount importance (Tripathy, 2012; Skeldon, 2018). Electrophoresis is a method of separating proteins based on their physical properties. Serum is placed on a specific medium, and a charge is applied (O’Connell et al., 2005). The technique of electrophoresis is based on the displacement of ions (molecules having lost their electrical neutrality) under the effect of an electric field (Ameziane et al., 2006). Due to their own characteristics and depending on the electrophoresis conditions, these ions will have different migration rates, so they will separate from each other. Electrophoresis of serum proteins is a very useful laboratory analysis of clinical analysis to look for changes in the protein profile. The diagnostic value of serum protein electrophoresis is well established. However, like any analytical method of medical biology, this analysis may have its interpretation hampered by interference, potential sources of confounding factors (Collier et al., 2018). They may be related to a pre-analytical event (hemolysis, lactescence), or with substances resulting from a disruption of the patient's metabolism (bilirubin, fibrinogen, hyperlipemia, bile acids, C-reactive protein) or with exogenous substances administered to the patient for therapeutic (antibiotics, monoclonal antibodies, human polyvalent immunoglobulins) or diagnostic (iodinated contrast agents) purposes (Collier et al., 2018). Beyond the limits already described for this technique, there are other traps exclusive to the manual phase related to the implementation of the semi-automatic electrophoresis technique in daily practice that can hinder an efficient interpretation of the results. The objective of this study was to show, from three observations, the importance of mastering the manual phase with semi-automatic devices to obtain reliable and easily interpretable results.
Venous blood sample is collected on a dry tube from a fasted patient. The serum is obtained after coagulation by centrifugation for 5 min at 3000 rpm. The appearance of the serum should be clear (absence of chylomicrons), free of hemolysis and fibrin (Szymanowicz et al., 2006). Agarose gel electrophoresis (Hydrasys®) is a semi automated technique used for the migration and separation of serum proteins in alkaline buffer (pH=9.2) on an agarose gel (Hydragel® protein 15/30). The Hydrasys® system is a multiparametric instrument that assures the treatment of Hydrogels according to the following steps: undiluted sample application, electrophoretic migration at constant 20W, drying, coloring, decoloration, final drying and reading on a densitometer / scanner (Hyrys®, Sebia) at 570 nm. Thisseparates the proteins into five fractions of different mobility: albumin, α1 and α-globulins, β-globulins and gamma globulins and a precise relative quantification of each individualized zone (Lissoir et al., 2003). The manual steps are: sample preparation and freezing, launching automatic sequences.
Observation 1
At the end of the treatment, the Hydragel 15β1-β2 gel collecting 15 different patient samples was removed from the film carrier contained in the treatment; staining module has very shortened profiles in the first four samples, and is normal in the other eleven samples (Figure 1). From these very shortened profiles, serum electrophoresis was resumed for these four patients (Figure 2) and comparative results were obtained after densitometer reading was done (Figure 3). We found after a retrospective consultation of gel patches that it was not a very recurring phenomenon within the service; it has the particularity of occurring towards the end of the week. The solution adopted in the service was then to read the plate densitometer, and to interpret only the normal profiles, that is to say with complete migration on the plate. For serums of much-shortened profiles, the test was repeated on the following plate. We resumed the test, for the four sera. The results obtained gave normal profiles. Careful observation of all the steps of the manipulation associated with the operating principle of electrophoresis led us to identify the source of the problem as being the management of the filter paper during the removal of the excess liquid on the surface of the gel. The manufacturer's instructions (Sebia, 2009), after the release of the gel from its packaging, were to quickly remove excess liquid from the surface by flicking the gel with fine filter paper. For the technicians within our structure, the deposition of the filter paper is done by holding the gel plate in the normal direction in the direction of the left to the right, and the withdrawal is in the opposite direction. In this case, the contact time between the filter paper and the gel is much longer on the side of the first samples. This phenomenon occurs towards the end of the week with fatigue and decrease of vigilance; the reaction time is slower which causes an excess of elimination of the buffer at the level of the first samples. To confirm the phenomenon on a gel plate, the deposition of the fine filter paper supplied by the manufacturer was made in the direction of the left to the right and the withdrawal was made in the same direction, that is to say from left to right. The electrophoresis obtained gave profiles whose migration distances are equal to both the first and last samples (Figure 2). These results made us to conclude that it is indeed the prolonged contact of the fine filter paper with the agarose gel which is at the origin of these shortened profiles.


Observation 2
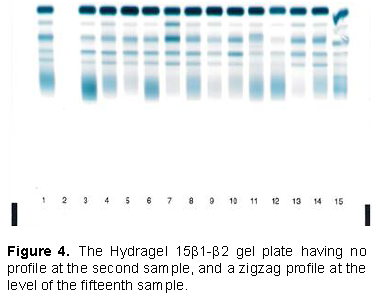
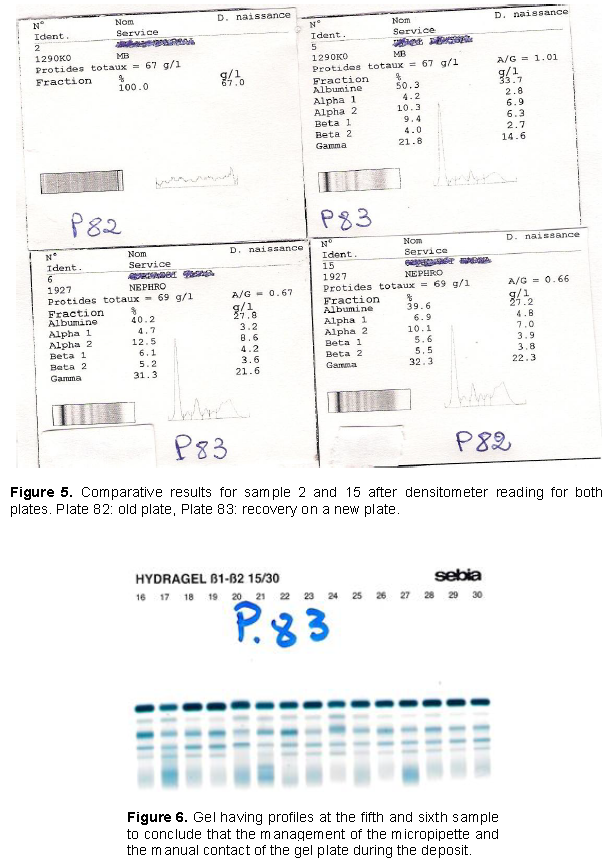
At the end of the treatment, the Hydragel 15β1-β2 gel collecting 15 different patient samples was removed from the film carrier contained in the treatment; staining module has no profile at the second sample, and a zigzag profile at the fifteenth sample, particularly between the area corresponding to albumin and the area corresponding to alpha 2 (Figure 4). Comparative results after densitometer reading were obtained (Figure 5). After a reflection on the manual phase of the technique, we came to the conclusion that it would be a lack of serum deposit of the second sample. But since the technician claims to have made the deposit because he fully followed the protocol we concluded that certainly it would be the misuse of the micropipette for serum deposition. A gesture of deposition of the serum was carried out, but instead of using serum it is a bubble of air suggesting a deposit. Consequently the clearance of the mouthpiece was accompanied by its contents (the serum). Sample 15 is used to hold the gel that has been incriminated, since it has facilitated the contact of the finger with the gel, thus revealing a non-uniform area not very conducive to the migration of serum. The sera corresponding to the second and fifteenth samples were taken again, then redeposited on the next plate, and with a match for the fifth and sixth samples of the plate (Figure 6). This time, we were careful to use the micropipette, that is, taking 10 μl without bubbles and depositing in full, before getting rid of the tip. We checked that the serum has migrated to the teeth of the applicator before placing it in the humid chamber. The technique was done according to the recommendations of the manufacturer, while avoiding manual contact with the gel. The results obtained gave normal profiles. They allow us to conclude that the management of the micropipette, and the manual contact of the gel plate during the deposit were at the origin of the abnormal profiles at the level of the second and fifteenth samples (Figure 6).
Observation 3
At the end of the treatment, the Hydragel 15β1-β2 gel collecting 15 different patients’ samples was removed from the film carrier contained in the treatment; staining module has zigzag profiles at the sixth, seventh, ninth and tenth samples around empty ranges (Figure 7). The recovery of the four samples corresponding to the fifth, sixth, seventh and eighth samples of the following plate gave correct profiles (Figure 8), and comparative results after the densitometer reading were obtained (Figure 9). The doubt of a defective gel plate cannot be excluded which does not clear the technician who has the duty to check its integrity before use. But we decided not to consider this aspect because all the other gels in the same batch did not show any anomalies. We decided to take up the problem of management of the gel plate, either a drop of gel plate from the hands of the technician who was not reported or the contact of the fingers with the gel of the plate, which had for consequently, the separation of the gel at certain places on the plate where the migration took place, thus leaving empty areas. The recovery of the four samples corresponding to the fifth, sixth, seventh and eighth samples of the following plate gave correct profiles (Figure 8), this time respecting the recommendations of the manufacturer; a particular vigilance was carried on the verification of the integrity of the plate.


The principle of electrophoresis is based on the displacement of electrically charged molecules, placed in an electric field (Ameziane et al., 2006). The so-called electrophoresis zone or liquid vein is stabilized by a support in the form of a gel impregnated with a buffer solution. The amount of buffer is important, approaching the 100 % used in the Tiselius system. Agarose has a better sensitivity and allows a better resolution of the protein fractions. The reduction of low-intensity bands is more efficient. The initial gel is transparent, which allows a good evaluation by a densitometer and avoids any additional treatment (perspiration). The low concentration of agarose (0.5 to 1% close to the ideal liquid vein system) explains the large porosity of the gel and the free migration of molecules without distortion (large proteins) (Le Carrer, 1994). It gives a separation of the human serum constituents in six different mobility fractions: Albumin, alpha-1 globulins, alpha-2 globulins, beta-1 globulins, beta-2 globulins, and gamma globulins. In water solution, the amphoteric molecules (case of proteins) dissociate differently according to the pH of the medium, giving either positively charged ions (R-NH3 +) or negative ions (R-COO-). There is a pH value of the medium where the apparent charge of a molecule is zero (equal positive charges and negative charges); it is called the isoelectric pH (pHi) of the molecule. Its value is a constant characteristic of the molecule. Placed in a medium of pH higher than its pHi, a protein acquires an apparent electrical charge (sum of negative-positive charges and negative charges). It behaves like an anion and moves towards the anode (positive electrode). In a pH medium below its PHi, its apparent charge is positive. The protein behaves like a cation and moves to the cathode (negative electrode). For a given electric field, the higher the charge of the molecule, the more intense the force that mobilizes it (electrokinetic force) and the faster the molecule moves. The pH of the solvent conditions the charge of the molecules and therefore their displacement. If this displacement is to be constant and reproducible from one analysis to the next, this pH must be fixed (Fernand et al., 2003). So, we use a buffer solution. In our case the buffer used is pH 9.2 +/- 0.1 (Sebia, 2009). The filter paper in prolonged contact with the gel caused it to dehydrate. A very dry gel leads to a shorter strip length with less sensitivity in fractions resolution and integration difficulties (Figure 1). The usual reproducibility shows average coefficients of variation of about 1.4% for albumin peak, 5.2% for our technique. All the comparative results obtained after the resumption of the samples gave values ​​included in the range of the coefficient of variation (Figures 3, 5 and 9). This is not an element that militates in favor of non-recovery of shortened profiles; on the contrary, it is an element that reflects the need to produce correct profiles for several reasons. On the one hand, the interpretation of the results makes use of both the observation of the profiles obtained and the observation of the plots obtained for the purpose of making a reliable result and the risk of missing out, on the other hand, of monoclonal peaks migrating to gamma (Figure 8). As immunoglobulins, monoclonal antibodies have the potential to be identified by serum protein electrophoresis (SPE) and immunofixation electrophoresis (IFE) (McCudden et al., 2016; Karfo et al., 2018). Before any migration, we make certain the state of the support: homogeneity, the absence of marks, of dust, any defect which can lead to deformed migrations and checking the moisture level of the gel (Fernand et al., 2003). A technician must be assigned to this bench and handling must require concentration on his part.
This study reminds us that, in the need to render reliable results, the biologist must establish a clear protocol that covers the manual phases of the technique of any semi-automatic device used in the laboratory. This protocol should be based on the manual provided by the manufacturer with emphasis on the parts considered important (for example, marked parts note, important, attention). This is very important because, on one hand, it ensures the longevity of your equipment, and on the other hand allows you to produce clear profiles, that are easy to interpret, and finally the opportunity for the laboratory to save money. These can be obtained by avoiding repetition of tests to ensure the tests’ reliability and to save time.
The authors have not declared any conflict of interests.
REFERENCES
|
Ameziane N, Bogard M, Lamoril J (2006). Principe de biologie moléculaire en biologie clinique. Elsevier. pp. 100-150.
|
|
|
|
Collier C, Lombard C, Dimet I, Sarda N (2018). L'électrophorèse des protéines sériques en biologie médicale : interférences et facteurs confondants. RFL 499: 47-58.
|
|
|
|
|
Fernand JP, Daunizeau A, Pham BN, Intrator L, Bienvenu J, Preud'homme JL (2003). Immunoglobulines monoclonales. Cahier de formation de biologie médicale N°28. pp. 26-39.
|
|
|
|
|
Karfo R, Kabré E, Safir N, Bouabdellah M, Benchekroun L, Sakandé J, Chabraoui L (2018). Difficult immunofixation electrophoresis interpretation of serum proteins. Pan African Medical Journal 30:130.
|
|
|
|
|
Le Carrer D (1994). Electrophorèse et immunofixation des protéines sériques. Interprétations illustrées. Laboratoires SEBIA. pp. 11- 53.
|
|
|
|
|
Lissoir B, Wallemacq P, Maisin D (2003). Electrophorèse des proteins sériques: Comparaison de la technique en capillaire de zone Capillarys® (Sebia) et de l'électrophorèse en gel d'agarose Hydrasys® (Sebia). Annales de Biologie Clinique 61:557-562.
|
|
|
|
|
McCudden C, Axel A, Slaets D, Dejoie T, Clemens P, Frans S, Bald J, Plesner T, Jacobs J, Donk N, Moreau P, Schecter J, Ahmadi T, Sasser A (2016). Monitoring multiple myeloma patients treated with daratumumab: Teasing out monoclonal antibody interference. Clinical Chemistry and Laboratory Medicine 54(6):1-10.
Crossref
|
|
|
|
|
O'Connell TX, Horita T, Kasravi B (2005). Understanding and interpreting serum protein electrophoresis. American Family Physician 71(1):105-112.
|
|
|
|
|
Sebia (2009). Hydragel 7,15, et 30 β1-β2. pp. 1-7.
View
|
|
|
|
|
Skeldon N (2018). Interpreting protein electrophoresis in practice. In Practice 40:183-193.
Crossref
|
|
|
|
|
Szymanowicz A, Cartier B, Couaillac J. P, Gibaud C, Poulin G, Riviere H, Le Carrer D (2006). Proposition de commentaires interprétatifs prêts à l'emploi pour l'électrophorèse des protéines sériques. Annales de Biologie Clinique 64: 367-380.
|
|
|
|
|
Tripathy S (2012). The role of serum protein electrophoresis in the detection of multiple myeloma: An experience of a corporate hospital. Journal of Clinical and Diagnostic Research 6(9):1458-1461.
Crossref
|
|