ABSTRACT
The study deals with determining ionosphere parameter at low latitudes during the maximum of solar cycle 22 on quiet days. It uses Thermosphere-Ionosphere-Electrodynamics General Circulation Model (TIEGCM) to carry out Total Electron Content (TEC) parameter in the ionosphere region. TEC time variability on summer and winter highlights a seasonal anomaly, a phenomenon observed since 1965 and which appears while radiations coming from the sun are more intensive in summer than in winter under low latitudes. A mathematical approach integrating the time values of TEC parameter is developed to calculate TEC total value during all the season. The study shows that the seasonal anomaly phenomenon is not observed at every time between summer and winter. Comparison of the rate of electrons production matches with solar radiation intensity between summer and winter during a short period. Apparition of winter anomaly phenomenon shows that ultraviolet and X-rays emitted from the Sun are not the only causes of ionization of particles in ionosphere. Other chemical or physical phenomena also contribute to enhance the concentration of electrons in the atmosphere. The estimation of the rate of TEC production in ionosphere F2-layer enables a comparison of summer and winter behavior in ionosphere layer. The study offers a good knowledge of winter anomaly phenomenon.
Key words: Total electron content, thermosphere-ionosphere-electrodynamics general circulation model, winter anomaly, maximum of solar cycle, quiet day.
Ionosphere layer is the part of atmosphere that reflects radio waves. It lies between 50 and 800 km in the upper atmosphere. Ionosphere behaves like an obstacle for radio waves propagation. The property of this layer is due to its concentration in particles, essentially N2, O2, and O (Rishbeth and Gariott, 1969). These molecules and atoms are the major constituents of ionosphere layer (Bauer and Jackson, 1962; Bauer et al., 1964; Van Zandt et al., 1960; Van Zandt and Knecht 1964). The ultraviolet rays and X-rays coming from the Sun hit these particles and cause their ionization. This phenomenon creates different ions like O+, NO+, O2+ and e-. The concentration of the different particles gives to the ionosphere some characteristics like its capacity to reflect or transmit the waves. Although the ions density is important in the ionosphere, this layer stays neutral electrically, and moves like a plasma. To investigate ionosphere layer, many models have been developed (Roble et al., 1988; Bilitza et al., 2014; Qian et al., 2010; Jin and Park, 2007; Bittencourt and Chryssafidis, 1994). All of them aim to carry out ionosphere parameters. Some models are based on data recorded on different stations while others use both data and mathematical simulation. In the study, we use Thermosphere-Ionosphere-Electrodynamics General Circulation Model (TIEGCM) to carry out the Total Electron Content (TEC) in the F2-layer of the ionosphere. TIEGCM is a numerical model developed at High Altitude Observatory of National Center for Atmospheric Research (Richmond et al., 1992). The model uses input of 144 discrete values for longitudes and 72 values for latitudes. Running the model helps to get 90 output parameters that are obtained by a software program. Thermosphere General Circulation Model (TGCM) is the original version of TIEGCM. TGCM has been developed by Dickinson et al. (1981, 1984) and Roble et al. (1982), but gets a major development by coupling the ionosphere to the thermosphere (Roble et al., 1987, 1988). This gives the Thermosphere-Ionosphere General Circulation Model (TIGCM).The implementation of self-consistent electrodynamics leads to the Thermosphere-Ionosphere-Electrodynamics General Circulation Model (TIEGCM) (Richmond et al., 1992; Richmond, 1995). In a previous study (Nanema et al., 2020), seasonal anomaly phenomenon has been highlighted by use of International Reference Ionosphere (IRI) model. The present study deals with electron bulk surface density in the ionosphere F2-layer. The objective of this study is to compare the rate of electrons production between summer (very intensive solar radiations period) and winter (less intensive solar radiations period) under low altitudes. It will help to highlight the winter anomaly phenomenon. The study takes place at Ouagadougou station, located in West Africa. Maximum phase is considered in this study.
The methodology of the study is based on the following core assumptions and principles (Zerbo et al., 2011; Ouattara et al., 2012; Gnabahou and Ouattara, 2012): (i) a season is characterized by its characteristic month (March for spring, June for summer, September for autumn and December for winter); (ii) maximum phase solar cycle is determined by Rz > 100 (where Rz is the yearly average of Zürich sunspot number); (iii) quiet days is determined by its Aa ≤ 20 nT and the five quietest days of a month describe all the season; (iv) the located station in this study is Ouagadougou (latitude: 12,4°N, and longitude: 358,5°E). The nearest values for latitude and longitude to Ouagadougou geographic characteristics in TIEGCM table of data are 12°N and 0° respectively.
Using the principle (ii), the following Equation 1 gives the expression of the TEC:
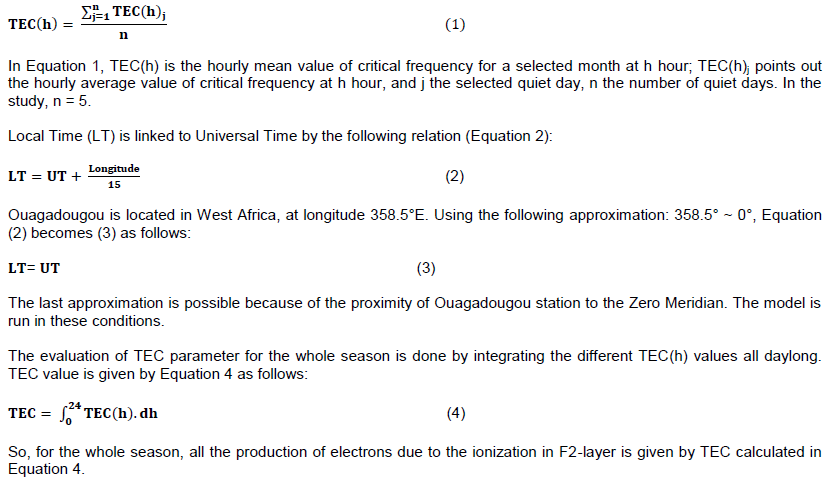
Using the (ii) principle, the maximum phase of solar cycle 22 is 1990. In this year, by help of (iii) condition, the five quietest days are shown in Table 1.
For each characteristic month, TEC(h) can be generated by use of Equation 2. Equation 4 shows the area defined by TEC(h) profile and x-axis. This area defines the total value of TEC for the whole season.
In Figure 1, two areas are represented on the graph. The major part of TEC value on summer is hidden by that on winter, except from 04.00 LT to 07.00 LT. Table 2 is obtained by using Equation 1.
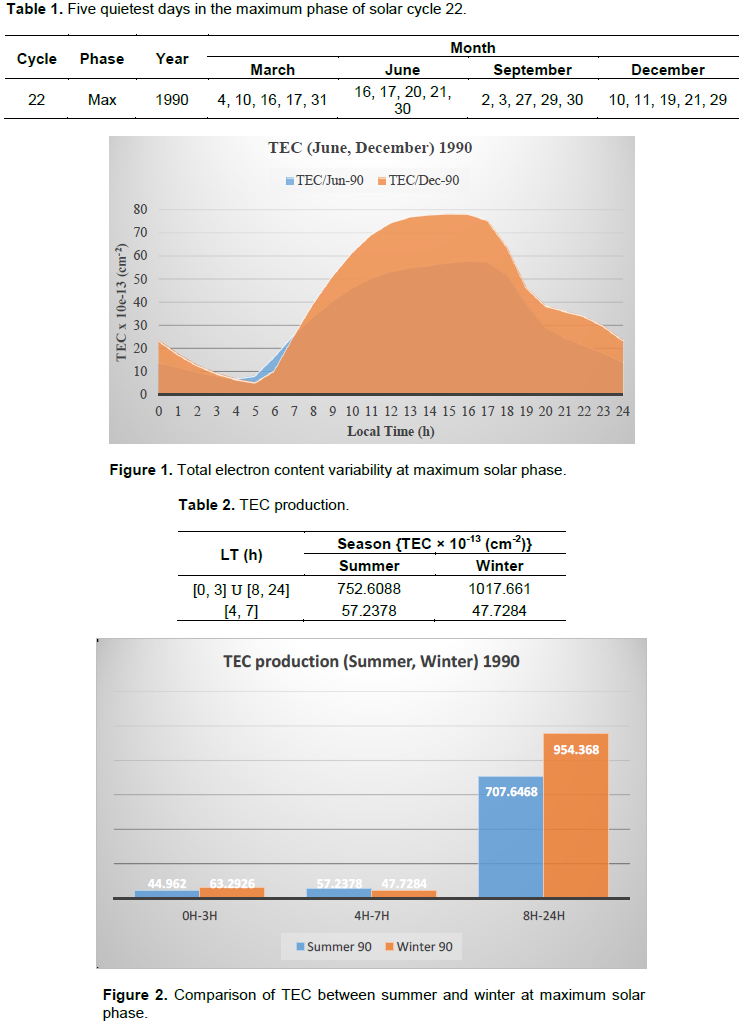
Figure 2 presents the comparison of TEC production between summer and winter at maximum solar phase, derived from Table 2.
(a) From 00.00 LT to 03.00 LT and from 08.00 LT to 24.00 LT, TEC on winter hides TEC on summer. During this period, the rate of TEC production is around 35% superior in winter than in summer.
(b) From 04.00 LT to 07.00 LT, TEC on winter is lower than TEC on summer. Winter anomaly is not shown during this period. The rate of TEC production is around 20% superior in summer than in winter.
(c) During all the year, the rate of TEC production is around 32% superior in winter than in summer.
Solar radiations are less intensive in winter than in summer. The rate of TEC production is higher in winter than in summer. This shows an anomaly in TEC production, according to the intensity of solar radiation. This is the winter anomaly phenomenon which is well reproduced by TIEGCM from 00.00 LT to 03.00 LT and from 08.00 LT to 24.00 LT. This phenomenon has previously been highlighted by other authors (Yonezawa and Arima, 1959; Shapley and Beynon, 1965; Rishbeth et al., 2000; Rishbeth and Muller-Wodarg, 2006). Solar radiation intensity cannot explain the apparition of winter anomaly. Other phenomena take place in atmosphere layer ionization. From 04.00 LT to 07.00 LT, TEC value in summer is higher than in winter. During this period, winter anomaly phenomenon does not appear.
This study is focused on the use of TIEGCM, a numerical model, to investigate ionosphere F2-layer by determining the total electron content parameter. A mathematical approach is used to evaluate the rate of seasonal TEC production at different seasons. This evaluation helps to highlight winter anomaly, a phenomenon that has been found already by different authors in previous studies. The rate of TEC production in winter is 32% higher than in summer. The study also shows that during a short period, the winter anomaly phenomenon is not observed. The result found in this study correlates with the other studies. This study also shows that solar radiations intensity is not the only cause of ionization in atmosphere layer; different phenomena can initiate it. In future studies, examination of these phenomena will be the target of our works.
The authors have not declared any conflict of interests.
REFERENCES
|
Bauer SJ, Jackson JE (1962). Rocket measurements of the electron density distribution in the topside ionosphere. Journal of Geophysical Research 67:1675-1677.
Crossref
|
|
|
|
Bauer SJ, Blumble LJ, Donley JL, Fitzenreiter RJ, Jackson JE (1964). Simultaneous rocket and satellite measurements of the topside ionosphere. Journal of Geophysical Research 69(1):186-189.
Crossref
|
|
|
|
|
Bilitza D, Altadill D, Zang Y, Mertens C, Truhlik V, Richards P (2014). The international reference ionophere 2012-A model of international collaboration. Journal of Space Weather and Space Climate 4:A07.
Crossref
|
|
|
|
|
Bittencourt JA, Chryssafidis M (1994). On the IRI Model Predictions for the Low-Latitude Ionosphere. Journal of Atmospheric and Solar Terrestrial Physics 56(3):995-1009.
Crossref
|
|
|
|
|
Dickinson RE, Ridley EC, Roble RG (1981). A three-dimensional general circulation model of the thermosphere. Journal of Geophysical Research 86:1499-1512.
Crossref
|
|
|
|
|
Dickinson RE, Ridley EC, Roble RG (1984). Thermospheric general circulation with coupled dynamics and composition, Journal of the Atmospheric Sciences 41:205-219.
Crossref
|
|
|
|
|
Gnabahou A, Ouattara F (2012). Ionosphere variability from 1957 to 1981 at Djibouti Station. European Journal of Scientific Research 73(3):382-390.
|
|
|
|
|
Jin S, Park JU (2007). Ionospheric Tomography: A Comparison with the IRI-2001 Model over South Korea. Earth Planet Space 59(4):287-292.
Crossref
|
|
|
|
|
Nanema E, Zoundi C, Drabo NK, Ouattara F (2020). Highlighting seasonal anomaly in ionosphere during minimum and maximum solar cycle phases. International Journal of Advanced Research 8(06):51-56.
Crossref
|
|
|
|
|
Ouattara F, Zoundi C, Fleury R (2012). Comparison between CODG TEC and GPS based TEC observations at Koudougou station in Burkina Faso. Indian Journal of Radio and Space Physics 41:617-623.
|
|
|
|
|
Qian L, Burns AG, Chamberlin PC, Solomon SC (2010). Flare location on the solar disk: Modeling the thermosphere and ionosphere response. Journal of Geophysical Research 115(A9):311.
Crossref
|
|
|
|
|
Richmond AD, (1995). Ionospheric electrodynamics using magnetic apex coordinates. Journal of Geomagnetism and Geoelectricity 47:191-212.
Crossref
|
|
|
|
|
Richmond AD, Ridley EC, Roble RG (1992). A thermosphere/ionosphere general circulation model with coupled electrodynamics. Geophysics Research Letter 19(6):601-604.
Crossref
|
|
|
|
|
Rishbeth H, Muller-Wodarg ICF (2006) Why is there more ionosphere in January than in July? The annual asymmetry in the F2-layer. Annales Geophysicae 24:3293-3311.
Crossref
|
|
|
|
|
Rishbeth H, Gariott OK (1969). Introduction to ionospheric physics. In J. Van Mieghem (Ed.). International Geophysics Series pp. 160-189. Academic Press, New York.
|
|
|
|
|
Rishbeth H, Muller-Wodarg ICF, Zou L, Fuller-Rowell TJ, Millward GH, Moffett RJ, Idenden DW, Aylward AD (2000). Annual and semiannual variations in the ionospheric F2-layer: II. Physical discussion. Annales Geophysicae 18(8):945-956.
Crossref
|
|
|
|
|
Roble RG, Ridley EC (1987). An auroral model for the NCAR thermosphere general circulation model (TGCM). Annales Geophysicae 5A(6):369-382.
|
|
|
|
|
Roble RG, Ridley EC, Dickinson RE (1982). Global circulation and temperature structure of the thermosphere with high latitude convection. Journal of Geophysical Research 87:1599-1614.
Crossref
|
|
|
|
|
Roble RG, Ridley EC, Richmond AD, Dickinson RE (1988). A coupled thermosphere/ionosphere general circulation model. Geophysics Research Letter 15(12):1325-1328.
Crossref
|
|
|
|
|
Shapley AH, Beynon WJG (1965). Winter anomaly in ionospheric absorption and stratospheric warmings, Nature 206:1242-1243.
Crossref
|
|
|
|
|
Van Zandt TE, Knecht RW (1964). The structure and physics of the upper atmosphere. In D. P. Le Galley & A. Rosen (Eds.), Space Physics pp. 166-225. Willey, New York.
|
|
|
|
|
Van Zandt TE, Norton RB, Stonehocker GH (1960). Photochemical rates in the equatorial F2 region from the 1958 eclipse. Journal of Geophysical Research 65:2003-2009.
Crossref
|
|
|
|
|
Yonezawa T, Arima Y (1959). On the seasonal and non-seasonal annual variations and the semi-annual variation in the noon and mid night electron densities of the F2 layer in middle latitudes. Journal of Radio Research Laboratories 6:293-309.
|
|
|
|
|
Zerbo JL, Ouattara F, Zoundi C, Gyébré A (2011). Solar cycle 23 and geomagnetic activity since 1868. Revue CAMES Série A 12(2):255-262.
|
|