Full Length Research Paper

ABSTRACT
This study was carried out to study the physicochemical and sensory characteristics of Abacha with different particle sizes. Dried cassava strips (Abacha) were produced in variable length, 2, 2.5 and 5 mm with the average length of 5 cm market size used as control. The proximate, physicochemical, functional and sensory properties were analyzed for various Abacha strips. The proximate composition of the Abacha chips ranged from 9.1 - 13.3% for moisture content, ash 2.5 - 2.8%, protein 1.9%, fibre 1.0 - 1.2%, fat 0.5 - 0.6%, and carbohydrate 80.7 - 84.4%. The physicochemical composition of the Abacha samples showed a pH range of 4.2 - 4.5, total titratable acidity 0.0 - 0.1%, hydrogen cyanide 2.5 - 2.6 mg.100 g- 1, phytate 0.5 mg.100 g-1 and no tannin detected. In general, all the Abacha strips were accepted, although the degree of likeness decreased as the particle size decreased. Consumers preferred market Abacha to the other samples based on familiarity followed by the 5 mm strips. Principal Component Analysis (PCA) indicated that 5 cm and 5 mm length Abacha sizes accounted for 80.5% of the variation and were high in proximate and physicochemical properties while 2 and 2.5 mm Abacha sizes accounted for 16.3% of the variation with 2 mm higher in functional properties and 2.5 mm length lower than all samples in functional, proximate and physicochemical properties. The reduced particle-sized strips could be used as breakfast cereals.
Key words: Cassava, abacha, particle size, sentiment, functional, consumer acceptability.
INTRODUCTION
Cassava (Manihot esculenta Crantz), a dicotyledonous plant traditionally an African staple food grown by small- starchy root crop that develops underground. The edible, tuberous root grows between 15 and 100 cm and 0.5 and 2.0 kg in mass. It is a primary food security crop in Africa because of its resistance to drought and disease, flexible planting and harvest cycle, and tolerance of low-quality soils. After maturity, cassava can remain in the ground for scale farmers belong to the family Euphorbiaceae (Meridian Institute, 2013; Alves, 2002). Cassava is a up to 18 months depending on the variety and adapts well in regions that suffer both environmental and political hardships (Meridian Institute, 2013).
Approximately 90% of cassava produced in West Africa is for human consumption and less than 10% is semi-processed for on-farm animal feed (Sanni et al., 2009). Among the starchy staples, cassava has about 40% higher than rice and 25% more than maize in carbohydrates. Consequently, cassava is the cheapest source of calories for both human nutrition and animal feeding (Tonukari, 2004). Cassava is a main staple food crop in Nigeria as its products are found in the daily meals of Nigerians and cut across cultures and social divides within Nigerian households. Mostly, the bulk of the tuber is consumed locally as traditional food and it is the most important food crop by production, and second by consumption (FAO, 2014). Traditionally, the most common food products obtained from the processing of cassava in Nigeria are garri, Abacha, fufu, starch, lafun, chips and flour.
Abacha is prepared from shredded boiled cassava, soaked for 8 to 24 h in cold water, washed thoroughly and then dried (Ekwu et al., 2014). It is consumed as a snack or main dish in the eastern states of Nigeria and considered a delicacy in some communities, where the dried slices are rehydrated and then mixed with palm oil sauce (Ncha) and smoked fish or meat with other seasonings referred to as Abacha Ncha. It is also a ceremonial dish served during indigenous festivals, such as agricultural festivals, funerals and child naming (Sanni et al., 2009).
In most parts of the country where Abacha (dried cassava strips) is produced, the strips are long, ranging from 3 to 5 cm. Shorter strips of Abacha are not common and a lack of standardized particle sizes has also contributed to the limited use of Abacha in the preparation of meals other than taking it as a snack or as a salad (African salad). Abacha is a food product, though locally produced is hardly found on shelves in departmental stores across the country. Furthermore, not much is known about the physicochemical and sensory properties of Abacha chips. Consequently, it is necessary to study the physicochemical and sensory characteristics of Abacha with different particle sizes to find alternative food use for the chips.
The objectives of this study were to (1) develop standardized Abacha of varied particle sizes (length-wise) from the commercial Abacha strips; (2) evaluate the functional properties of Abacha with different particle sizes; (3) determine the consumer acceptability of the varied particle sizes when prepared as a meal of “Abacha Ncha” and (4) compare the physicochemical properties of the consumer acceptable Abacha strips to the commercial.
MATERIALS AND METHODS
Source of materials
Commercially processed unstandardized/varied length sizes of Abacha strips were bought from a local market in Awka, Anambra State, Nigeria and were used as the intermediate product as well as the control for this study.
Measurement of commercial cassava strips length and cleaning
The commercial dried Abacha strips were dry cleaned to remove all physical and biological contaminants (sand, stones, leaf particles, insects, etc.) by manual sorting. The length of the strips was measured 8 times using a vernier calliper and expressed as the average length in mm.
Production of cassava strips with different particle sizes
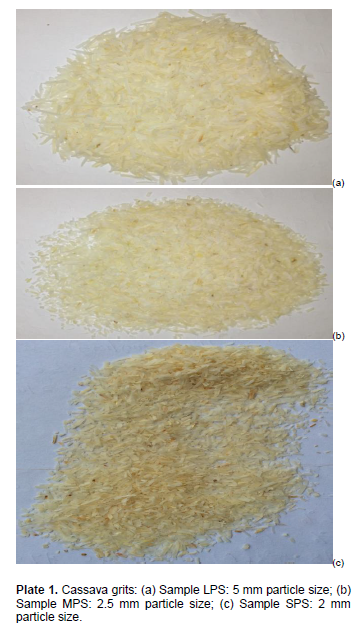
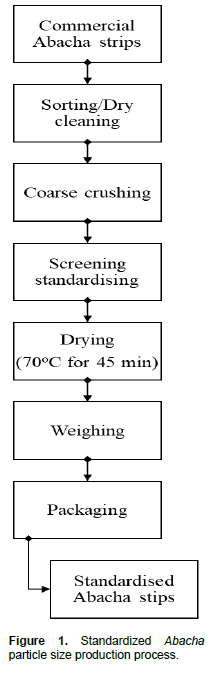
The cleaned Abacha was then coarsely crushed by passing them through a hammer mill twice after which it was passed through a screen of different mesh sizes (2, 2.5 and 5 mm) to obtain standardized Abacha particle sizes (Plate 1). The produced samples were oven-dried to reduce the microbial load that may be present in the samples using a hot air oven at 70°C for 45 min. The samples were allowed to cool, weighed and then packed into clean marked plastic containers in their respective sizes (Figure 1). A one-factor completely randomized design with three different treatment levels was employed for the proximate, functional, anti-nutritional and sensory analysis of the Abacha strips.
Determination of functional properties of Abacha
Bulk density determination of Abacha strips
The method described by Nwanekezi et al. (2001) was used to determine the bulk density of the Abacha strips. Each sample was slowly filled into a 250 mL cylinder mark. The base of the cylinder was gently tapped with the fingers until no further decrease of the sample. The sample weight was noted. The bulk density was calculated as mass per unit volume of the sample using Equation 1. The mean of the triplicate measurement was taken as the estimate of the bulk density of each Abacha strip.

Water absorption capacity determination of Abacha strips
The water absorption capacity (WAC) of the Abacha strips was estimated using the method of Omah (2012). Abacha strips (1 g) meted out into a weighed centrifuge tube with 10 mL of distilled water added to it and combined thoroughly. This mixture was allowed to stand for 1 h after which it was centrifuged at 3500 rpm for 30 min. The excess water was decanted and the tube inverted over a Whatman No. 1 filter paper to drain and dry. The volume of the water absorbed was estimated by the difference of the initial and final volumes of water in the sample and the water absorption capacity (%) calculated using Equation 2.

Oil absorption capacity determination of Abacha strips
The oil absorption capacity (OAC) of the Abacha strips was estimated using the method reported by Adebowale et al. (2005). An aliquot of oil (10 mL) of known specific gravity was added to 1 g of the sample in a 250 mL measuring cylinder.
The content was mixed for 3 min using a magnetic stirrer and thereafter centrifuged at 3500 rpm for 30 min. The supernatant was measured into a 10 mL graduated cylinder and the oil absorbed (%) by the samples was calculated using Equation 3.

Swelling capacity determination of Abacha strips
The swelling capacity of the Abacha strips was estimated as described by Bankole et al. (2013) with slight modifications. Abacha strips (1 g) were weighed into a test tube containing 10 mL of distilled water, mixed and heated with shaking in a water bath at 60°C for 30 min. The test tube was centrifuged at 3500 rpm for 15 min and the supernatant decanted.
The weight of the sample was taken and the swelling capacity was estimated from Equation 4.

Production of Abacha Ncha with different particle sizes
The Abacha strips were rehydrated by soaking each in hot water for 30 min. The rehydrated strips were passed through a colander to drain the water for 5 min. Ncha was prepared (an oil emulsion prepared by mixing palm oil with potash, dry pepper). The rehydrated Abacha strips were each mixed with the ncha to produce the Abacha Ncha.
Sensory evaluation of Abacha Ncha with different particle Sizes
Sensory evaluation of the three Abacha Ncha from the standardized particle sizes and the market Abacha Ncha as control was carried out using 50 untrained consumer panellists. The samples were identified with a 3-digit code. The panellists were instructed to appraise the samples for appearance, texture, chewiness, aroma and overall acceptability on a 9-point hedonic scale, 1 = dislike extremely, 2 = dislike very much, 3 = dislike moderately, 4 = dislike slightly, 5 = neither like nor dislike, 6 = like slightly, 7 = like moderately, 8 = like very much, 9 = like extremely (Busie et al., 2017). The panellists rinsed their mouths with water in between tasting the samples. The most acceptable Abacha strip and the commercial strips were further analysed for physicochemical and anti-nutritional properties.
Sentiment analysis of Abacha Ncha
The individual comments for each sample and the general comments from the sensory evaluation were separately loaded into the Konstanz Information Miner (KNIME) software. The comments were tagged to positive and negative sentiments using the Multi-perspective question answering (MPQA) sentiment corpus followed by pre-processing by filtering and stemming. The terms were converted to strings and colour coded according to the sentiment category. The categories were filtered and a word cloud of each was produced.
Physicochemical and anti-nutrient of most acceptable Abacha
Proximate composition of most acceptable Abacha
The moisture, ash, protein, crude fibre and fat contents of the Abacha strips and that of the commercial (control) were determined using the AOAC (2010) method. The moisture, ash, protein, crude fibre, and fat contents were determined according to AOAC (2010) method. The available carbohydrate was determined by difference.
pH determination of most acceptable Abacha
The pH of the Abacha sample was determined in a 10% (w/v) mixture of the sample in distilled water. The sample was mixed thoroughly and the pH was measured using a standard pH meter by dipping the pH electrode into the mixture of the sample particulates. After 10 min of equilibration, the pH reading of the sample was taken.
Total titratable acidity determination of most acceptable Abacha
The total titratable acidity was measured using the colour indicator method reported by Obilie et al. (2004) where 10 mL of the concentration of the Abacha suspension was used for the titration after filtration using a Whatman No. 1 filter paper. A funnel was used to pour 0.1 M NaOH into a 25 mL burette until it reached the zero mark. The total titratable acidity was estimated from Equation 5.

Determination of anti-nutritional factors of Abacha strips
Phytate content determination of Abacha strips
The spectrophotometric method reported by Pearson (1976) with modifications was used to estimate the phytate content of the cassava strips. A 1 g of sample was weighed into a 500 mL flat bottom flask. The flask was placed in a shaker and the sample was extracted with 2.4% HCl for 1 h. The aliquot was filtered with 5 mL of the filtrate pipetted and diluted with distilled water to 25 mL, 15 mL of NaCl was added to 10 mL of the diluted sample and this was passed through an ample resin (200 - 400 mesh) to elude inorganic phosphorus. About 15 mL of 0.7 M NaCl was added to the solution and mixed for 5 s on a vortex mixer, centrifuged at 3500 rpm for 10 min. The supernatant absorbance was read at 520 nm wavelength using UV spectrophotometer. The phytate concentration was read off from a standard curve prepared with standard inositol phytate and the value expressed in mg/l00 g from Equation 6.

Hydrogen cyanide determination of Abacha strips
The hydrogen cyanide content was estimated using the alkaline picrate colorimetric method reported by Bradbury et al. (1999). A 1 g of the sample was weighed into a conical flask and 200 mL of distilled water was added to it and thoroughly mixed. With the aid of a rubber stopper, a strip of alkaline picrate paper was suspended over the mixture such that the paper did not touch the surface of the mixture and was incubated for 18 h at room temperature. The picrate paper was carefully removed and placed in 60 mL of distilled water. Meanwhile, a standard cyanide solution was prepared and treated as described earlier. The absorbance from the standard and the sample was measured in a spectrophotometer at 540 nm. The cyanide content (HCN) in mg/kg was calculated from Equation 7.

Where W = weight of sample analyzed (g); Au = Absorbance of the sample (nm) and As = Absorbance of the standard HCN solution (nm).
Tannin content determination
Tannin content was estimated using the Folis-Denis colorimetric method reported by Kirk and Sawyer (1998). A known amount of the sample (5 g) was meted in 50 mL of distilled water and shaken. The mixture was allowed to stand for 30 min at 28oC before being filtered using a Whatman grade1 filter paper. Into a 50 mL volumetric flask was dispersed 2 mL of the extract. After which, 2 mL of standard tannin solution (tannic acid) and 2 mL of distilled water was put into separate volumetric flasks to serve as standard and reagent was added to each of the flasks. Then 2.5 mL of saturated Na2CO3 solution was added into each flask. The content of each flask was made up to 50 mL with distilled water and allowed to incubate at 28°C for 90 min. The absorbance was measured using a spectrophotometer at 260 nm. The blank reagent was used to calibrate the instrument at zero.
Statistical analysis of data
The results were expressed as mean ± standard deviation of triplicate values. Multivariate analysis of variance (MANOVA) was used to ascertain differences between treatments and Duncan multiple range test was used to distinguish means where significant differences existed among samples at a 5% confidence level. Principal Component Analysis was also carried out to extract the components that explained the variation in the characteristics of the crushed cassava strips (IBM SPSS version 25).
RESULTS AND DISCUSSION
Functional properties of Abacha with different particle sizes
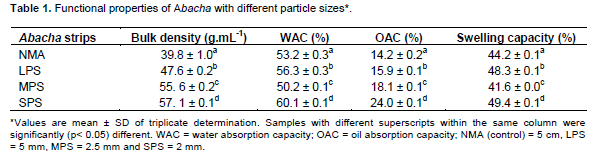
The functional properties of Abacha with different particle sizes were compared with the control sample (NMA) shown in Table 1. There were significant (p < 0.05) differences in all the functional properties. The bulk densities of the Abacha processed into different particle sizes were significantly different from each other and the control (NMA). The mean values ranged from 39.8 g/mL for the control to 57.1 g/mL for the smallest particle size (SPS). Different values for bulk density have been reported for cassava products. Abu et al. (2006) reported a range of 40.1 to 50.2 g.cm-3 for garri. Ekwu et al. (2011) reported that the bulk density of cassava flour processed from dried Abacha slices ranged from 50.5 to 57.1 g.cm-3. The results in this work fall within these ranges. Bulk density governs the fill weight of food materials; Abacha, when size is reduced, will give a characteristic quality of good filling weight even when it is reduced to tiny particles such as seen in flour (Ekwu et al., 2011).
The water absorption capacity of the Abacha with the different particle sizes was significantly (p < 0.05) different. The control sample (NMA) had the lowest value (53.2 g.mL-1) and there was an observed increase in value as the particle sizes decreased with SPS being the highest (60.1 g.mL-1). Oluwole et al. (2004) reported that size reduction of cassava, gelatinization of starch and swelling of crude fibre which may occur during heating increases the water absorption capacity of cassava products. From this study, strips with increased water absorption capacity rehydrated slower than those with lower values, thus showing a significant reduction in the meal preparation time in samples with a lower water absorption capacity.
The oil absorption capacity shows a significant (p < 0.05) difference in all the samples. The control (NMA) had the lowest value (14.2 g.mL-1) and there was an observed increase in value as the particle sizes decreased with SPS having the highest absorption (24.0 g.mL-1). Oluwole et al. (2004) also reported that the size reduction of cassava in processing can significantly increase the oil absorption capacity of cassava products.
The swelling capacity of the samples was significantly (p < 0.05) different. A gradual increase was observed in the swelling capacities of the samples ranging from the control to the smallest particle size (SPS). Swelling capacity is an important functional property in a food system and it has been reported that good quality Abacha should have a swelling capacity of 30 to 50 volume increase (Maxiya-Dixon et al., 2007; Sanni et al., 2008). The swelling capacities of all the Abacha samples were in agreement with the earlier-stated report.
All the samples were compared favourably with each other as all samples had good functional properties though they were significantly (p < 0.05) different from the other. Chisenga et al. (2019) reported that sources of variations in cassava physicochemical properties were due to differences in amylose, protein, lipid contents and starch granule size and distribution. Thus, depending on end use the sample which caters to that objective of production can be selected.
Sensory characteristics of Abacha with different particle sizes and consumer sentiment
The sensory characteristics of Abacha with different particle sizes were compared with the commercial sample (Abacha strips purchased from the local market) shown in Table 2. Significant differences existed in all the sensory attributes. The appearance, aroma, texture, chewiness and overall acceptability follow the same trends of a significant (p < 0.05) decrease in acceptability as the particle sizes decreased from the control NMA (average length of 5 cm) to SPS (2 mm).
In appearance, they were all significantly (p < 0.05) different from each other. NMA had the highest scoring value which showed that the consumer panellists liked the sample very much, followed by LPS (5 mm), liked moderately with SPS (2 mm) having the lowest score and disliked slightly.
In terms of aroma, NMA, LPS and SPS were not significantly different from each other, while MPS and SPS also showed no significant difference among each other. MPS had the lowest mean score but was not significantly different from SPS in the aroma.
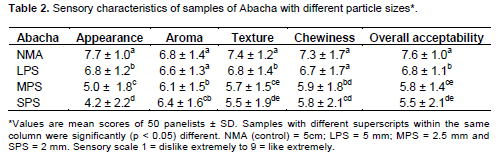
The texture of the samples NMA and LPS differed significantly (p < 0.05) from all other samples, while MPS and SPS showed no significant difference in texture between each other. The difference observed in NMA and LPS could be attributed to the change in the length of the Abacha strips, reducing the ratings of the samples, while samples MPS and SPS were not significantly different from each other and this can be attributed to their particle sizes being close to each other in terms of length size 2.5 to 2 mm, respectively.
For the chewiness attribute, the control sample (NMA) had the highest ratings compared to all other samples evaluated, and a decrease in trend was observed as the particle sizes were reduced in length for all the samples. NMA and LPS were not significantly different from each other but both showed a significant (p < 0.05) difference from MPS and SPS. MPS and SPS were also not significantly different from each other. This could be attributed to the fact that LPS is closer in particle size to NMA and MPS and SPS are closer in particle sizes which invariably imparted the judgments of the panellists.
In overall acceptability, NMA was significantly (p < 0.05) different from the other samples, however, there was no significant difference between samples MPS and SPS. The degree of likeness decreased as the particle size decreased. The mean scores indicated that all samples were generally accepted, though sample SPS appeared to be the least preferred with a mean score of 5.5. NMA was the most preferred with a mean score of 7.6 which translates to like very much. The low and high mean scores of both SPS and NMA, respectively could be attributed to the smaller particle size of SPS compared to other samples and that of NMA could be a result of the familiarity in the form in which panellists were generally used to Abacha. Samples MPS and SPS were not significantly different from each other and this can be attributed to the similarity in particle sizes. Based on the overall acceptability, LPS was closest in preference to the control (NMA) and hence considered the best of the three sizes. LPS was then compared to the control sample (NMA) in terms of the proximate and physicochemical characteristics.
The high consumer acceptability of the commercial Abacha may be as a result of the familiarity of the panel members to the form of Abacha in which Abacha is served as a meal thus, influencing the overall acceptability of the samples of Abacha presented as the strip lengths decreased, and it could be assumed that the smaller particle sizes were less accepted.
The sentiments for the Abacha samples were represented using a word cloud. This is the pictorial representation of the word frequencies of comments made for the samples in the sensory evaluation, thus the larger the appearance of the word, the higher its frequency of occurrence. Positive and negative sentiments were recorded for all the samples. For SPS the words of the positive sentiment such as “prefer” and “better” had a higher frequency of occurrence. The words “best” and “taste” were next in terms of usage frequency followed by the word “improved” and seen to be the least used word, thus having the least amount of occurrence in the comments made by panellists. The positive comments made by the panellists on sample SPS in the sensory evaluation ranged from the sample having the best taste amongst the other samples, preference of particle size, best in ingredient absorption, better in texture than other samples and further improvement needed on the sample.
The negative sentiments for SPS recorded the words “least” being larger in occurrence than the words “unacceptable” and “bad”. The word “bad” was the least word used by the panellists. The negative comments on sample SPS ranged from the appearance of the sample being unacceptable, bad and should be improved upon. The particle size should be increased as the sample had a sandy mouth feel and it had the least overall acceptability.
The sentiments for NMA were both positive and negative. The positive sentiment words included “best” which showed the highest frequency of usage amongst the samples. Other words such as “prefer”, “taste”, “good”, “like”, “pleasing” and “love” were also used with the word “love” having the least frequency of occurrence. The positive statements made by the panellists for sample NMA ranged from it being the most preferred amongst the other samples, overall best, better appearance than other samples, best in taste, best in length size(though this occurred less frequently) and particularly pleasing to chew.
The negative sentiments associated with sample NMA were the words “long” and “least”. The sizes of these words show that their frequencies of occurrence were low. The negative comments which were associated with NMA ranged from the sample having the least aroma, least taste, least chewiness, too long strip size and an indication for improvement on the characteristic attributes mentioned.
The positive sentiments highlighted include the word “better” which had the highest frequency of occurrence and “best” having the lower frequency of occurrence. The comments ranged from sample MPs being better than
NMA in terms of length size and MPS being the overall best in the opinion of some panel members. The negative sentiment highlighted was the word “bad” for sample MPS. From the negative comments made by panellists for MPS, it was generally not accepted by some panel members.
The general sentiments of the panellists included words such as “moderate”, followed by words like “above”, “better”, “good” all appeared to have the same frequencies of occurrence, with the words “like”, “best” “okay” and “good” all appeared to be of the same size hence signifying the same level of occurrence in the comments section. The comments of panellists ranged from the general appreciation of the work conducted, which was shown by the high usage of the word “painstaking” (painstaking effort), the samples generally liked and preparation preferences. The negative sentiments from the word cloud display the word “least”. This word represents how the panellists perceived the samples generally and from comments made; samples MPS and SPS received more negative comments, mostly in terms of their appearance.
Proximate composition of Abacha commercial and 5 mm abacha strips
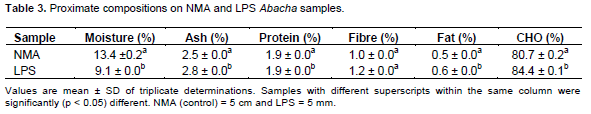
The proximate composition of the best sample LPS (5 mm) was compared to the control sample NMA (5 cm) shown in Table 3. There were significant (p < 0.05) differences between the samples in proximate composition. The moisture content ranged from 9.1 to 13.4% for LPS and NMA, respectively.
The control sample (NMA) having the higher moisture content compared to LPS indicates that the additional heat treatment (oven drying) that was given to LPS as it was heated at 70°C for 45 min in a hot air oven after crushing and standardizing resulted in low moisture content. The control sample (NMA) was not given a heat treatment as it was analyzed in the form in which consumers who purchase Abacha normally process before consumption as consumers usually do not pass the product through a heating process before rehydration. The low moisture content of LPS is in agreement with that reported by Ekwu et al. (2009). The final moisture content of LPS (9.11%) after the heat treatment was slightly lower than that reported by Ekwu et al. (2009) which was 9.53% for laboratory prepared Abacha. The difference could be a result of differences in the processing methods employed in the work.
The ash content for both samples was significantly (p < 0.05) different from each other. The ash content for LPS was higher than that of NMA and this can be as a result of the decrease in moisture content of LPS due to the heat treatment. This significant increase in ash content is in agreement with Onyeike et al. (2010) in which the authors reported that a decrease in moisture content of most root and tuber crops can significantly lead to an increase in their ash content.
In terms of protein content, there was no significant difference between the samples. This can be deduced that the additional heat treatment given to LPS did not affect the protein content significantly (p > 0.05). Ngiki et al. (2014) reported that cassava tubers have very low protein content (0.7 to 2.5%) in fresh weight. Thus, a cassava meal must be supplemented with a protein food source (Nagib and Sousa, 2007).
The crude fibre content in both samples showed a significant (p < 0.05) difference between them. LPS had a higher value than the control sample (NMA). This increase in the fibre content with a decrease in the moisture content follows the literature work reported by Morgan (2016) that a decrease in the moisture content of cassava leads to a significant increase in crude fibre, hemicellulose and cellulose levels.
The fat content of both samples was significantly (p < 0.05) different with LPS having a higher fat content value. Abacha, which is a cassava product, is low in fat as cassava has been reported to have very low-fat content (Gomes et al., 2005). Gomes et al. (2005) reported that cassava contains less than 1% fat content when compared to other root crops. The low level of fat in the both samples of Abacha means that it is a poor source of fat-soluble vitamins (Promthong et al., 2005). Therefore, the fat content of the samples of Abacha is in agreement with the work reported by Gomes et al. (2005).
The carbohydrate content of both samples were significantly (p < 0.05) different, with the control sample (NMA) having a lower carbohydrate content than LPS. There was a significant increase in the mean value of the carbohydrate content of LPS. This observed increase in the carbohydrate content in LPS could be an indication that the further processing (heating) of the sample influenced the nutrient availability as also reported by Adepoju et al. (2010).
It can be deduced that the moisture contents of NMA and LPS played an influential role in the nutrient availability in the samples. Thus, a reduction in the moisture content led to an increase in all proximate parameters checked, except in the case of the protein content which showed no significant difference, though the protein content of LPS was slightly higher than that of the control (NMA).
Physicochemical properties of Abacha
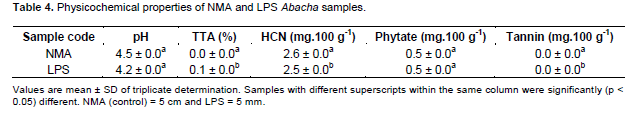
The physicochemical properties of the best sample were compared to the control sample NMA (control) and LPS (5 mm particle size) Abacha shown in Table 4. There exists a significant (p < 0.05) difference in the HCN content in both samples as their mean scores varied from 2.6 to 2.5 mg.100 g-1 for NMA and LPS, respectively. The low HCN in the samples is as a result of the soaking and drying processes. The lower HCN observed in LPS could be attributed to the further heat treatment it received. This difference observed is supported by the report of Lambri et al. (2013) that the drying process lowered the HCN level by more than 90%. Thus, it is observed that the hydrogen cyanide content in food products decreases by drying and processing operations like soaking and cooking (Cardoso et al., 2005). The HCN content of both samples was lower than the safe level of 10 mg.kg-1 recommended by FAO/WHO (Adindu et al., 2003).
The pH for both samples LPS and NMA ranged from 4.2 to 4.5 and showed no significant difference among the samples. Oluwole et al. (2004) reported that the pH of fresh cassava is 6.7. This indicated that the processing carried out on these samples reduced the pH of the Abacha. This reduction could be a result of slight fermentation that occurred during processing. Statistically, the additional heat treatment given to sample LPS did not significantly (p > 0.05) affect the pH of the sample. Oluwole et al. (2004) also reported that the production of lactic acid as a result of the slight fermentation during the drying of the wet Abacha slices could have increased lactic acid, thereby leading to a reduction of the pH of the Abacha product.
The titratable acidity (TTA) of the Abacha samples ranged from 0.0 to 0.1% for sample NMA (control) and LPS, respectively. Both samples differed significantly (p < 0.05) from each other. It can be said that further heat treatment (drying) of sample LPS increased the TTA to 0.1% and this report is in agreement with that reported by Ekwu et al. (2011), where it was reported that drying increased the TTA of wet Abacha slices from 0.207 to 0.230%.
The phytate content for NMA and LPS was 0.5% respectively. Statistically, both samples were not significantly different from each other. The phytate values obtained in the result showed that it was much lower than the lethal dose of phytate (250-500 mg.100 g-1) reported by Oyetayo and Oyetayo (2013). The values obtained agreed reasonably well with the phytate levels reported by Okpala and Okoli (2011) which was between 0.45 and 0.70 mg.100 g-1 for a root crop product. The result showed a reduction in the phytate level of the sample compared to that of fresh unprocessed cassava with a reported phytate content of 226 mg.100 g-1 by Oyetayo and Oyetayo (2013), which indicates that processing caused a large reduction in the phytate levels of the Abacha samples. Oyetayo (2006) also reported that phytate concentrations in cassava were reduced by fermentation, soaking and heating methods. Fermentation makes use of microbes, some of which secrete phytases that hydrolyze a significant portion of phytate, reducing its affinity for various actions (Oyetayo, 2006; Oboh et al., 2003).
The value obtained for tannins in both samples showed that the presence of tannins in the samples were extremely low, tending to not being present. From the result, we can say that processing significantly reduced the tannin levels in Abacha to levels that may be considered insignificant. This low value of tannins present in these samples would make them suitable for human consumption as the consumption of high concentrations of tannins in a food product can be deleterious to health. Tannin being a secondary phenolic plant metabolite with one or more hydroxyl substrates bonded to an aromatic ring, tannin produces anthocyanoside, a toxic product on acid degradation (Getachew et al., 2000; Han et al., 2007).
Principal components describing the variation in Abacha characteristics
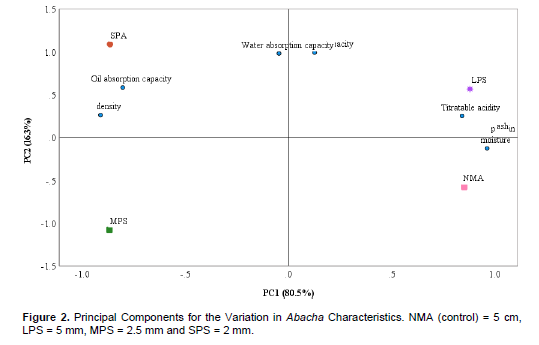
Principal component analysis (PCA) helps to visualize the most important information held in a data set. PCA finds the groupings of variables that explain the main trends in the data set from the principal component chart shown in Figure 2. There are two components - principal component 1 (PC 1) and principal component 2 (PC 2). The largest possible variance which accounts for as much of the variability in data is seen in PC 1. The samples can be categorized into three groups. NMA (5 cm) and LPS (5 mm) are in one group, SPS (2 mm) in the second group and MPS (2.5 mm) in the third group. Samples NMA and LPS are in group 1 and related to PC 1 accounting for 80.5% variation. These samples are high in proximate and physicochemical properties compared to the others. PC 2 accounting for 16.3% variation correlates to SPS which is higher in functional properties (bulk density, water absorption capacity and swelling capacity) than the other samples. MPS which is the third group is lower than all the other samples in functional, proximate and physicochemical properties.
CONCLUSIONS
By crushing the commercial Abacha strips in a hammer mill and passing the crushed product through different sieves with varying mesh sizes it was possible to produce three standardized particle sizes 2, 2.5 and 5 mm. The commercial Abacha (5 cm) and the 5 mm strips were high in proximate and physicochemical properties compared to the others. The 2 mm strips were higher in functional properties (bulk density, water absorption capacity and swelling capacity) than the other samples. The 2.5 mm strips were lower than all the other samples in functional, proximate and physicochemical properties. Though the commercial Abacha strips were preferred to the other samples when eaten as a meal of Abacha Ncha, the other samples could be highly accepted if used in other meal forms such as porridge or breakfast cereal. Consumer acceptability of the samples prepared from the commercial Abacha indicated the possibility of using different particle sized strips thereby expanding the use of Abacha.
CONFLICT OF INTERESTS
The authors have not declared any conflict of interests.
REFERENCES
|
Abu JO, Badifu GTO, Akpapunam MA (2006). Effect of crude palm oil inclusion on some physicochemical properties of gari -A fermented cassava Food product. Nigerian Food Journal 24(1):73-75. |
|
|
Adebowale YA, Adeyei IA, Oshodi AA (2005). Functional and physicochemical properties of flour from six Mucuna Species. African Journal of Biotechnology 4(12):1461-1468. |
|
|
Adepoju OT, Adekola Y, Mstapha SO, Ogunola SI (2010). Effect of processing on nutrient retention and contribution of cassava (Manihot spp) to nutrient intake of consumers. African Journal of Food Agriculture Nutrition and Development 10(2):2099-2111. |
|
|
Adindu MN, Olayemi FF, Nze-Dike OU (2003). The cyanogenic potential of some cassava products in Port Harcourt markets in Nigeria. Journal of Food Composition and Analysis 16:21-24. |
|
|
Alves AAC (2002). Cassava Biology, Production and Utilization. CABI Publishing, Wallingford, UK pp. 67-89. |
|
|
Association of Official Analytical Chemists (AOAC) (2010). Official Methods of Analysis. 18th ed. Association of Official Analytical Chemists, Washington, D.C., U.S.A. |
|
|
Bankole Y, Tanimola A, Odunukan R Samuel D (2013). Functional and nutritional characteristics of cassava flour (lafun) fortified with soybeans. Journal of Educational and Social Research 3(8):163-172. |
|
|
Bradbury MG, Egan S, Bradbury JH (1999). Picrate paperkits for determination of total cyanogens in cassava roots and all forms of cyanogens in cassava products. Journal of the Science of Food and Agriculture 79(4):598-601. |
|
|
Busie MD, Alamu EO, Popoola IO, Yomeni M (2017). Nutritional and Sensory Properties: Snack food made from high?quality cassava flour and legume blend. Food Science and Nutrition Journal 5(3):805-811. |
|
|
Cardoso AP, Mirione E, Ernesto M, Massaza F, Cliff J, Haque RM, Bradbury JH (2005). Processing of cassava roots to remove cyanogens. Journal of Food Composition and Analysis 18(5):451-460. |
|
|
Chisenga SM, Workneh TS, Bultosa G, Laing M (2019). Characterization of physicochemical properties of starches from improved cassava varieties grown in Zambia. AIMS Agriculture and Food 4(4):939-966. |
|
|
Ekwu FC, Ngoddy PO, Aniekwe CO (2009). Abacha making qualities of selected cassava varieties. Nigerian Food Journal 27(1):49-58. |
|
|
Ekwu FC, Ngoddy PO, Uvere PO (2011). Functional and rheological properties of cassava flour processed by adaptation of traditional "abacha" processing technology. Journal of Raw Materials Research 9(1):17-30. |
|
|
Ekwu FC, Ngoddy PO, Uvere PO (2014). Effect of processing on the quality of flour, slices and its flour derived from cassava (Manihot esculenta Crantz) TMS97/4779. African Journal of Food Science 8(9):476-483. |
|
|
Food and Agriculture Organization (FAO) (2014). Why Cassava? Accessed on 21/01/2018. |
|
|
Getachew G, Makkar HPS, Becker K (2000). Effect of polyethylene glycol on in-vitro degradability of nitrogen and microbial protein synthesis from tannin-rich browse and herbaceous legumes. British Journal of Nutrition 84(1):73-83. |
|
|
Gomes E., Souza SR, Grandi RP, Silva RD (2005). Production of thermostable glucoamylase by newly isolated Aspergillus flavus A1. 1 and Thermomyces lanuginosusA13 37. Brazil Journal of Microbiology 36:75-82. |
|
|
Han X, Shen T, Lou H. (2007). Dietary polyphenols and their biological significance. International Journal of Molecular Sciences 8(9):950-988. |
|
|
Kirk RS, Sawyer R (1998). Pearson's Composition and Analysis of Foods. 9th edition. Churchill Livingstone Edinburgh pp. 17-20. |
|
|
Lambri M, Fumi MD, Roda A, De Faveri DM (2013). Improved processing methods to reduce the total cyanide content of cassava roots from Burundi. African Journal of Biotechnology 12(19):2685-2691. |
|
|
Maxiya-Dixon B, Dixon AGO, Adebowale AA (2007). Targeting Different End Uses of Cassava, Genotypic Variation for Cyanogenic Potentials and Pasting Properties International Journal of Food Science and Technology 42(8):969-976. |
|
|
Meridian Institute (2013). Cassava Value Chain Overview. Innovations for Agricultural Value Chains in Africa: Applying Science and Technology to Enhance Cassava, Dairy, and Maize value chains. Accessed on 18/01/2018. |
|
|
Morgan NK (2016). Cassava: Nutrient Composition and nutritive value in poultry diets. Journal of Animal Nutrition 2(4):253-261. |
|
|
Nagib MA, Sousa MV (2007). Amino acid profile in cassava and its interspecific hybrid. Genetic and Molecular Research Journal 6(2):292-297. |
|
|
Ngiki YU, Igwebuike JU, Moruppa SM (2014). Utilization of Cassava Products for Poultry feeding: A review. International Journal of Science and Technology 2(6):48-59. |
|
|
Nwanekezi EC, Ohagi NC, Afam-Anene OC (2001). Nutritional and organoleptic quality of infant formulation from natural and solid statefermented tubers (cassava, sprouted and unsprouted yam) - soybean flours blend. Nigerian Food Journal 19:55-62. |
|
|
Obilie EM, Tano-Debrah K, Amoa-Awua WK (2004). Souring and breakdown of cyanogenic glucosides during the processing of cassava into akyeke. International Journal of Food Microbiology 93(1):115-121. |
|
|
Oboh G, Akindahunsi AA, Oshodi AA (2003). Dynamics of phytate-zinc balance of fungi fermented cassava product (gari and flour). Plant Food for Human Nutrition Journal 58(3):1-7. |
|
|
Okpala LC, Okoli EC (2011). Nutritional evaluation of cookies produced from pigeon pea, cocoyam and sorghum flour blends. African Journal of Biotechnology 10(3):433-438. |
|
|
Oluwole OB, Olantunji O, Odunfa SA (2004). Process technology for conversion of dried cassava chips into gari. Nigerian Food Journal 22(1):66-77. |
|
|
Omah EC (2012). Production and evaluation of baked and extruded snacks from blends of millet, pigeon pea and cassava cortex flour. M. Sc. Thesis, Department of Food Science and Technology, University of Nigeria, Nsukka. |
|
|
Onyeike EN, Akaninwor JO, Ifemeje JC (2010). Effect of Heat Processing on the Proximate Composition and Energy Values of. Selected Nigerian Staple Foods from Oil Producing Areas of the Niger Delta. Journal of Nigerian Society for Experimental Biology 20(1):1-9. |
|
|
Oyetayo FL, Oyetayo VO (2013). Phytate-zinc dynamics of retted cassava product "pupuru" processed with water from different sources. Journal of Biological and Scientific Opinions 1(3):142-144. |
|
|
Oyetayo VO (2006). Nutrient and Anti-Nutrient Content of Cassava Steeped in Different Types of Water for "Pupuru" Production. Research Journal of Microbiology 1(5):423-427. |
|
|
Pearson D (1976). The Chemical Analysis of Foods 7th Edition. London: Churchill Livingstone. |
|
|
Promthong S, Kanto U, Tivawattanawanich C, Tongyai S, Isariyodom S, Markvichtr K (2005). Comparison of Nutrient Compositions and Carbohydrate Fractions of Corn, Cassava Chip and Cassava Pellet Ingredients. Proceedings of 43rd Kasetsart University Annual Conference, Thailand pp. 211-220. |
|
|
Sanni LO, Adebowale AA, Awoyale W, Fetuga GO (2008). Quality of gari (roasted cassava mash) in Lagos State, Nigeria. Nigerian Food Journal 26(2):125-134. |
|
|
Sanni LO, Onadipe OO, Ilona P, Mussagy MD, Abass A, Dixon AGO (2009). Success and challenge of cassava enterprises in West Africa: A case study of Nigeria, Benin and Sierra Leone. International Institute of Agriculture (IITA). |
|
|
Tonukari NJ (2004). Cassava and the Future of Starch. Electronic Journal of Biotechnology 7(1):2004. |
|
Copyright © 2024 Author(s) retain the copyright of this article.
This article is published under the terms of the Creative Commons Attribution License 4.0


