The effect of pasteurisation parameters and formulation components on the nutritional composition (carbohydrate, protein, fat, ash and moisture contents) of tigernut-soy milk blend was investigated. Twenty-six different formulations (F1 – F26) were prepared from tigernut and soy milk. The process treatments employed were; pasteurisation temperature, pasteurisation duration and mixing duration which varied from 60 – 80°C, 5-20 s and 5-15 min respectively. The results showed that F24 with blend constituents of 37, 5 and 50% of tigernut milk, soy milk, water and process treatments of 60°C, 20 s and 5 min of pt, pd and md respectively had the highest percentage of carbohydrate (12.53%) and fat (3.181%). The highest protein value (5.69%) was found in F11 with blend constituents of 27, 5 and 60% of tigernut milk, soy milk, water and process treatments of 80°C, 20 s and 5 min of pt, pd and md respectively. F23 with blend constituents of 11, 11 and 70% of tigernut milk, soy milk, water and process treatments of 80°C, 20 s and 5 min of pt, pd and md respectively had the highest ash (4.38%) content. The most abundant in moisture content (93.065%) was F18 with blend constituents of 5, 17 and 70% of tigernut milk, soy milk, water and process treatments of 60°C, 5 s and 5 min of pt, pd and md respectively. Pasteurised tigernut-soy milk is rich in nutritional quality.
Tigernut (Cyperus esculentus L.) belongs to the division–Magnoliophyta, class–Liliopsida, order–cyperales and family–Cyperaceae. It is a cosmopolitan, perennial crop of the same genus as the papyrus plant (Belewu and Belewu, 2007; Adejuyitan, 2011). The tubers which are about the size of peanuts are abundantly produced in Nigeria. It has other names such as ground almond, zulu nut, chufa, yellow nutgrass, edible rush and rush nut. In Nigeria, Yorubas call it Imumu, Hausas Aya, the Igbos Aki Hausa; whereas in the Southern part of Nigeria it is known as Ofio. Since early times (chiefly in West Africa and South Europe), tigernut has been cultivated for its small tuberous rhizomes which are used as hog feed, eaten raw or roasted, or pressed for its juice to produce a beverage (Osagie and Eka, 1998).
The nuts have excellent nutritional qualities with fat composition similar to olive oil, and are also rich in mineral content especially phosphorus and potassium but with low sodium content (Martinez, 2003). According to Oladele and Aina (2007), the crude protein content of the nuts ranged between 7.15 and 9.7%. Chuffa, as it is also called is cultivated in Nigeria primarily because of its rich vegetable milk which is an alternative to cow milk among the rural poor. It is used in the production of yoghurt and Kunnu (beverage) to quench thirst in Northern Nigeria (Sowonola et al., 2005). Tigernut tubers have also been used as alternative to cassava in baking industry (Bosch et al., 2005).
Soybean belongs to the family leguminous, subfamily papiliondase and the genus Glycine Max. The total area cultivated when Soybean (Glycine max) was first introduced in Nigeria in 1908 was 401,000 ha, while the current yield is about 1270 kg per hectare (Rehman et al., 2007). Soyabean not only provides quality macronutrients but also various other micronutrients, which are otherwise required to fight against malnutrition. It is rich in protein content and can furnish protein supply to bridge up the protein deficiency gap at low-cost than any other crop (Rehman et al., 2007).
Milk has been recognized as an important food for infants and growing children. In developing countries, the cost of dairy milk and their products is prohibitive and this has led to the development of alternative source of milk from plant materials. Tigernut milk (having Spanish name horchata) is a refreshing purely natural vegetable drink and or dessert, which is prepared with water, sugar and tigernuts. It is a very nutritive, energy drink both for young and old. Soymilk not only provides protein but is also a source of carbohydrate, lipid, vitamins and minerals (Chien and Snyder, 1983). It is an alternate of dairy animal milk due to the fact that it is less expensive despite it having high-quality protein. It has also been proved to be a healthy drink and is important especially for people who are allergic to cow milk protein and lactose (Rehman et al., 2007).
Tigernut-soy milk is a blended, processed commodity and is a source of quality energy, protein, minerals, and vitamins; combining the nutritional benefits of both.
Modern pasteurization is the application of adequate heat to a product for a period of time for the purpose of destroying pathogenic microorganisms, yet leaving the product acceptable from sensory and nutritional stand point (Lewis and Heppell, 2000).
In developing countries, the cost of milk and its products is prohibitive. This has led to dramatic decrease in the consumption of milk and milk products and stimulated in part the processing of milk from different seeds and nuts (Belewu and Belewu, 2007). High price of imported milk and milk products coupled with poor milk production in Nigeria and Africa in general seem to have made consumers more readily accept milk produced from plant sources.
Therefore, this study sought to evaluate the nutritive value of soy milk and tigernut milk as well as their combination in various proportions as affected by pasteurization, with a view to incorporating this into local milk production in Nigeria, taking into cognizance the importance of heat treating the milk at different temperatures.
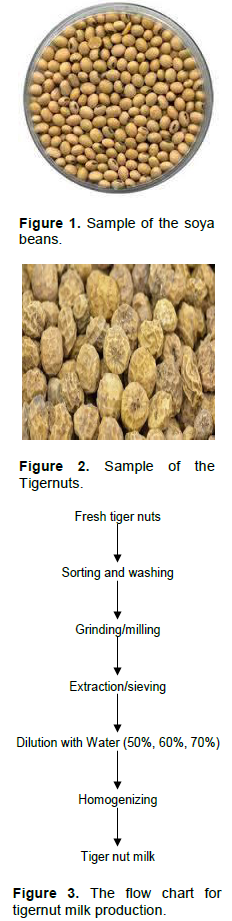
The soya beans and tigernuts used for this research work were purchased from Kure Market, Minna, Niger State, Nigeria. The samples of soya beans and tigernuts used for this experiment are shown in Figures 1 and 2 respectively.
Procedure for production of tigernut milk
Samples of dried tigernuts were purchased from the market and the bad nuts and other foreign materials were picked out. The tigernuts were then washed and soaked in water (6 L: 1 kg) for 18 h. Soaking of the tigernuts in water helps to soften it so as to blend with ease. The method of Belewu and Abodunrin (2006) was used. The soaked tigernuts were milled into slurry which was then pressed using muslin cloth to extract the milk and the milk extracted was divided into three parts and diluted to 50, 60 and 70% with water respectively. The flow chart for the production of tigernut milk is shown in Figure 3. The filtrate was stored in a plastic container for further processing.
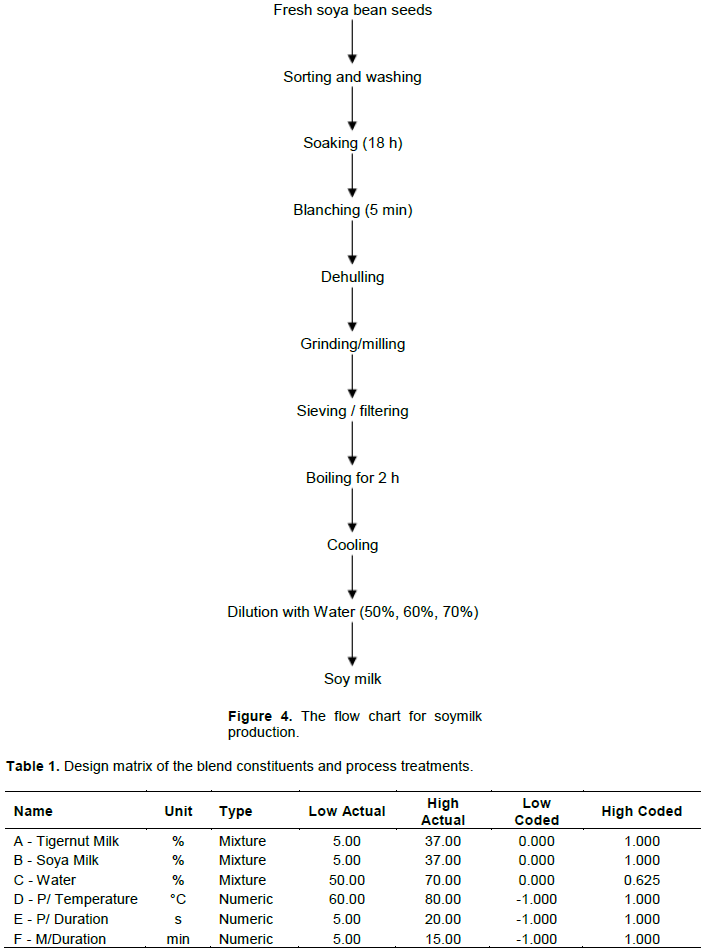
Procedure for production of soy milk
Five kilograms (5 kg) of soya beans was soaked for 18 h in 15 L of potable water to give a bean-water ratio of 1:3. The soaked beans was drained, rinsed with portable water and dehulled. Afterwards, the dehulled beans were milled. The resulting slurry was filtered through a muslin cloth and the extract (milk) obtained boiled for 2 h, after which it was divided into three parts and diluted with water to 50, 60 and 70% respectively. The flow chart for soymilk production is shown in Figure 4.
Procedure for preparation of tigernut-soy milk drink
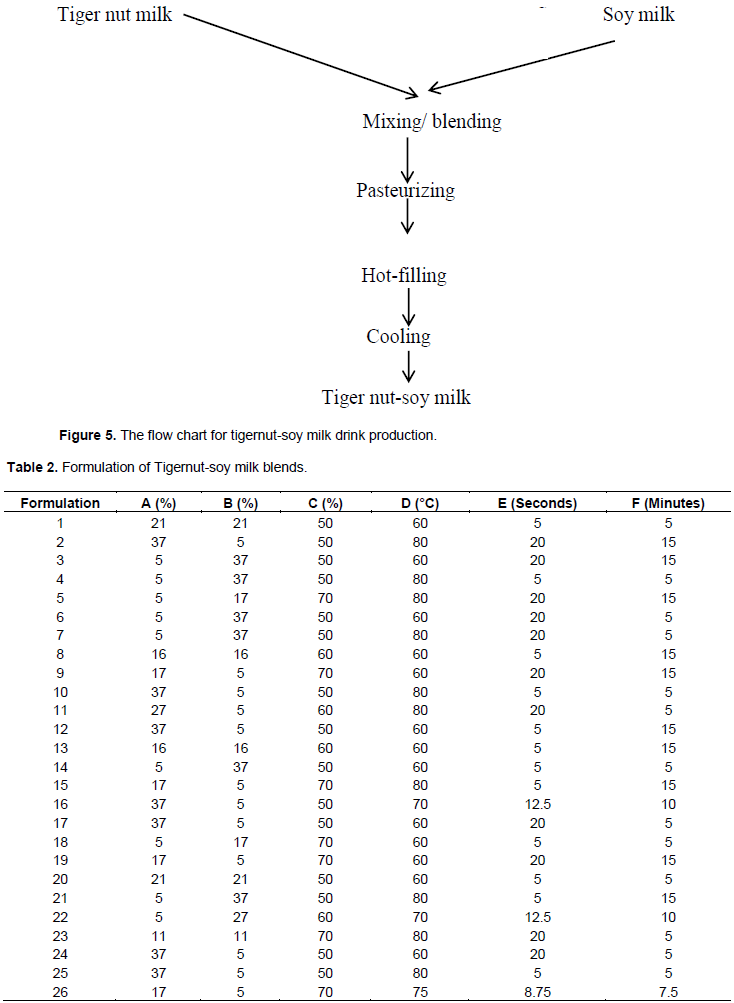
Tigernut milk and soya milk were combined in varying proportions to obtain the final products as shown in Table 1. This was done using a LEXUS food blender operated at speed level one (450 rpm) for the duration specified for the various samples. The resulting blends were packaged in plastic bottles and were then pasteurized at the indicated temperatures and durations as specified for each of the samples in Table 1 using a water bath (Supplementary Figure 1 and 2).
After heating, they were cooled immediately to room temperature (28 ±2°C). The flow chart for tigernut-soy milk drink production is shown in Figure 5.
Design of the experiment
Mixture - process design was used for the experimental design. The design matrix (Table 1) generated twenty-six experimental runs (Table 2). The mixture variables are tigernut milk, soy milk and water. The process parameters include pasteurization temperature, pasteurization duration and (constituent) mixing duration. While the responses were carbohydrate, protein, fat, moisture and ash.
Proximate analysis
The proximate composition of samples (carbohydrate, protein, fat, ash and moisture contents) was determined according to the method described by the Association of Official Analytical Chemists (AOAC, 2000).
Statistical analysis
All experiments were carried out in triplicates. Data obtained were analyzed statistically using Design Expert 9.0 statistical package.
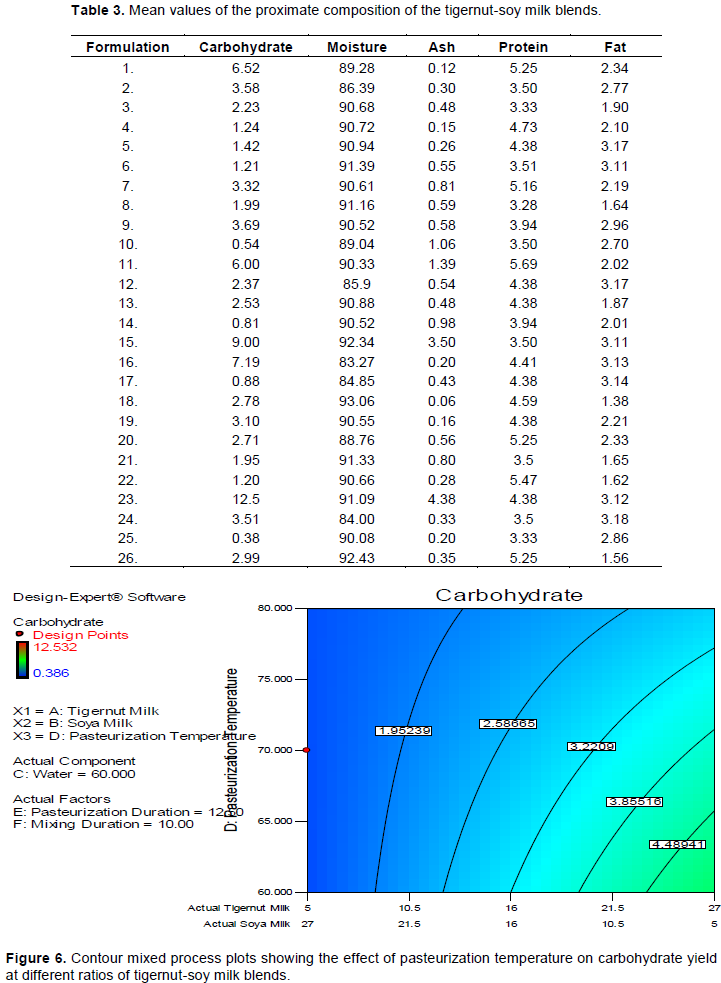
The twenty-six separate food formulations and their corresponding results for the proximate analysis are presented in Table 3.
Effect of pasteurization and other process parameters on the proximate composition of tigernut-soy milk blends
Carbohydrate
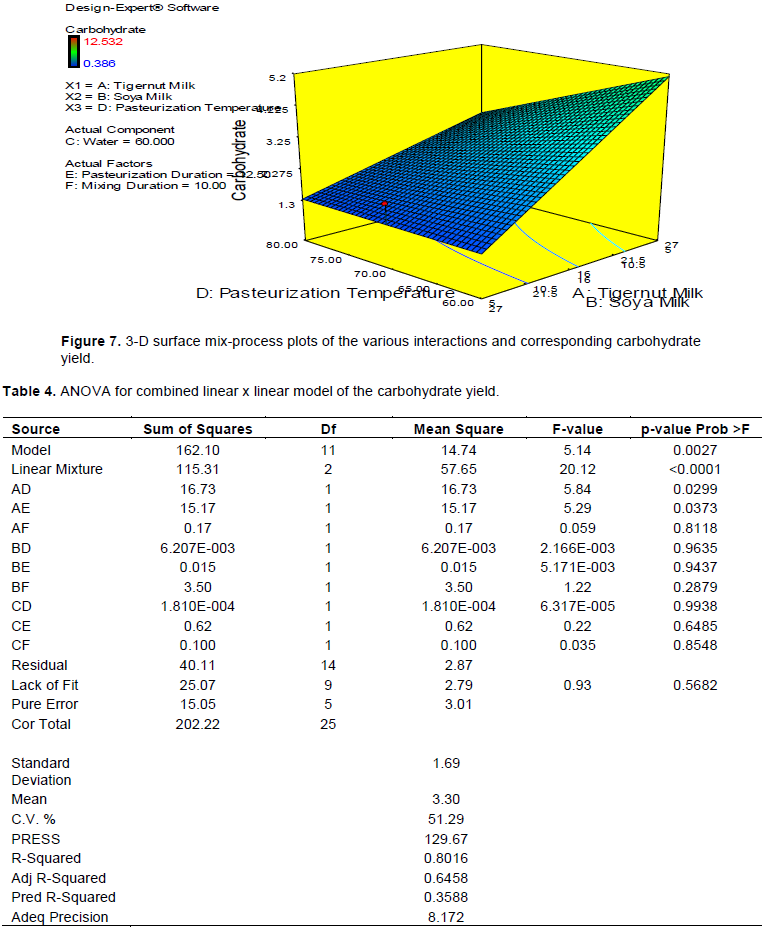
The carbohydrate content of the samples ranged from 0.38 to 12.53% as shown in Table 3. From Figure 6, it can be observed that the carbohydrate value increased with increasing tigernut milk and decreasing soy milk in the blends when water was kept constant. Thus, the higher the percentage of tigernut milk in tigernut-soy milk, the more the carbohydrate content of the blend (Figure 7). More importantly, Figures 6 and 7 show that carbohydrate content of the various formulations generally reduced with increase in pasteurization temperature.
The analysis of variance (ANOVA) for the response surface combined linear × linear model of the carbohydrate yield is shown in Table 4. The model expression developed, that relates the carbohydrate yield and the six reaction parameters (A, B, C, D, E and F) is considered suitable because its p-value is less than 0.05. The model F-value of 5.14 implies that the model is significant. The F-value is the ratio of the Model SS/Residual SS and shows the relative contribution of the model variance to the residual variance. A large number indicates more of the variance being explained by the model. The model fit was also checked with the correlation factor R2, which equals to 80.16%.
The significant factors from ANOVA analysis are the interactions between tigernut milk and pasteurization temprature (AD) with a p-value of 0.02 which is less than 0.05. Another significant factor is the interaction of tigernut milk and pasteurization duration with p-value of 0.03 (less than 0.05). The other factors of the model have no statistically significant effect.
In this study, the R2 value of 0.8016 indicates that the variation of 80.16% is attributed to the independent variables while 19.84% of the total variations is not explained by the model. The value of the coefficient of variation CV%, 51.29 gives the precision and reliability of the experiment carried out where a lower value of CV indicates a better precision and reliability of the experiments carried out. Table 5 shows regression coefficients estimates of carbohydrate.
The regression analysis from Table 5 produced the following coded equation:
The model equation (Equation 1) shows that all the positive coefficient terms such as A, B, AE, AF, BD, BE and BF indicate synergetic or favourable effect on the carbohydrate yield, while the negative coeffcients of the model terms such as C, AD, CD, CE and CF indicate antagonistic effect on the carbohydrate yield (Betiku et al., 2014).
The linear effect of A and B are the general determining factors of carbohydrate yield as they have the larger coefficients. The linear effect of C, interaction effect of AD and AE are secondary factors of the response. From this analysis, it can be seen that the tigernut milk concentration (factor A) has the highest coefficient among the three independent variables. This implies that the yield of carbohydrate from tigernut-soy milk blends relies greatly on this factor.
Protein
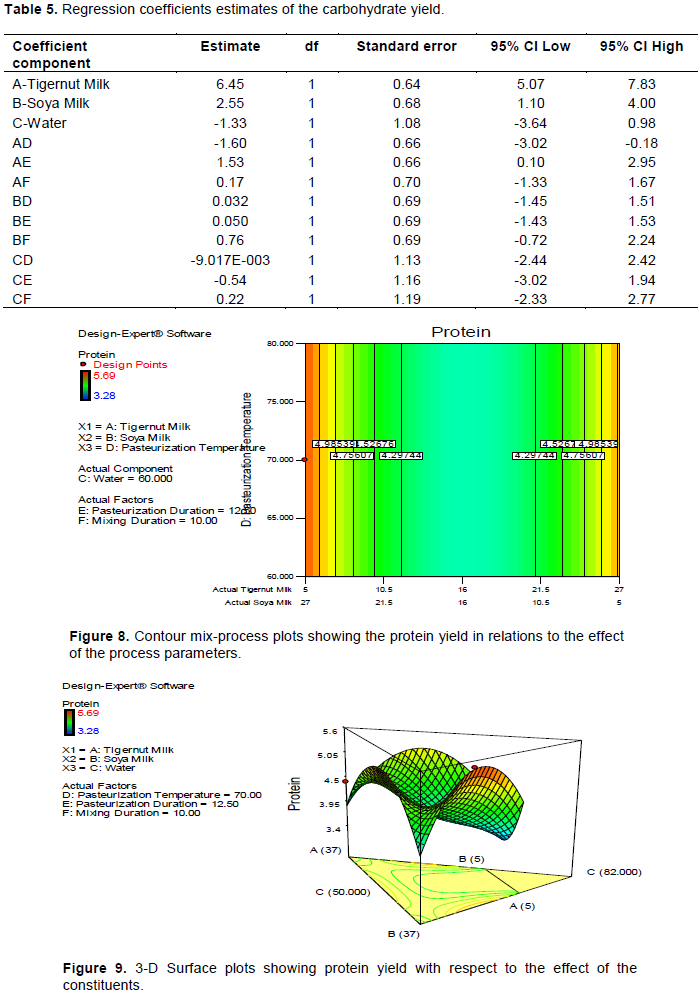
The protein content of the samples ranged from 3.28 to 5.89% (Table 3). There were fluctuations in the protein content of the tigernut-soy milk blends. The contour mix-process plot (Figure 8) gives a clear view of the protein yield in relations to the various process parameters, while the relationship between protein yield and the blend constituents is shown in Figure 9.
The fluctuation in the protein yield pattern may be attributed to the destructive effect of heat process involved in pasteurization on the amino acids as well as the tannin-protein complex which have contrast effects (Imafidon et al., 1997). Where amino acids are destroyed there is a consequent reduction in the total nitrogen which leads to decrease in the protein content of the resulting pasteurized milk (Oluwaniyi et al., 2009), whereas, a rise in the amount of protein may be credited to the destruction of tannin-protein complex (Belewu and Belewu, 2007).
Generally, the range of protein content of the various formulations after pasteurization shows there are no serious adverse effect on the protein content as a result of pasteurizing the milk.
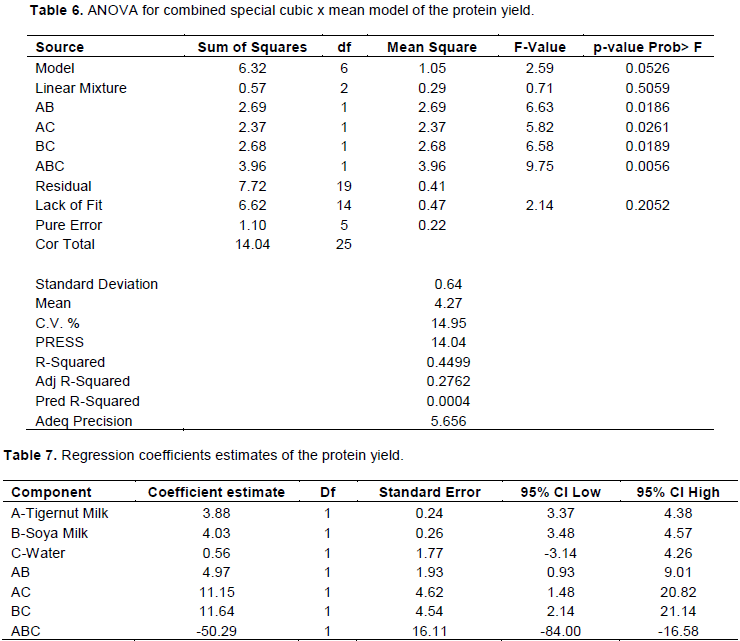
The analysis of the variance (ANOVA) for the response surface combined special cubic x mean model of the protein content of tigernut-soy milk bends is shown in Table 6. The model expression developed related the protein yield and the six reaction parameters considered (A, B, C, D, E, F); it has a p-value of 0.0526 greater than 0.05, which sugests there might be a more appropriate model for this experiment. The model F-value of 2.59 implies that the model is fairly significant. The model fit was also checked with the correlation factor R2, which equals 44.99%.
The significant factors from the ANOVA analysis were: the interactions between tigernut milk and soy milk (AB) with a p-value of 0.0186 which is less than 0.05; the interaction of tigernut milk and water (AC) with p-value of 0.0261<0.05; the interaction between soy milk and water (BC) with p-value of 0.0189<0.05 as well as the intractions among the three componets (tigernut milk, soy milk and water) (ABC) with a p-value of 0.0056 which is less than 0.05. The other factors of the model were not statistically significant.
The value of the determination coefficient R2 (0.4499) as shown in Table 6 indicates that the sample variation of 44.99% is attributed to independent variables and 55.01% of the total variations is not explained by the model. The value of the Coefficient of Variation (CV%) (14.95) gives the precision and reliability of the experiment carried out where a lower value of CV indicates a better precision and reliability of the experiments carried out. Table 7 shows regression coefficients of protein.
The regression analysis of the data on Table 7 produced the following coded equation:
The model equation (Equation 2) shows that all the positive coefficient terms such as A, B, AB, AC and BC indicate synergetic or favourable effect on the protein yield, while the negative coeffcient of the model terms ABC indicate an antagonistic effect on the protein yield (Betiku et al., 2014).
The interaction effect of ABC is the general determining factor of protein yield as it has the largest coefficient. The linear effect of A and B, interaction effect of AC and BC are secondary factors of the response.
Fat
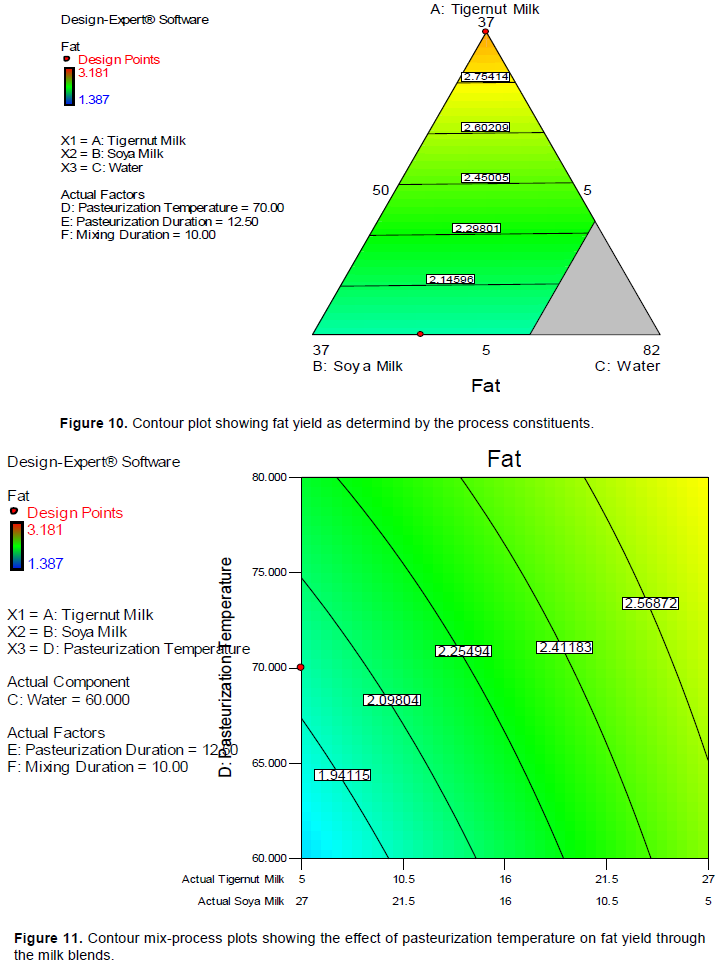
The fat content of the samples ranged from 1.38 to 3.18% (Table 3). The fat value increased with increasing tigernut milk and decreasing soy milk in the blends when water was kept constant (Figure 10).
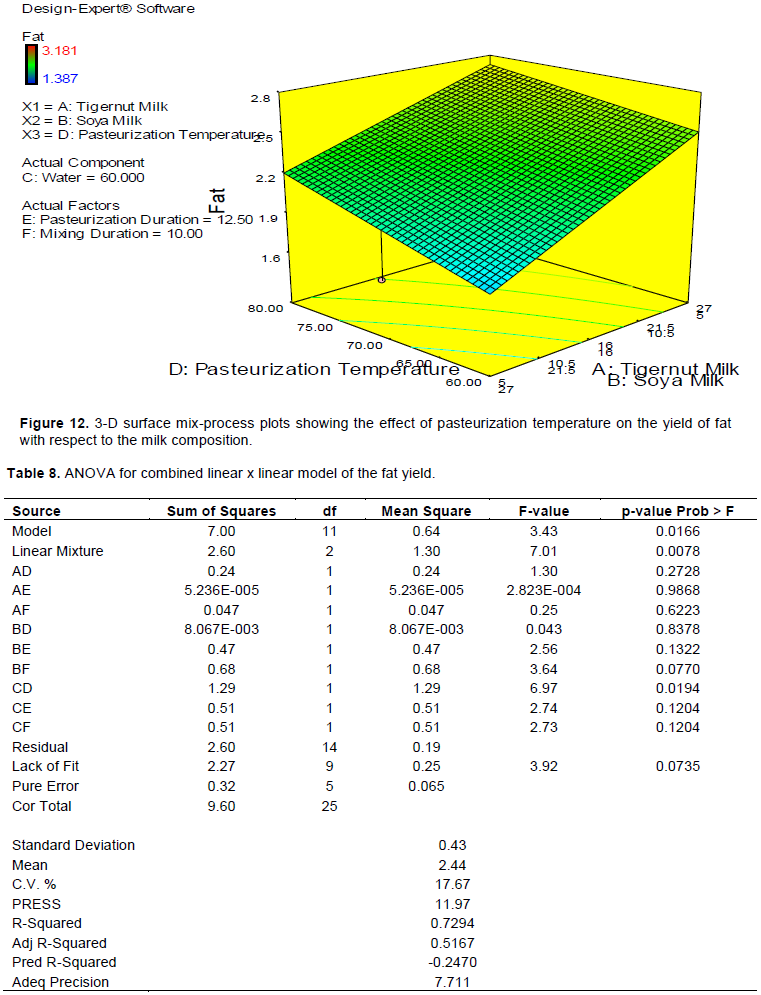
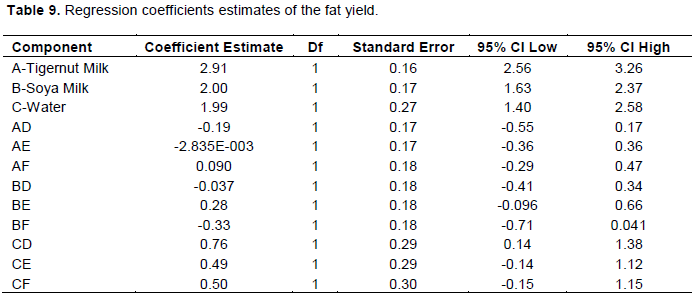
Thus, higher percentage of tigernut milk in tigernut-soy milk would increase the fat content more than having a larger portion of soy milk in the blend as seen in Figures 11 and 12. Furthermore, Figures 11 and 12 showed that fat content of the various formulations increased with increase in pasteurization temperature.
The analysis of variance (ANOVA) for the response surface combined linear x linear model of fat content of the blends is shown in Table 8. The model expression developed that relates the fat yield and the six reaction parameters (A, B, C, D, E, F) is considered suitable because its p-value of 0.0166 is less than 0.05. The model F-value of 3.43 implies the model is significant. The model fit was also checked with the correlation factor R2, which equals to 72.94%.
The only significant factor from the ANOVA analysis is the interaction between water and pasteurization temprature (CD) with a p-value of 0.0194 which is less than 0.05. The other factors of the model are not statistically significant.
The value of the determination coefficient R2, (0.7294) indicates that the sample variation of 72.94 % is attributed to independent variables and 27.06 % of the total variations is not explained by the model. The value of the Coefficient of Variation CV % (17.67) gives the precision and reliability of the experiment carried out where a lower value of CV % indicates a better precision and reliability of the experiments carried out. Table 9 shows regression coefficients of fat.
The regression analysis of data on Table 9 produced the following coded equation:
The model equation (Equation 3) shows that all the positive coefficient terms such as A, B, C, AF, BE, CD, CE and CF indicate synergetic or favourable effect on the fat yield, while the negative coeffcient of the model terms such as AD, AE, and BD indicate antagonistic effect on the fat yield (Betiku et al., 2014).
The linear effect of A and B are the general determining factors of fat yield as they have the larger coefficients. The linear effect of C and the interaction effect of CD are secondary factors of the response.
Furthermore, the tigernut milk concentration (factor A) had the highest coefficient among the three independent variables. This implies that the yield of fat from tigernut-soy milk blends relies greatly on this factor as may be clearly visualised in Figure 13.
Moisture content
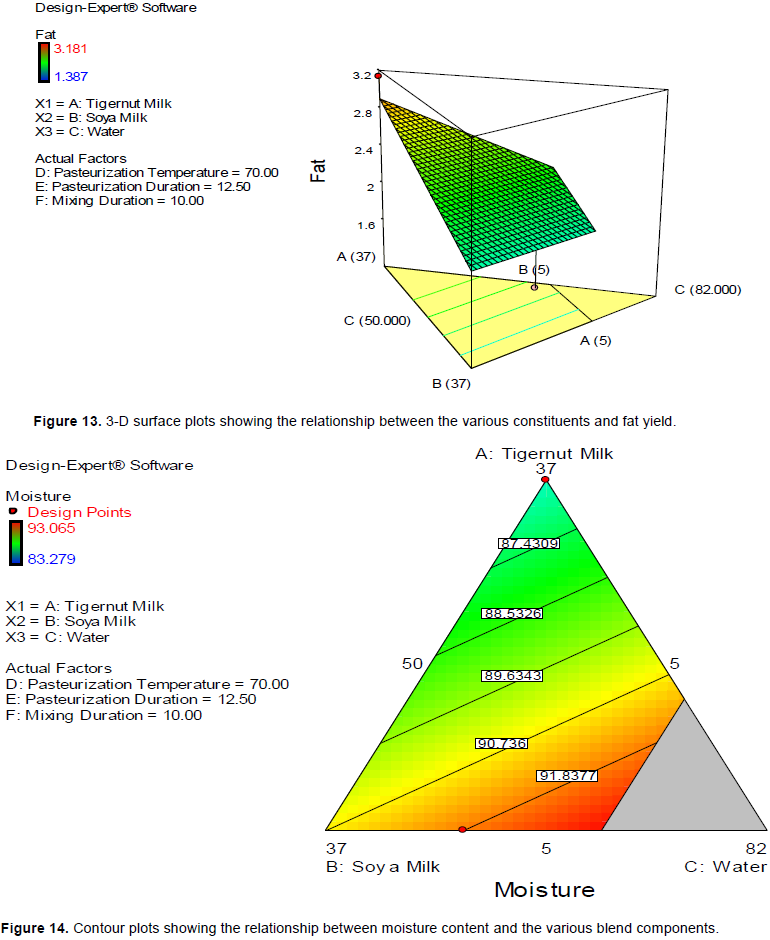
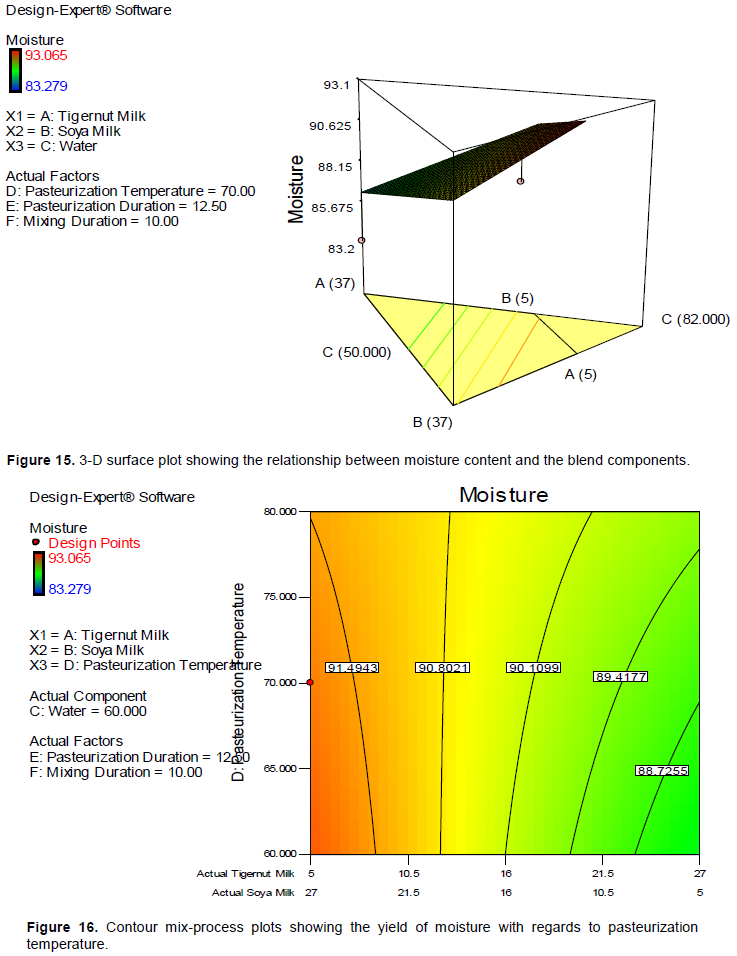
The moisture content value of the samples ranged from 83.27 to 93.06% (Table 3). This high range of moisture content reveals that the product is highly refreshing, hence a good source of healthy natural refreshment which should be preferred to chemical (synthetic) beverages. The moisture level increased with increasing soy milk and decreasing tigernut milk in the pasteurized blends when water was kept constant (Figure 14).
Figure 15 further buttresses the point. It shows that the higher the percentage of soy milk in tigernut-soy milk blend compared to tigernut milk, the greater the moisture content of the blend.
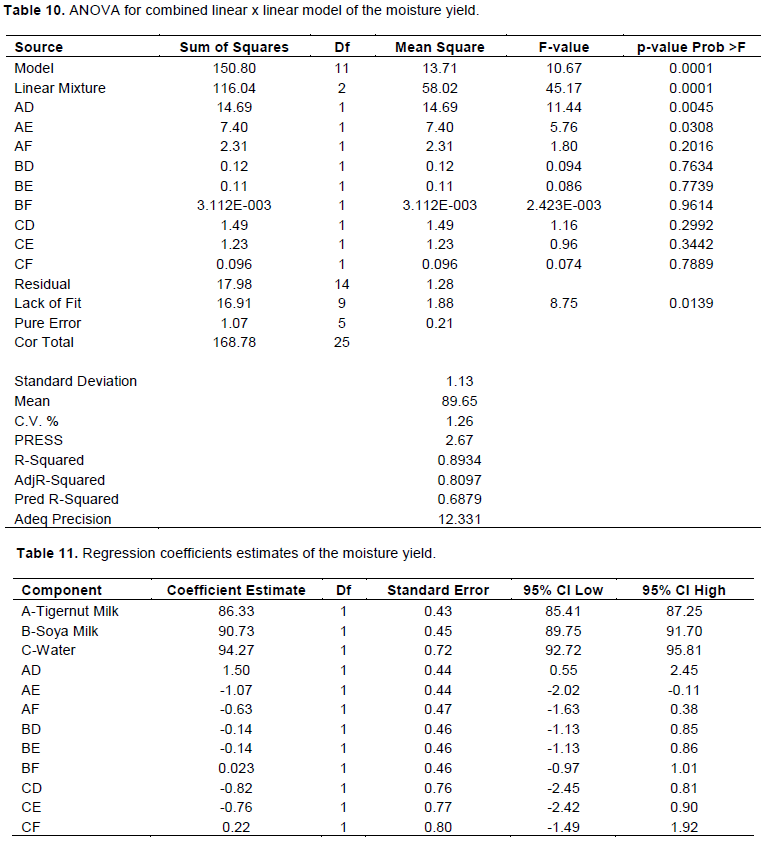
Furthermore, the range of moisture content of the various formulations after pasteurization shows that the moisture content generally increased with increase in pasteurization temperature (Figure 16).
The analysis of variance (ANOVA) for the response surface combined linear x linear model model of moisture content is shown in Table 10. The model expression developed that relates the moisture yield and the six reaction parameters (A, B, C, D, E, F) was considered suitable because the p-value of 0.0001 is far less than 0.05. The model F-value of 10.67 implies that the model is significant. The model fit was also checked with the correlation factor R2, which equals to 89.34%.
The significant factors from the ANOVA analysis are the interactions between tigernut milk and pasteurization
temperature (AD) with a p-value of 0.0045 which is less than 0.05 as well as the interaction of tigernut and pasteurization duration (AE) with p-value of 0.0308 which is also less than 0.05. The other factors of the model had no statistically significant effect.
Furthermore, the value of the determination coefficient, R2 (0.8934) indicates that the sample variation of 89.34% is attributed to independent variables and 10.66% of the total variations is not explained by the model. The value of the Coefficient of Variation, CV % (1.26) gives the precision and reliability of the experiment carried out where a lower value of CV % indicates a better precision and reliability of the experiments carried out. Table 11 shows the regression coefficients of moisture content.
The regression analysis from Table 11 produced the following coded equation:

The model equation (Equation 4) shows that all the positive coefficient terms such as A, B, C, AD, BF, and CF indicate synergetic or favourable effect on the moisture yield, while the negative coeffcient of the model terms such as AE, AF, BD, BE, CD and CE indicate antagonistic effect on the moisture yield (Betiku et al., 2014).
Ash content
The ash content, which is the approximate total mineral or inorganic matter of the samples ranged from 0.069 to 4.38% (Table 3).
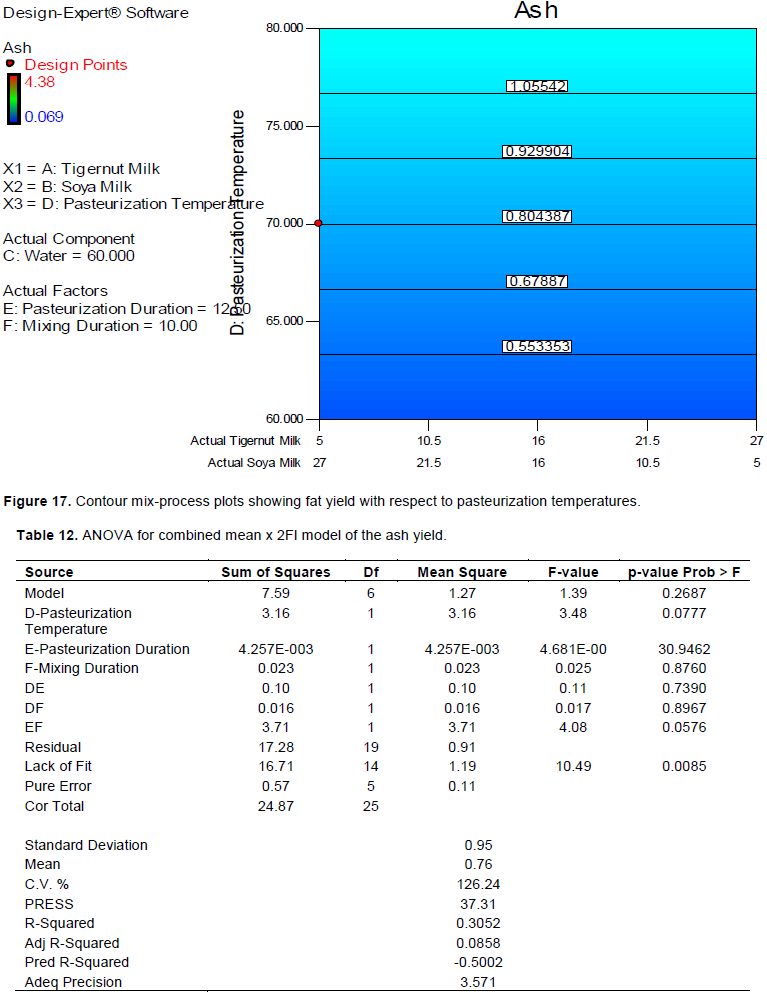
From the model graph (Figure 17, contour mix-process plot), it may be deduced that the ash content initially reduced drastically, then began to increase as the pasteurization temperature increased.
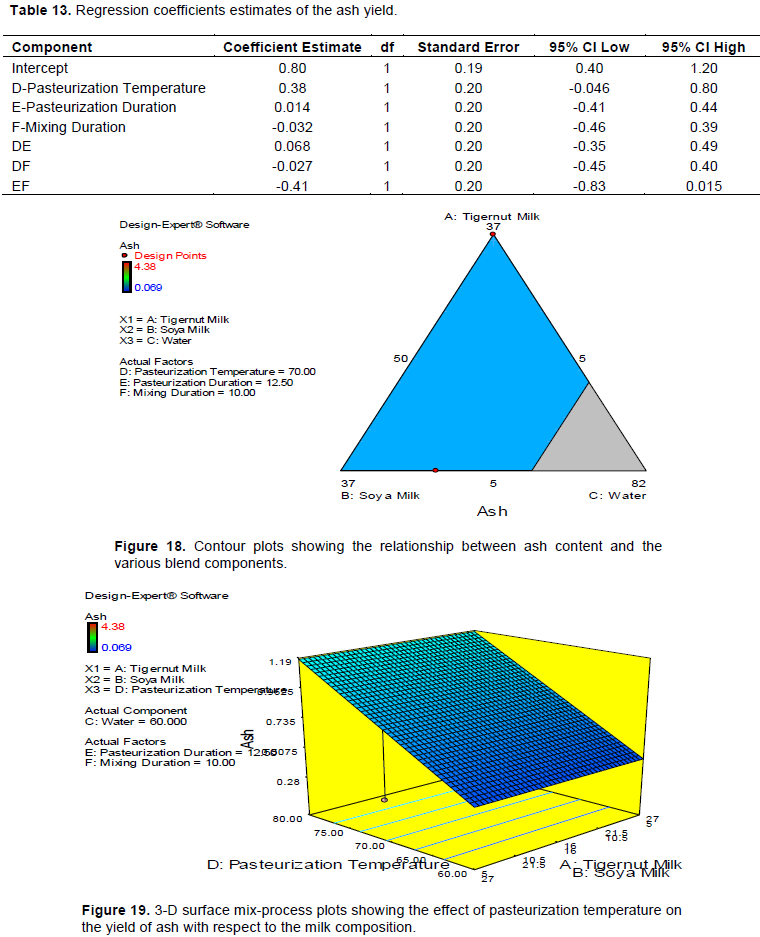
Statistically, Tables 12 and 13 as well as the contour plots (Figure 18) show that the various components of the blends had no influence whatsoever on whether the ash value increased or decreased.
The 3 D Surface Mix-Process Plot (Figure 19) also revealed clearly that the ash value remained unaltered by the various proportions of tigernut milk and soy milk in the tigernut-Soy milk blends, but it increased with increase in pasteurization temperature.
The analysis of the variance (ANOVA) for the response surface combined mean x 2FI model of the ash yield is shown in Table 12. The model expression developed that relates the ash yield and the six reaction parameters
considered (A, B, C, D, E, F) may not be considered suitable because its p-value of 0.2687 is greater than 0.05. The model F-value of 1.39 further implies that the model may not be suitable. The model fit was also checked with the correlation factor R2, which equals 30.52%.
It was also observed that all the factors had p-values greater than 0.05, thus they are not considered
significant. Therefore, it suffices to say that the entire factors of the model have no statistically significant effect.
The value of the determination coefficient, R2 (0.3052) indicates that the sample variation of 30.52% is attributed to independent variables and 69.48% of the total variations is not explained by the model. The value of the coefficient of variation, CV % (126.24) gives the precision and reliability of the experiment carried out where a lower value of CV% indicates a better precision and reliability of the experiments carried out.
The regression analysis from Table 13 produced the following coded equation: