African Journal of
Food Science

  • Abbreviation: Afr. J. Food Sci.
  • Language: English
  • ISSN: 1996-0794
  • DOI: 10.5897/AJFS
  • Start Year: 2007
  • Published Articles: 978

Full Length Research Paper

Proximate and phytochemical composition of selected indigenous leafy vegetables consumed in Malawi

Lesten Eliez Chisomo Chatepa
  • Lesten Eliez Chisomo Chatepa
  • Basic Science Department, Faculty of Agriculture, Lilongwe University of Agriculture and Natural Resources, Bunda Campus, P. O. Box 219, Lilongwe, Malawi.
  • Google Scholar
Kingsley George Masamba
  • Kingsley George Masamba
  • Food Science and Technology Department, Faculty of Food and Human Sciences, Lilongwe University of Agriculture and Natural Resources, Bunda Campus, P. O. Box 219, Lilongwe, Malawi.
  • Google Scholar


  •  Received: 09 June 2020
  •  Accepted: 22 July 2020
  •  Published: 31 October 2020

 ABSTRACT

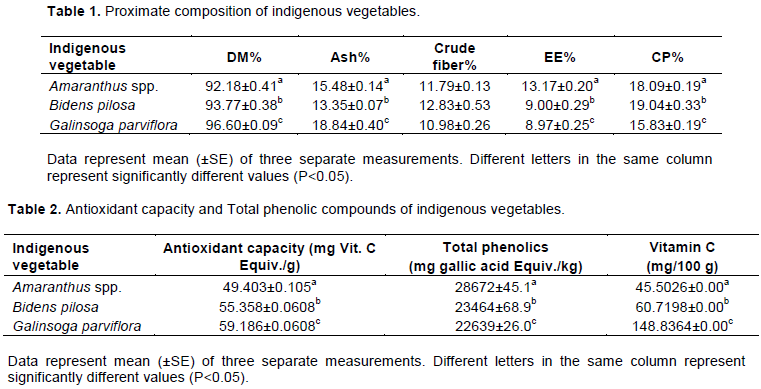
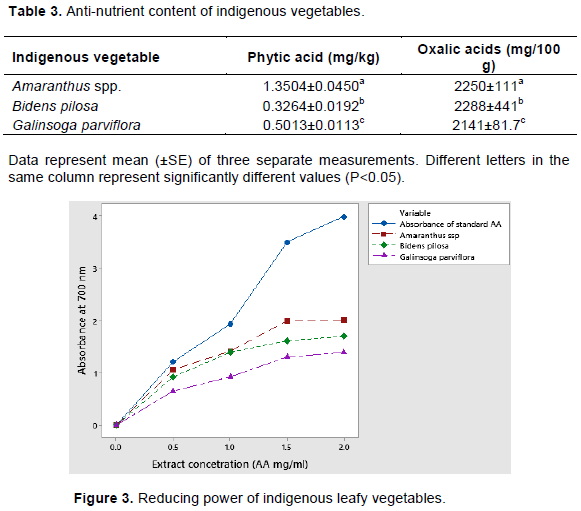
Indigenous vegetables are very important in nutritional wellbeing of low resource rural communities especially in developing countries. Most indigenous vegetables are also believed to contain health promoting compounds such as antioxidants. In this study, nutrient composition of three commonly consumed indigenous leafy vegetables in Malawi namely Amaranth (Amaranthus species), Black jack (Bidens pilosa) and Mwamuna aligone/gallant soldier (Galinsoga parviflora) was determined. Results showed that crude protein expressed on dry weight basis ranged from 15.83±0.19 to 19.04±0.33 with B. pilosa registering the highest value and G. parviflora the lowest. Results on mineral content showed that G. parviflora had the highest (18.84±0.40% DW) p<0.05 mineral/ash content compared to B. pilosa (13.35±0.07% DW) and Amaranthus spp. (15.48±0.14%). Amaranthus spp. had the highest crude fat (13.17±0.20%) content compared to B. pilosa and G. parviflora which had 9.00±0.29 and 8.97±0.25%, respectively. Antioxidant capacity in mg vitamin C Equiv./g DW, ranged from 49.403±0.105 to 59.186±0.0608 with G. parviflora registering the highest value compared to the other two indigenous vegetables. Total phenolic content ranged from 22639±26.0 to 28672±45.1 mg GAE/kg with Amaranthus spp. registering the highest value and G. parviflora the lowest. Results on anti-nutrient content with respect to phytic and oxalic acids showed that all the three indigenous vegetables contained low and safe levels of antinutrients. The study results have demonstrated the significance of these indigenous vegetables in human nutrition and health for rural people in Malawi.


Key words: Indigenous vegetables, proximate composition, total phenolic compounds, antioxidant capacity, phytochemicals.


 INTRODUCTION

Indigenous vegetables have a very significant role in the livelihood of rural people in emerging worlds (Zemede and  Mesfin,   2001;  Uusiku  et  al., 2010). In  developing worlds, many people in rural areas have less food for their families resulting in deficiency of important nutrients (Tanumihardjo and Yang, 2005; FAO et al., 2012). These rural poverty stricken people depend on locally available indigenous vegetables for income and food, as staple food, during lean seasons (Zemede and Mesfin, 2001; Ebert, 2014; Tomori and Obijole, 2000; Flyman and Afolayan, 2006). Therefore, indigenous leafy vegetables are valuable sources of both nutrients, as micronutrients (Nesamvuni et al., 2001) and herbal medicines (Hilou et al., 2006). In Africa, Malawi inclusive, indigenous leafy vegetables are used as relish and are eaten together with starchy staple foods (Schippers, 2000).
 
Indigenous leafy vegetables play important role in being protective foods; used in human health maintenance and disease prevention (Sheela et al., 2004; Nnamani et al., 2007). Plants produce organic compounds that are not directly used in primary growth and development metabolic processes of plants (Buchanan et al., 2000). These compounds are non nutritive plant secondary metabolites that are also called phytochemicals (Krishnaiah et al., 2007). These phytochemicals are antioxidant bioactive chemicals that prevent oxidative processes occurrences in animals and plants (Baang et al., 2015). These essential phytochemicals include saponins, alkaloids, flavonoids, tannins and phenolic compounds (Baang et al., 2015), fibres, vitamins and water (Adenipenkun and Oyetunji, 2010; Saidu and Jideobi, 2009; Uwah and Ogugbuaja, 2012).  They are absorbed by the human body to be utilized as energy sources, body building and protective materials (Saidu and Jideobi, 2009; Uwah and Ogugbuaja, 2012). They have high fiber content compared to root vegetables and cereals (Saidu and Jideobi, 2009). The high fiber content has been reported to reduce cholesterol levels in the body resulting in low occurrences of cardiovascular diseases (Chionyedua et al., 2009). Potassium from leafy vegetables is responsible for preventing body diuretic and hypertensive complications (George, 2003) while oils/fats from vegetables lower blood lipids thereby controlling incidences of coronary diseases (Adenipenkun and Oyetunji, 2010).
 
However, the presence of some phytochemicals that are called anti-nutritional factors like phytate, oxalate, trypsin inhibitors and lectins threatens the bioavailability of plant micronutrients to human beings (Shi et al., 2003). Other authors have previously reported that oxalate complexes with calcium forming calcium oxalate crystals resulting in both non-absorption and utilization of calcium by the body and renal stones (Ladeji et al., 2004; Akwawo et al., 2000). The non-absorption and utilization of calcium has been reported to cause rickets and osteomalacia (Ladeji et al., 2004). Phytic acid (PA; myo-inositol hexaphosphate), a ubiquitous biomolecule is found in plants and PA phosphorus is a major fraction of total phosphorus in seeds and grains (Harland and Overleas, 1987). Phytic acids form insoluble complexes with polycations/micronutrients like Fe, Ca, Zn and P because   of   reactive   phosphorus   groups   which   are attached to its inositol (Pedersen et al., 2007) resulting in unavailability of the nutrient for human intestinal absorption (Mahesh et al., 2015). Despite being an anti-nutritional factor, phytate consumption has been associated with some health benefits like prevention against dental and renal caculi, rectal cancer, cardiovascular calcification and as an antioxidant (Shamsuddin, 2002; Grases et al., 2007, 2009).
 
In Malawi, Amaranths (Amaranthus L.), Black jack (Bidens pilosa) and Mwamuna aligone/gallant soldier (Galinsoga parviflora) are some of the commonly consumed indigenous leafy vegetables. Amaranthus L. belongs to the Amaranthaceae family and there are 60 recognizable species (Anjali et al., 2013). Findings from studies conducted on indigenous vegetables revealed that Amaranthus spp. vegetables have high antioxidant properties, with phenolic values of 275±20 mg GAE/100 g (Baang et al., 2015). This is despite having low proximate composition on fresh basis (Matenge et al., 2017). In addition, other researchers have reported that Amaranthus spp. contains crude protein and fat contents of 3.2 and 0.3%, respectively at 7% DM content (Sheela et al., 2004). The leaves are boiled and in some cases groundnut flour is added and is usually consumed as relish.
 
B. pilosa and G. parviflora belong to Asteraceae family (Essack, 2018). B. pilosa is a small erect weedy plant that grows in tropical countries and is used as a source of food (Grubben and Denton, 2004). It is rich in phytochemicals like phenols, flavonoids, terpenes, phenylpropanoids and lipids (Chang et al., 2001). In Africa, dry powdered leaves of B. pilosa are used to cure syphilis and in East Africa the leaves are used in the treatment of conjunctivitis and constipation in babies (Hutchings et al., 1996). Other authors have previously reported that B. pilosa contains 5% crude protein, 10 mg/100 g copper and 658 mg/100 g magnesium (Odhav et al., 2007). G. parviflora has 13 species and originated from the mountains of Central America (Warwick and Sweet, 1983). It  has been reported to contain 5.0 g protein and 0.5 g fat on fresh basis per 100 g of the consumed vegetable  (Odhav et al., 2007). Similarly, others have reported that G. parviflora leaves contain high amounts of magnesium (681 mg/100 g) on fresh matter basis (Odhav et al., 2007). They are cooked as spinach and eaten as relish (Tredgold, 1990).
 
It is widely acknowledged that indigenous leafy vegetables have been underutilized with limited knowledge on their nutritional values (Keatinge, 2012). In Malawi, it has been observed that very few studies have been done on nutritional values of indigenous leafy vegetables (Chitsulo, 2013; Kachiguma et al., 2015) resulting in either limited or scanty information. Against the background of this limited information on nutritional composition of indigenous vegetables, this current study was undertaken to determine the nutritive value of these three  selected   indigenous  leafy   vegetables,   namely, Amaranthus spp., B. pilosa and G. parviflora, consumed in Malawi.


 MATERIALS AND METHODS

Plant sample collection
 
Three fresh indigenous leafy vegetables: Amaranthus spp., B. pilosa and G. parviflora were collected from naturally growing plants in the fields in Lilongwe south west, Mitundu area, which is located in Lilongwe district, Malawi. The vegetables were sampled during the rainy season in the month of January 2020. These vegetables represent some of the indigenous leafy vegetables that are mainly consumed by rural people in Malawi.
 
Sample preparation
 
Enough samples were thoroughly washed with water to remove dirt and other contaminants and were later oven dried at 40°C for proximate and phytochemicals composition determination. The dried leafy vegetable samples were ground through a 1 mm sieve using a Thomas-WILEY model 4 Laboratory Mill before analyzing the chemical properties.
 
Determination of nutritional composition
 
The nutritional/proximate composition of the samples was determined using Association of Official Analytical Chemists (AOAC) 1990 methods.
 
Dry matter content determination
 
The dry matter content was determined by using the oven-dry method. 2.5 g of the samples was weighed into a porcelain dish and dried at 105°C for 5 h in the drying oven. After drying, the samples were cooled in a desiccator and weighed to constant weight. The dry matter content was expressed as a fraction of dry weight and presented as a percentage.
 
Ash content determination
 
2.5 g of the ground samples was weighed in porcelain dish with a known weight. The samples in the porcelain dishes were ignited in a muffle furnace at 500°C for 2 h to obtain a grey ash. The samples were cooled in a desiccator and weighed to constant weight. The ash content was expressed as a fraction of the sample on dry matter basis and expressed as a percentage.
 
Protein content determination
 
Crude protein was determined by using Kjeldahl method. 2.5 g of the sample was digested in 20 ml concentrated sulphuric acid using selenium tablet as a catalyst until the mixture turned colorless/clear. The mixture was then diluted to 250 ml in a volumetric flask and 10 ml of the mixture was mixed with 20 ml of 40% NaOH. The mixture was distilled to liberate ammonia into weak (4%) boric acid and the distillate was titrated against standard HCl using bromocresol green as an indicator. The calculated nitrogen content from the samples in percent was converted to crude protein by multiplying by a factor of 6.25.
 
Crude fat determination
 
Crude fat was extracted from the sample by using petroleum ether in a soxhlet extractor/apparatus for 16 h. 2.5 g of finely ground sample was put into a porous thimble in a soxhlet apparatus connected to a weighed 250 ml flat bottomed quick fit flask containing 200 ml petroleum ether. The solvent was continuously boiled at 40 to 60°C extracting the fat from the sample. After 16 h of extraction the petroleum ether was evaporated by using a rotary evaporator. The flask containing the crude oil was then dried to constant weight at 105°C in the laboratory oven for 2 h. The crude oil was calculated as the fraction of original dry weight of the sample expressed in percentage.
 
Crude fibre determination
 
2.0 g of the sample was boiled in 150 ml of 0.128 M H2SO4 in a beaker for 30 min and the residues were filtered through fluted funnel and was washed three times with hot distilled water. The residues were further boiled in 0.125 M NaOH for another 30 min, filtered and washed with hot distilled water, followed by washing three times with acetone. The residues were oven dried at 105°C to constant weight and then ashed at 500°C for 2 h. The ash was weighed and fibre content was expressed as a fraction of the difference between the weight of the residues and ash of dry weight sample and this was expressed as a percentage.
 
Determination of phytochemicals
 
Extraction of phenolic compounds
 
Phenolic compounds were extracted from 2.5 g of the samples by using 25 ml of methanol (80:20 v/v) and pure distilled water. The mixtures were homogenized using a vortex for 30 s at 30 min intervals for 1 h. The mixture was then filtered and concentrated using a rotary evaporator at 40 to 50°C (SatyaEswari et al., 2018).   
 
Determination of total phenolic compounds
 
The total phenolic compounds were determined spectrophotometrically by using Folin-Ciocalteau reagent method (Singleton and Rossi, 1965). 1.0 ml of the plant extract was mixed with 0.5 ml of Folin-Ciocalteau (1:10 v/v) in a test tube. The mixture was left to stand for 5 min, 1.5 ml of 20% NaCO2 was added and the volume was made up to10 ml with distilled water. A standard stock solution of 1 mg/ml gallic acid was prepared. A standard curve was plotted as reference gallic acid equivalent (GAE) (0-0.4 mg/ml) after similarly treated as the samples. The absorbance of standards and samples was measured at 765 nm using a spectrophotometer. The phenolic compound was determined by the Folin-Ciocalteau method expressed as gallic acid equivalent per 1000 gram (mg GAE/kg). The TPC was calculated using the standard curve of gallic acid equation (y=1.28x; R2=0.9233) as shown in Figure 1.
 
Determination of phytic acids
 
Phytic acid was determined by Davis and Reld method as modified by Abulude (2007). 2.5 g of dried sample was soaked in 100 ml of 2% HCl in 250 ml conical flask for 3 h. The mixture was filtered through Whatman filter paper and 25 ml of the filtrate was mixed with 107 ml of distilled water, 10 ml of 3% ammonium thiocyanate (NHSCH) was added and the solution was titrated against standard FeCl3  containing  0.00195 g  Fe/ml  to  brownish-yellow   color  that persisted for 5 min. The phytate content of the samples was calculated as follows:
 
Phytate phosphorus = iron equivalent × 1.95 g of titre
Phytate = phytate phosphorus × 3.65 g
 
Oxalate determination
 
Oxalate composition in the leafy vegetables was determined by Day and Underwood (1986) method with minor modifications. 2.5 g of the samples was mixed with 75 ml of 3 M H2SO4 and was stirred for 1 h with a magnetic stirrer. The mixture was filtered and 25 ml of the filtrate was titrated while hot against 0.05 M KMnO4 solution to a faint pink color that persisted for 30 s. The oxalate composition was calculated by assuming that 1 ml of 0.05 M KMnO4 is equivalent to 2.2 mg oxalate (Chinma and Igyor, 2007; Ihekoronye and Ngoddy, 1985).
 
Determination of vitamin C
 
Vitamin C was determined by using methods as prescribed in Food Analysis Laboratory manual (Zvaigzne et al., 2009) and AOC methods (1995) with minor modifications. 5 g of fresh samples was ground using mortar and pestle, 20 ml of oxalic and trichloroacetic acid was added. The mixture was further mixed, filtered through a cotton wool in 100 ml volumetric flask and made up to volume with oxalic acid. 10 ml of the sample extract was pipetted  into  a  250 ml conical flask and titrated against 2, 6 phenolindolindol dichlorophenol dye to a persistent rosy pink color. Similarly, 10 ml of 1 mg/ml standard ascorbic acid was titrated against phenolindol indophenol dye.
 
Determination of total anti-oxidant capacity
 
The total antioxidant capacity in leafy vegetables was determined by phosphomolybdenum method (Prieto et al., 1999). 0.5 ml of methanol, water and ethanol extract (1 mg/ml) were mixed with 1 ml of 0.6 M H2SO4, 28 mM Na4 (PO4)2 and 4 mM ammonium molybdate solution in a test tube and incubated in a water bath at 95°C for 90 min. After cooling, the volume was made up to 10 ml with distilled water and absorbance was measured at 695 nm against a blank. Standards (0-0.05 mg/ml) were prepared, treated similarly as the samples and a calibration curve was plotted. Total antioxidant capacity of the leafy vegetables was calculated using the standard curve of ascorbic acid equation (y=5.2971+0.0003; R2=0.9117) as shown in Figure 2, expressed as ascorbic acid equivalent (AAE) in mg/g of the dry sample.
 
 
Determination of reducing power
 
The reducing power of the leafy vegetables was determined using Chu et al. (2000) method with minor modifications. The reducing power was investigated by observing the formation of Fe3+ from F2+. The color of  the  test  solution  changed  to  various  colors such as green and blue with reference to the reducing power of test solutions. The sample antioxidants reduces Fe3+/ferricyanide complex to Fe2+ and is evaluated by measuring the formation of Perl’s Prussian blue at 700 nm (Yang et al., 2010).
 
The methanolic extracts were diluted in the range of 0.5 to 2.0 mg/ml using distilled water. 2.5 ml of the diluted extracts was mixed with 2.5 ml of pH 6.6 phosphate buffer, 1% w/v potassium ferricyanide in test tubes and were incubated in a water bath at 50°C for 30 min. After cooling, 2.5 ml of 10% trichloroacetic acid was added and centrifuged for 10 min at 13,000 rpm. 2.5 ml of the supernatant was diluted with 2.5 ml of distilled water and freshly prepared 0.5 ml of 1% ferric chloride solution was added, mixed thoroughly and absorbance of the mixture was measured at 700 nm after 10 min of incubation.
 
Statistical analysis
 
Laboratory chemical analyses were done in triplicate and the mean value of each chemical parameter was calculated using Microsoft excel. The data was statistically analyzed by using analysis of variance (ANOVA) in Microsoft Excel ToolPak. Two sample T-test with unequal variances was used to compare mean values and significance was accepted at P≤0.05 level.


 RESULTS AND DISCUSSION

Proximate composition
 
Results on the proximate composition of the three selected indigenous leafy vegetables are presented in Table 1. Crude protein composition ranged from 15.83±0.19 to 19.04±0.33% with the dry matter content ranging from 96.60±0.09 to 93.77±0.38%. The crude protein content in B. pilosa (19.04±0.33%) was higher compared to the other two indigenous vegetables which were 18.09±0.19 and 15.83±0.19%, respectively for Amaranthus spp. and G. parviflora. The crude protein content in Amaranthus subsp. has previously been reported to be 5.60±0.01% at 84.1±0.05% moisture content (Matenge et al., 2017) which translates to 35.22±0.63% crude protein at 92.18±0.41% DM. A study conducted in Zimbabwe found out that crude protein content for Amaranthus spp. and B. pilosa were 4.94±0.46 and 4.40±0.78% on fresh weight basis, respectively (Muchuweti et al., 2011).  The mineral composition as ash content of 15.48±0.14% for Amaranthus spp., was comparably similar to the value of 16.43±0.88% reported in a related study in Malawi (Kachiguma et al., 2015). Amaranthus spp.  (dubius)  has been reported to contain high values of protein (31.13±0.54%), fat (47.20±0.40%) but lower ash (12.24±0.67%) values than the values obtained in a study conducted by other researchers (Mih et al., 2017). In a study conducted in Nigeria, Amaranth spp. leaves had lower crude fat value of 2.20±0.58% (Funke, 2011) than 13.17±0.20% from this study. Odhav et al. (2007) reported that G. parviflora contains 34.91% crude protein on dry matter basis almost twice more than 15.83±0.19 obtained in this study. However, crude fat was 4.36% on dry matter basis almost twice less than 8.97±0.25 from this study (Odhav et al. 2007).  On fresh matter basis, B. pilosa has previously been reported by other authors to contain 19.18±0.06% crude protein which is slightly higher compared to the value of 19.04±0.33 obtained in this study (Adedapo et al., 2011).  However,  when comparison was made based on  crude fat content for the same authors, it was observed that the crude fat content obtained in this study (9.00±0.29) was higher compared to their results (6.0±1.0%). These differences when compared with our findings might have been attributed to various factors such as geographical locations.
 
Total antioxidant capacity of the indigenous leafy vegetables
 
Results on total antioxidant capacity of the leafy vegetables are presented in Table 2. Total antioxidant capacity of the 80% methanolic extracts of the vegetables, in mg AAE/g, ranged from 49.403±0.105 to 59.186±0.0608 for Amaranthus subsp. and G. parviflora, respectively. G. parviflora registered the highest (p<0.05) total antioxidant capacity compared to B. pilosa (55.358±0.0608) and Amaranthus subsp., respectively. Antioxidants are free radical scavengers that either prevent or repair damaged cells by reactive oxygen species (ROS) in human bodies culminating in increased immune defense system and therefore lowering risk of cancer and degenerative diseases (Pham-Huy et al., 2008). The higher values in total antioxidant capacity signify the importance of these indigenous leafy vegetables both for food and medicinal purposes.
 
Total phenolic compounds content
 
Results  on  total   phenolic   compounds   (TPC)   of   the indigenous vegetables are presented in Table 2. Total phenolic compounds of the 80% methanolic extracts for the three vegetables ranged from 22639±26.0 to 28672±45.1 for G. parviflora and Amaranthus spp., respectively. Amaranthus spp. had the highest (p<0.05) TPC compared to B. pilosa (23464±68.9) and G. parviflora (22639±26.0) leaves. The TPC value for B. pilosa obtained in this study was comparably lower to the values of 27080±2900 (Adedapo et al., 2011) and 51100±5560 mg/kg (Chipurura, 2010) for samples obtained in South Africa and Zimbabwe, respectively. However, G. parviflora TPC value obtained from this study was comparably similar to the value of 20000±5000 mg/kg from a related study conducted in Zimbabwe (Chipurura, 2010). The TPC values obtained  in this study for Amaranthus spp. was lower as compared to the value of  40400±0.11 mg/kg DW reported by other authors (Matenge et al., 2017) but comparable to the values (2750±200 mg/kg DW) for Amaranthus triclor for studies conducted in Botswana and Philippines (Baang et al., 2015).
 
 
The findings from this study have revealed that the three indigenous vegetables contains high vitamin C content ranging from 45.5026±0.00 to 148.8364±0.00 mg/100 g with G. parviflora registering the highest (p≤0.05) value and Amaranthus spp. the lowest (p≤0.05) value, respectively. Vitamin C values for Amaranthus spp. and B. pilosa obtained in this study were lower compared to the values of 64±6 and 70±7 mg/100 g (Muchuweti et al., 2011), respectively reported in a similar study conducted in Zimbabwe.
 
Total phenolic compounds in plants include phenolic acids, polyphenols and flavonoids which are used as antioxidants in plants protecting them from oxidative damage. Therefore, consumption of phenolic compounds from vegetables, as antioxidants, has medicinal value to humans (Do et al., 2014).
 
Phytochemical content of the indigenous leafy vegetables
 
Phytic acid composition
 
Results on phytic acid composition of the three indigenous vegetables are presented  in  Table  3.  Phytic acid is a hexaphosphate of inistol that chelate calcium and iron making them biologically unavailable to humans (Gupta et al., 2005). Phytic acid consumption of 4 to 9 mg/100 g results in a decrease in iron absorption of 4-5 fold in humans (Unuofin et al., 2017; Hurrel et al., 1992). It has previously been reported that the general daily phytic acid intake to be 4000 mg (Reddy, 2002) and for rural people in emerging world it is supposed to be 150 to 4000 mg (Reddy et al., 1982). The phytic acid concentration ranged from 0.3264±0.0192 to 1.3504±0.0450 mg/kg for Amaranthus spp. and B. pilosa, respectively. Amaranthus spp. had the highest (p<0.05) concentration of phytic acid compared to G. parviflora (0.5013±0.0113) and B. pilosa (0.3264±0.0192). The phytic acid content for Amaranthus spp. reported in this study was lower than the value of 6.69 and 13.2 mg/kg reported in Nigeria for Amaranthus spinosus and A. hybridus L. (Agbaire, 2011; Akubugwo et al., 2007). Adedapo et al. (2011) reported phytic acid content of 5.59±0.02 mg/kg in B. pilosa which was higher compared to the value of 0.3264±0.0192 obtained in this study. In a related study, Essack (2017) reported that G. parviflora has 800 mg/kg phytic acid which is higher compared to the value of 0.5013±0.01130 mg/kg from this study. However, phytic acid values for Amaranthus spp., B. pilosa and G. parviflora determined in this study were below the value of 4 to 9 mg/100 g which results in 4 to 5 times reduction in iron absorption in humans.
 
Oxalic acid composition
 
Results on oxalic acid composition of the three indigenous vegetables are presented in Table 3. Oxalic acid consumption at 2 to 5 g/100 g levels has been reported to be toxic (Essack, 2017) because of the reduction in the bioavailability of minerals like calcium (Ladeji et al., 2004). Oxalic acid content in the indigenous leafy vegetables, in mg/100 g, ranged from 2141±81.7 to 2288±441 with B. pilosa and G. parviflora registering the highest and lowest values, respectively. B. pilosa had the highest oxalic acid concentration (p<0.05) compared to Amaranthus spp. (2250±111) and G. parviflora, respectively. The oxalic acid value for Amaranthus spp. obtained in this study was lower compared to the values of 5637, 3028 and 3325 mg/100 g for Amaranthus  viridis, Amaranthus spp. and A. spinosus previously reported by other authors (Sheela et al., 2004). On the other hand, the oxalic acid values of 2141±81.7 and 2288±441 mg/kg, for G. parviflora and B. pilosa reported in this study were comparatively lower to the values of 17600±1600 and 13100±400 mg/kg, respectively reported in South Africa (Essack, 2017). However, the oxalic acid concentration levels obtained in this current study were below the toxic levels and proper processing of vegetables such as cooking has been reported to further reduce the phytic acid concentration (Akwaowo et al., 2000) which further suggests that consumers are likely to be exposed to very low levels of oxalic acid making consumption of the three indigenous vegetables safe.
 
Reducing power
 
Results on the reducing power of the three indigenous vegetables are presented in Figure 3. The results have shown that the indigenous leafy vegetables extracts had high degree of electron-donating capacity with reference to the increasing sample extract concentration (Figure 3). Amaranthus subsp. 80% methanolic extracts had the highest (P<0.05)  reducing  power  followed  by  B.  pilosa and G. parviflora extracts at all concentrations. However, at 1.0 mg/ml, extract concentration, Amaranthus subsp. and B. pilosa vegetable extracts had similar reducing power (Figure 3).


 CONCLUSION

The findings from this study have shown that the three indigenous leafy vegetables contains high essential nutrients such as proteins, minerals, vitamin C and phenolic compounds which are important in improving human nutrition and health. The findings have further shown that the indigenous leafy vegetables exhibited high antioxidant properties and reducing power which is essential for their utilization as food as well as medicinal uses. The high nutrient content, high antioxidant capacity, reducing power and low phytic and oxalic acids present in the three indigenous vegetables suggest that low resource rural communities can get adequate nutrition and health through consumption of these indigenous vegetables. It is recommended that future studies on nutrient and phytochemical composition should target more indigenous vegetables consumed by communities in different parts of Malawi.


 CONFLICT OF INTERESTS

The authors have not declared any conflict of interests.


 REFERENCES

Abulude FO (2007). Phytochemical screening and mineral contents of leaves of some Nigerian woody plants. Research Journal of Phytochemistry 1(1):33-39.
Crossref


Adedapo A, Jimo F, Afolayan A (2011). Comparison of the nutritive value and biological activities of the acetone, methanol and water extracts of Bidens pilosa and Chenopodium alb.um. Acta Polania Pharmaceutica-Drug Research 68(1):83-92.


Adenipenkun CO, Oyetunji OJ (2010). Nutritional values of some tropical vegetables. Journal of Applied Bioscience 35:2294-2300.


Agbaire PO (2011). Nutritional and anti-nutritional levels of some local vegetables (Vernomia anydalira, Manihot esculenta, Teifera occidantalis, Talinum triangulare, Amaranthus spinosus) from Delta State, Nigeria. Journal of Applied Science and Environmental Management 15(4):625-628.


Akubugwo IE, Obasi NA, Chinyere GC, Ugbogu AE (2007). Nutritional and chemical value of Amaranthus hybrius L. leaves from Afikpo, Nigeria. African Journal of Biotechnology 6(24):2833-2839.
Crossref


Akwaowo EU, Ndon BA, Etuk EU (2000). Minerals and antinutrients in fluted pumpkin (Telfairia occidentalis HOOK f.). Food Chemistry 70:235-240.
Crossref


Anjali K, Joshi A, Maloo SR, Sharma R (2013). Assessment of the morphological and molecular diversity in Amaranthus ssp. African Journal of Agricultural Research 8(19):2307-2311.
Crossref


Association of Official Analytical Chemists (AOAC) (1990). Official methods of analysis. 15th Edn., Washington DC.


Baang RP, Rosario RM, Palmes ND (2015). Phytochemical profiles and antioxidant activity of selected indigenous vegetables in Northern Mindanao, Philippines. International Journal of Biological, Biomolecular, Agricultural, Food and Biotechnological Engineering 9(8):769-774.


Buchanan BB, Gruisen W, Jones RC (2000). Biochemistry and molecular biology of plants. 1st edition. IK International PVT Limited Indian.


Chang JS, Chiang LC, Chen CC, Liu TT (2001). Antileukemic activities of Bidens pilosa L. Var. minor (Blume) Sherff and Houttuyma cordata Thum. American Journal of Clinical Medicine 29:303-312.
Crossref


Chinma CE, Igyor MA (2007). Micronutrients and anti-nutritional contents of selected vegetables grown in Southern Nigeria. Nigerian Food Journal 25(1):111-116.
Crossref


Chionyedua TO, Anuoluwa MO, Adedoja DW (2009). The proximate and mineral composition of three leafy vegetables commonly consumed in Lagos, Nigeria. African Journal of Pure and Applied Chemistry 3(6):102-107.


Chipurura B (2010). Nutritional content, phenolic compounds composition and antioxidant activities of selected indigenous vegetables of Zimbabwe. Master of Philosophy thesis. University of Zimbabwe.


Chitsulo G (2013). Determination of nutritive value of selected indigenous vegetables: A case study of indigenous vegetables released by the indigenous vegetable project at Bunda. Bachelor of Science in Nutrition and Food Science Degree undergraduate research project report. Bunda College of Agriculture, Lilongwe, Malawi.


ChuYH, Chang CL, Hau HF (2000). Flavonoid content of several vegetables and their antioxidant activity. Journal of Science, Food and Agriculture 80:561-566.
Crossref


Day (Jr) RA, Underwood AL (1986). Quantitative analysis 5th edition, Prentice Hall Publication, London.


Do QD, Angkawijaya AE, Tran-Nguyen PL, Huynh LH, Soetaredjo FE, Ismadji S, Ju Y (2014). Effect of extraction solvent on total phenol content, total flavonoids content and antioxidant activity of Limnophila aromatica. Journal of Food and Drug Analysis 22:296-302.
Crossref


Ebert AZ (2014). Potential of underutilized traditional vegetables and legume crops to contribute to food and nutritional security, income and more sustainable systems. Sustainability 6:319-335.
Crossref


Essack H (2018). Screening of traditional South African leafy vegetables for selected anti-nutrient factors before and after processing. Master of Applied Sciences Thesis. Durban University of Technology.


Essack H (2017). Screening of traditional South African leafy vegetables for selected anti-nutrient factors before and after processing. Food Science and Technology 37(3):462-471.
Crossref


FAO, WFP, IFAD (2012). The state of food insecurity in the world 2012. Economic growth is necessary but not sufficient to accelerate reduction of hunger and malnutrition, Rome, FAO.


Flyman M, Afolayan A (2006). The suitability of wild vegetables for alleviating human dietary deficiencies. South African Journal of Botany 72(4):492-497.
Crossref


Funke OM (2011). Evaluation of nutrient contents of Amaranth leaves prepared using different cooking methods. Food and Nutrition Sciences 2:249-252.
Crossref


George PM (2003). Encyclopedia of foods. Volume 1. Humane Press; Washington p. 526.


Gupta S, Jyothilakshmia A, Manjunathb MN, Prakash J (2005). Analysis of nutrient and antinutrient content of underutilised green leafy vegetables. LWT-Food Science and Technology 38:339-345.
Crossref


Grases F, Isern B, Sanchis P, Perello J, Torres JJ, Costa-Bauza A (2007). Phytate acts as an inhibitor in formation of renal calculi. Frontiers of Bioscience 12:2580-2587.
Crossref


Grases F, Perello J, Isern B, Prieto RM, Costa-Bauza A, Santiago C Ferragu ML, Frontera G (2009). Anticalculus effect of a triclosa mouthwash containing phytate: a double blind, randomized, three-period cross over trial. Journal of Periodontal Resources 44:616-621.
Crossref


Grubben GJH, Denton OA (2004). Plant resources of Tropical Africa 2. Vegetables. PROTA Founation, Wageningen, Backhuys, Leiden, CTA, Wageningen.


Harland BF, Overleas D (1987). Phytate in foods. World Review of Nutritional Diet 52:235-259.
Crossref


Hilou A, Nacoulma OG, Guiguemde TR (2006). In vivo antimalarial activities of extract from Amaranthus spinous L. and Boerhaavi aerecta L. Journal of Ethnopharmacology 103:236-240.
Crossref


Hurrel RF, Juilert MA, Reddy MB, Lynch SR, Dassenko SA, Cook JD (1992). Soy protein, phytate and iron absorption in humans. American Journal of Clinical Nutrition 56:573-578.
Crossref


Hutchings A, Scott AH, Lewis G, Cunningham A (1996). Zulu medicinal plants, South Africa, University of Natal Press.


Ihekoronye AI, Ngoddy PO (1985). Food lipids: In Integrated Food Science and Technology for the Tropics. MacMillan Publication. London.


Kachiguma NA, Mwase W, Maliro M, Damaliphetsa A (2015). Chemical and mineral composition of Amaranth (Amaranthus L.) species collected from Central Malawi. Journal of Food Research 4(4):92-102.
Crossref


Keatinge D (2012). Vegetables: Less visible but vital for human health-why nutrient-dense indigenous vegetables must be on the plate for economic development food security and health. AVRDC News Brief, 31 May2012.


Krishnaiah D, Sarbatly R, Bono A (2007). Phytochemical antioxidants for health and medicine: A move towards nature. Biotechnology Molecular Biology Review 1: 97-104.


Ladeji O, Ahin CU, Umaru HA (2004). Level of antinutritional factors in vegetables commonly eaten in Nigeria. African Journal of Natural Science 7:71-73.


Mahesh S, Pavithra GJ, Parvathi MS, Reddy R, Shankar AG (2015). Effect of processing on phytic content and nutrient availability in food grains. International Journal of Agricultural Sciences 5(5):771-777.


Matenge S, Li J, Apau S, Tapera R (2017). Nutritional and phytochemical content of indigenous leafy vegetables consumed in Botswana. Frontiers in Food and Nutrition Research 3(1):1-7.


Mih AM, Ngone AM, Ndam LM (2017). Assessment of nutritional composition of wild vegetables consumed by the people of Lebialem Highlands, South Western Cameroon. Food and Nutrition Sciences 8:647-657.
Crossref


Muchuweti M, Kasiamburu A, Benhura MAN, Chipurura B, Amuna P, Zotor F, Parawira W (2011). Assessments of wild leafy vegetables consumed in the Buhera district of Zimbabwe: a preliminary study. Acta Horticulture 806:323-330.
Crossref


Nnamani CV, Oselebe HO, Okporie EO (2007). Ethnobotany of indigenous leafy vegetables of Izzi clan, in Ebonyi state, Nigeria: In: Proceedings of 20th Annual National Conference of Biotechnology Society of Nigeria. Abakaliki, November 14th-17th, pp. 111-114.


Nesamvuni C, Steyn NP, Potgieter MJ (2001). Nutritional value of wild, leafy plants consumed by the Vhavenda. South African Journal Science 97:51-54.


Odhav B, Beekrum S, Akula U, Baijnath H (2007). Preliminary assessment of nutritional value of traditional leafy vegetables in KwaZulu-Natal, South Africa. Journal of Food Composition and Analysis 20(5):430-435.
Crossref


Pedersen HB, Søren B, Brigitte T, Preben BH (2007). Molecular genetic approaches to increasing mineral availability and vitamin content of cereals. Journal of Cereal Science 46:308-326.
Crossref


Pham-Huy LA, He H, Pham-Huyc C (2008). Free radicals, antioxidant diseases and health. International Journal of Biomedical Science 4(2):89-96.


Reddy NR, Sathe SK, Salunkhe DK (1982). Phytates in legumes and cereals. In Advances in food research 28:1-92. Academic Press.
Crossref


Reddy NR (2002). Occurrence, Distribution, Content and Dietary Intake of Phytate. In: Food Phytates, Reddy, N.R. and S.K. Sathe (Eds.). CRC Press, Boca Raton, Florida, pp. 25-51.


Saidu AN, Jideobi NG (2009). The proximate and elemental analysis of some leafy vegetables grown in Minna and Environs. Journal of Applied Science and Management 13(4):21-22.
Crossref


SatyaEswari J, Dhagat S, Naik S, Dibya S (2018). Phytochemical and antimicrobial studies of oroxylum indicum extracts. Pharmaceutical Processing 6(1):007-014.


Shamsuddin AM (2002). Anti-cancer function of phytic acid. International Journal of Food Science and Technology 37:769-782.
Crossref


Schippers RR (2000). African indigenous vegetables. An overview of the cultivated species. Natural Resources Institute /ACP-EU Technical Central for Agricultural and Rural Cooperation, Chatham, UK.


Sheela K, Kamal GN, Vijayalakshmi D, Geeta MY, Roopa BP (2004). Proximate analysis of underutilized green leafy vegetables in Southern Karnataka. Journal of Human Ecology 15(3):227-229.
Crossref


Singletone VL, Rossi JA (1965). Colorimetry of total phenolics with phosphomolybdic-phosphotungstic acid reagents. American Journal of Enology and Viticulture 16:144-158.


Tanumihardjo SA, Yang Z (2005). Epidemiology of health effects. in: Caballero B, Allen L, Prentice A. Eds. Encyclopedia of Human Nutrition, 2nd edition, Elsevier Ltd, Oxford:339-345.
Crossref


Tomori WB, Obijole OA (2000). Mineral composition of some less utilized vegetables in Nigeria. African Journal of Science and Technology 1(2):153-157.


Tredgold MH (1990). Food plants of Zimbabwe, Zimbabwe, Mambo Press.


Unuofin JO, Otunola GA, Afolayan AJ (2017). Nutritional evaluation of Kedrostis africana (L) Cogn: An edible wild plant of South Africa. Asian Pacific Journal of Tropical Biomedicine 7(5):443-449.
Crossref


Uusiku NP, Oelosfe A, Duodu KG, Bester MJ, Faber M (2010). Nutritional value of leafy vegetables of sub-Saharan Africa and their potential contribution to human health: review. Journal of Food Composition and Analysis 23:499-509.
Crossref


Uwah EI, Ogugbuaja VO (2012). Investigation of some heavy metals in Citrullus vulgaris, Cucumis sativus and soils obtained from gardens being irrigated with wastewater in Maiduguri, Nigeria. Global Research Journal of Agriculture and Biological Sciences 3(5):373-380.


Warwick SI, Sweet RD (1983). The biology of Canadian weeds. Galinsoga parviflora and G. quadriradiata (G. ciliate). Canadian Journal of Plant Science 63:695-709.
Crossref


Yang QM, Pan X, Kong W (2010). Antioxidant activities of malt extract from barley (Hordeum vulgaris) towards various oxidative stress in vitro and in vivo. Food Chemistry118:84-90.
Crossref


Zemede A, Mesfin T (2001). Prospects for sustainable use and development of wild food plants in Ethiopia. Economic Botany 55:47-62.
Crossref


Zvaigzne G, Karklina D, Seglina D, Krasnova I (2009). Antioxidants in various citrus fruit juices. Chemine Technologija 39(52):56-61.


          */?>