ABSTRACT
The McFarland method is designed to estimate bacterial concentrations by means of a turbidity scale (absorbance) which consists of a series of tubes previously calibrated, and with an optical density produced by the precipitation of barium sulphate. This absorbance is compared to bacterial populations. The most used absorbance is the one corresponding to 0.5 on that scale, which assumes a population of 1.5×10⁸ cfu/mL (colony forming units per milliliter). In order to verify the accuracy of this scale, 25 different bacterial species were tested, adjusting to 0.5 of the McFarland scale and then an aliquot in plate with agar was cultured in triplicate to account for the population. The results showed very diverse populations, with variations ranging from 30 to 300% of what was expected (0.5×10⁸ to 3×10⁸ cfu/mL). The most important implications of this are in studies of microbial ecology, in clinical microbiology, in studies on sensitivity to antibiotics and in areas of quality control. It is suggested to take special care when it is required to establish, with more accuracy, the population of a crop.
Key words: McFarland, accuracy, bacterial population.
Many times, especially in clinical services, the rapid identification of a microorganism is required in order to establish an adequate therapy or for simple experimentation. Most of the time, isolation can be made by limiting some of the microorganism's demands, such as feeding, environment, reactions to compounds and/or biochemical characteristics (Joklik et al., 1998). In other cases, it is necessary to express the microbial concentration without specifying the number of cells, for example dry weight, wet weight, turbidimetry or nephelometry (Corral et al., 2012; Cabeza, 2013). However, on very specific occasions, population counting is required, for example, when establishing a specific inoculum or in studies of microbial resistance when it is required to determine the minimum inhibitory concentrations (MIC) or mínimum bactericidal concentration (CMB) or experimental doses 50 (EC50) as indicated by pharmacopoeias, hospitals or research institutes (Pharmacopeia of the United Mexican States (FEUM), 2015; Plant et al., 2016). In the quality control, phenotipification and identification of specific strains, it is also important to count the microorganisms. Many laboratories have to guarantee that their results are reliable, which implies starting from well-characterized microbial populations (Gupta et al., 2016; Paez et al., 2008).
The number of viable cells is considered the best measure of cell concentration. However, for many purposes, the turbidity of the crop, measured by photoelectric means, can be linked to the viable population in the form of a standard curve (Brooks et al., 2005). Turbidity is defined as the reduction of the transparency of a liquid caused by the presence of undissolved particles of material other than the liquid itself. Being an indicator of optical appearance, caused by the dispersion and absorption of light energy through the liquid, turbidity can only be measured using optical techniques. It is based on the relationship between the intensity of the incident light and the light dispersed by the medium, by the Lambert-Beer law, which establishes that the turbidity is proportional to the concentration of particles (Patarroyo, 2018; Acebo et al., 2013).
McFarland standards are used as turbidity patterns in the preparation of suspensions of microorganisms. The 0.5 standard of the McFarland scale has a special application in the preparation of bacterial inocula for antimicrobial susceptibility testing and is perhaps the most used procedure when determining a microbial population. It is always believed that this way of counting populations is accurate, due to its widespread use. The objective of the present work was to compare the populations of diverse bacterial species through the McFarland scale and the immediate culture in plates. The results suggest that in some occasions the McFarland scale is a bad, or very bad option to account for populations.
Reagents
The experimental reagents used included 0.48 M BaCl2 and 0.18 M H2SO4 solutions, respectively, along with Muller Hinton agar and Muller Hinton broth.
Crops
Twenty five (25) bacteria provided by the culture collection of the School of Chemical Sciences (Juarez University of Durango State) were tested: Escherichia coli, Enterococcus spp., Staphylococcus aureus, Klebsiella pneumoniae, Acinetobacter baumannii, Streptococcus pyogenes, Yersinia enterocolitica, Aeromonas hydrophila, Shigella flexneri, Bordetella bronchiseptic, Proteus mirabilis, Pseudomonas spp., Acinetobacter spp., Stenotrophomonas maltophilia, Salmonella choleraesuis, Klebsiella spp., Serratia marcescens, Alcalientes spp., Salmonella paratyphi, Shigella Sonnei, Aeromonas caviae, Hafnia alvei, Providencia rettgeri, Morganella morganii and Vibrio cholerae.
Standard McFarland preparation
0.5 mL of a 0.048 M BaCl2 solution was added to 99.5 mL of a 0.18M H2SO4 solution and vortexed for 2 min. The solution was read in a spectrophotometer at a wavelength of 625 nm and it was found that the turbidity (absorbance) was 0.08 to 0.1, corresponding to 0.5 on the McFarland scale.
Each strain was plated on Muller Hinton agar seeded in three fields by cross streak and incubated at 37°C for 24 h. Colonies were then taken, one by one, to be suspended in a 12×75 tube with Muller Hinton broth and vortexed for 2 min, until adjusted to the 0.5 McFarland scale. From each tube, a series of 1:10, 1: 100, 1: 1000, 1:10 000, 1: 100 000, 1: 1,000,000 dilutions were made, each of which was seeded on a plate with Muller Hinton agar, incubated at 37°C for 24 h and then quantified the population expressed as cfu/mL. The assay for each strain was done in triplicate.
Statistics
The reproducibility when adjusting each experiment to the 0.5 scale of McFarland was determined by the percentage of the coefficient of variation of the absorbance of each strain (C.V. = standard deviation/average). The precision was determined by the percentage of the relative standard deviation (RSD) of the population counted in plate vs the expected population according to the McFarland scale, expressed as cfu/mL:
RSD = (1×10⁸ cfu/mL - Average population of cfu/mL) / 1×10⁸ cfu/mL
The test was considered acceptable when C.V ≤ 15% and RSD ± 15%. Additionally, ANOVA was applied to determine differences between the populations of the strains studied.
The average absorbance for all the trials was 0.09 ± 0.007, with a C.V. equal to 7.7%; so it is inferred that all crops were adjusted with great precision to 0.5 McFarland. Nevertheless, the populations counted on plate showed great variability with Table 1 showing the results.
Only three of the strains presented the expected population: Acinetobacter spp, Alcaligenes spp and Hafnia alvei, the rest showed populations lower or higher than expected population. Five strains showed higher than expected population, almost double, and A. hydrophila showed a population six times higher than expected. The rest of the strains presented a population between 50 to 70% lower than expected.
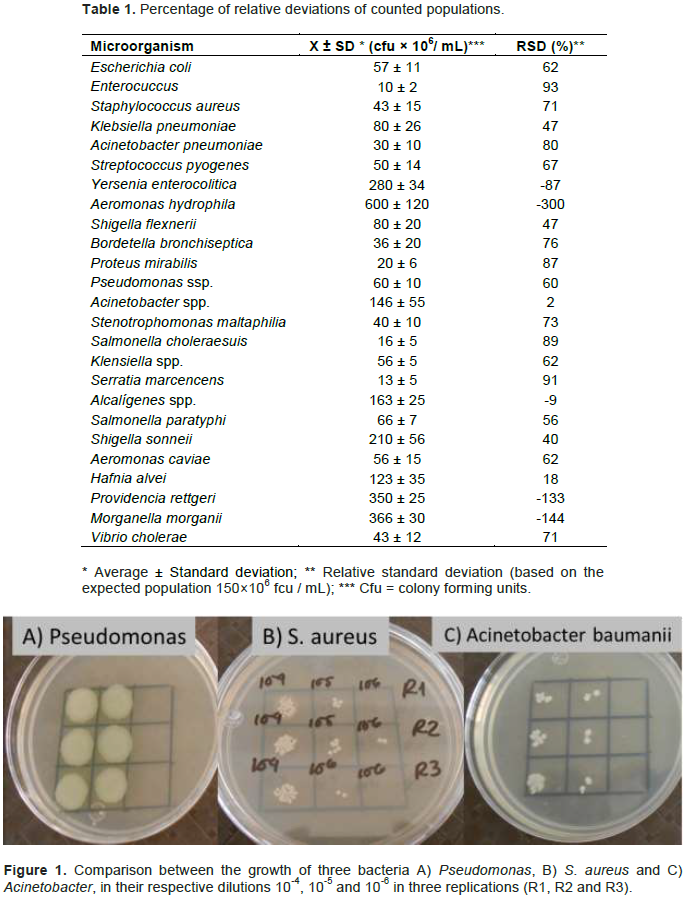
Figure 1 shows the differentiated growth between three different species in their three repetitions (R1, R2 and R3). All inocula were adjusted to 0.5 McFarland; however, the growth of Pseudomonas (A) was considerably higher than that presented by S. aureus (B). In addition, note that even S. aureus shows a greater growth than Acinetobacter.
The ANOVA test indicates that there is no significant difference (p <0.05) when adjusting the absorbance of all cultures. However, there is a significant difference (p > 0.05) between the counted populations.
The results obtained in the present work suggest that McFarland, despite being a fast and widely used method, fails to demonstrate accuracy and precision. Some work had already made similar observations; for example, Procop et al. (2017) suggested that if a McFarland standard is used to prepare an inoculum, it is necessary to verify the amount of microorganisms in the inoculum periodically, inoculating serial dilutions of the suspension in agar plates. Sutton (2011) reports that this scale has been designed to estimate concentrations of gram-negative bacteria such as E. coli, but it must be borne in mind that this estimate becomes uncertain with organisms outside normal use, such as different species of bacteria that differ in size and mass, as well as yeast and mold, and adds that the use of this method requires calibration and validation, which is not normally done. It is common to find real populations counted in plaques lower than what is expected, which is consistent with our results, since 70% of our strains showed lower than expected populations.
In recent works, Zapata and Ramirez (2015) reported similar results when comparing the adjustment of microbial populations by McFarland turbidity and by a Densimat densimeter. When analyzing six different microbial species, they found a statistical difference between both methods, indicating that the adjustment by Densimat resulted in greater precision. Goughenour et al. (2015) also reports a growth of 8.4×10⁶ cfu on the McFarland scale 1.0 when developing a rapid method to identifying fungi and yeasts. According to the McFarland scale, there should be 3×10⁸ cfu. The authors point out the need to standardize and verify the procedures used, even those that supports a proven accuracy as CLSI.
In contrast, García (2007) reports having counted similar to expected populations for G + bacteria like S. aureus and G- bacteria like E. coli, Pseudomonas aeruginosa and Salmonella spp. despite their morphological differences (cocci and bacilli). On the other hand, Bacillus cereus was shown to have a bacterial concentration 40 times lower despite having been adjusted to the same McFarland scale. Navarro et al. (2010) makes a similar observation when scaling 0.6 McFarland with a range of absorbances that was between 0.152 - 0.157 and a wavelength of 620 nm.
All these differences in counting populations may be due to the great biological diversity of the micro-organisms. The forms, functions and size in them is highly variable (Brooks et al., 2005) so it is expected that a quantification method cannot be applicable in its entirety without presenting restrictions. The method to quantify bacteria by the McFarland scale has the advantage of being fast; however, due to the great variability in the size and shape of the microorganisms, it may result in erroneous readings, since it can have high turbidity produced by a large population of small microorganisms or a small population of large microorganisms.
Based on the populations recorded in our results, it is suggested to rethink the use of the McFarland scale. In cases where a larger population was obtained than expected, it is due to the fact that the bacteria are smaller and a greater number of them are required to equalize the turbidity. This could be solved if for smaller bacteria, smaller scales are introduced to 0.5 of McFarland, such as 0.25 or 0.1. Bacteria such as E. coli, Enterococcus and Acinetobacter, among others, should be counted in this way. In contrast, lower than expected populations are due to the fact that the bacteria are smaller, so the use of scale 1 or 2 instead of 0.5 is required. Bacteria such as Aeromanas and Shigella should be counted in this way.
When accounting for a microbial population, special care must be taken when adjusting for the McFarland scale, especially in research where the results are directly dependent on an exact count.
The authors have not declared any conflict of interests.
REFERENCES
|
Acebo D, Hernández A (2013). Turbidimetric methods and its applications in the life sciences. CENIC journal. Biological Sciences 44(1).
|
|
|
|
Brooks G, Butel J, Morse S (2005). Medical microbiology of Jawetz, Melnick and Adelberg 18:3.
|
|
|
|
|
Cabeza E (2013). Fundamentals of Predictive Microbiology: theoretical and practical applications. Faculty of Basic Sciences, Univerisdad de Pamplona [Online]. Consulted jul 4th 2018. Available on:
View
|
|
|
|
|
Corral A, Morales Y, Pazos L, Ramírez A, Martínez R (2012). Quantification of culturable bacteria by means of the method of "Dripping in Plate by Sealing (or stamping) Massively" Microbial molecular ecology laboratory, Autonomous University of Puebla. Revista Colombiana de Biotecnologia 14(2): 147.
|
|
|
|
|
FEUM: Pharmacopoeia of the United Mexican States (2015), [on line] available on:
View
|
|
|
|
|
García Rico RO, Herrera Arias FC (2007). Evaluation of the inhibition of the growth of five pathogenic bacterial strains by extracts of Allium savitum, Allium fistulosum and Allium cepa: in vitro preliminary study. Bistua, Journal of the Faculty of Basic Sciences, Colombia 5(2):68-79.
View
|
|
|
|
|
Joklik W, Willett H, Amos D, Wilfert C (1998). Microbiology. Zinsser 20th ed. 1:30-33.
|
|
|
|
|
Goughenour KD, Balada-Llasat JM, Rappleye CA (2015). Quantitative microplate-based growth assay for determination of antifungal susceptibility of histoplasma capsulatum yeast. Journal of Clinical Microbiology 53(10):3286-3295.
Crossref
|
|
|
|
|
Gupta M, Kaore N, Gupta A (2016). Comparative evaluation of MIC by E-test and cefoxitin disc difussion for detection of methicillin resistant Staphylococcus aureus (MRSA). Indian Journal of Microbiology Research 3(4):408-4011.
|
|
|
|
|
Navarro EE, Salcedo M, Mu-oz M, Mendoza R (2010). Validación de la técnica de recuento de Coliformes Totales y E. coli por el método filtración de membrana en el laboratorio de control de calidad de Aguas de Cartagena SA ESP. Ciencia y Salud Virtual 2(1):21-30.
|
|
|
|
|
Páez S (2008). Secondary validation of the membrane filtration method for the detection of total coliforms and Escherichia coli in water samples for human consumption analyzed in the public health laboratory of Huila (Thesis). Pontifica Universidad Javeriana, Faculty of Sciences, Bogotá Colombia.
|
|
|
|
|
Patarroyo A (2018). A. Chemical training program applied to industry, Practice 1: Turbidimetric quantification of sulphates [on line] Consulted on May 25, 2018. Available on:
View
|
|
|
|
|
Plant AJ, Simpson SJ, Nobbs SJ (2016). Pesudomonas aeruginosa and fosfomycin susceptibility testing – does it work? Department of Medical Microbiology, Plymouth Hospitals. [on line] Consulted jul 04th 2018. Avalable on
View
|
|
|
|
|
Procop GW, Church DL, Hall GS, Janda WM, Konema EW, Schreckenberg PC (2017). Koneman Microbiological diagnosis-text and atlas. Wolters Kluwer 7a Ed. Barcelona.
|
|
|
|
|
Sutton S (2011). Measurement of microbial cells by optical density. Journal of Validation Technology 17(1):46-49.
|
|
|
|
|
Zapata A, Ramirez AS (2015). A comparative study of McFarland turbidity standards and the Desnimat photometer bacterial cell density. Current Microbiology 70(6):907-909.
Crossref
|
|