ABSTRACT
Arapaima gigas, also known as pirarucu, is endemic to the Amazon basin. There is currently considerable effort being made to cultivate this species to reduce pressure on natural populations. We characterized the diversity and genetic structure of subpopulations of wild and captive A. gigas based on 19 microsatellite loci. Captive subpopulations of A. gigas exhibited less diversity than wild individuals. We also verified the existence of outlier loci under selective pressure in both subpopulations, indicating the occurrence of local adaptation in some individuals of A. gigas. Furthermore, we identified a high-level genetic structure among the subpopulations, with no mixing between subpopulations. The lack of mixing between populations, the local adaptation, and the genetic structure indicate that these subpopulations should be managed and isolated to prevent captive individuals from escaping into the wild, which would reduce the diversity of the wild subpopulations. We suggest a program for the genetic management of captive subpopulations to avoid the random loss of genetic variability and the selection of characteristics that are undesirable for commercial and conservation purposes.
Key words: Allelic diversity, osteoglossidae, conservation and management, heterezygosity, osteoglossiformes.
The future of aquaculture largely depends upon the effective management of the genetic resources of farmed fish. Maintaining an appropriate level of genetic diversity is critical to aquaculture production and value, and is necessary to ensure the availability of affordable products for human consumption in poor areas worldwide. Unfortunately, most farmed fish species in Brazil have not been fully domesticated, and their wild relatives are preferentially used for breeding programs and related research. Furthermore, there are many species (possibly hundreds) that might have potential for aquaculture (Pullin, 2007), including Arapaima gigas, which is a potential candidate for Brazilian aquaculture, particularly in Northern Brazil.
A. gigas (pirarucu) is endemic to the Amazon basin and is the longest freshwater fish in the world, reaching 3 m in length and more than 200 kg in weight (Castello, 2004). Because of its high economic importance in the fisheries of Northern Brazil, A. gigas has recently been introduced into fish farms to facilitate its reproduction and rearing in captivity. This effort has increased in recent years due to the ability of A. gigas to adapt to a confined environment and improvements in facility management. Because A. gigas is the largest freshwater scaled fish in the world, it has high commercial value and has been overexploited for more than two decades (Viana et al., 2007). Near the principal cities of the Brazilian Amazon, A. gigas is considered commercially extinct, and fishermen have reported difficulties in catching A. gigas in certain areas (Goulding, 1980; Castello, 2008; Oliveira et al., 2005).
The International Union for the Conservation of Nature (IUCN) has included A. gigas on the red list of endangered species (Ortiz et al., 2007) and classified it in Appendix II of the Convention on the International Trade of Endangered Species of Wild Fauna and Flora (CITES), which lists species that are not necessarily extinct but may become extinct if their trade is not controlled (Viana et al., 2007).
To prevent overfishing and preserve the species, the Brazilian Institute of Environment and Natural Resources (IBAMA), a Brazilian government agency, established a minimum size of A. gigas for capture (1.5 m total length) in 1989. In 1990, the IBAMA enforced a fishing ban from December 1st to May 31st, which corresponds to the reproductive phase of the species. Since 1996, IBAMA and the Amazonas State Environmental Agency (SDS - Sustainable Development State Secretary) have prohibited the fishing and commercialization of A. gigas; fish from managed areas and fish farms are exempted from this prohibition (Arantes et al., 2007). These conservation actions were implemented concurrently with the creation of Sustainable Development Reserves (SDR) in Amazonas State, where fishing occurs with the direct involvement of local fishermen in the management of populations of this species. Therefore, annual portions (quotas) are permitted for the capture of A. gigas during a certain period of the year, according to the minimum size limitations. These actions have resulted in reduced fish extraction from the wild environment and increased the interest of fish farmers in the artificial management of breeders.
A new species of Arapaima was discovered in the Central Amazon of Brazil (Stewart, 2013a), and it was believed that the Arapaima was considered monotypic since 1868, with A. gigas is the only recognized species (Stewart, 2013b). This species was collected near the confluence of the Solimões and Purus Rivers, and comparisons with the pirarucus Development Mamirauá shows that there are at least two species of Arapaima in the Amazon State.
The cultivation of freshwater fish in Brazil is expanding rapidly due to the availability of favorable areas for cultivation, the existence of an enormous river network, and the high adaptive potential of many native species in captivity. However, aquaculture practices have reduced the genetic variability of captive animals as a result of unassisted breeding or the use of a small number of founders in fish farms (Wasko et al., 2004). Both practices alter genotype frequencies over generations and result in adaptation of the species to the confinement conditions (Santos et al., 2012).
The demand for A. gigas is high; therefore, large-scale data on the genetic features of wild and cultivated populations are needed. The sizes of founder populations are generally limited by farming constraints, which results in the use of a few individuals as broodstock. This practice may lead to erosion of the genetic diversity of the stocks, thereby compromising industrial performance. Due to the relatively short history of large-scale A. gigas commercial culture, the phenotypic effects of this erosion are not yet clear.
The present study is the first to address the genetic variability of captive A. gigas subpopulations. This study aimed to (i) define the genetic structure of A. gigas populations in a selected areas by measuring the genetic heterogeneity among wild and captive populations and (ii) estimate the degree of genetic erosion of reared stocks by comparing their genetic variability with that of geographically close wild stocks.
Ethics committee
The group leader, Adalberto Luis Val was granted a license for capture under the umbrella project ADAPTA (SISBIO License #29837-4). Samples from wild subpopulations were collected according to the guidelines set by the IBAMA of the Ministry of Environment. All samples were collected from anesthetized animals according to the guidelines from Brazilian Council for Ethics in the use of Experimental Animals (CONCEA) and the Ministry of Science, Technology and Innovation.
Collection of samples
Wild A. gigas individuals were captured from the SDR during the legal period for managed fishing with the help of a harpoon, which was the only gear allowed. Local fishermen are licensed to harpoon the fish body (never the head) and, subsequently place fish in ice boxes to commercialize them. The spear catch is a traditional (cultural) way used by locals to minimize damage in fish meat. Captive individuals were captured with trawls with permission from two private farm onwers and with the permission Ceara State Aquaculture Facility. Because these fish were intended for the local market, they were anesthetized and euthanized in ice water prior to the collection of tissue samples. A total of 10 g of white muscle was collected from each A. gigas sample using the tweezers process for the stilettos and then transferred to sterile eppendorf tubes and immersed in liquid nitrogen. The samples were stored at a low temperature (-80°C) until subsequent DNA analysis.
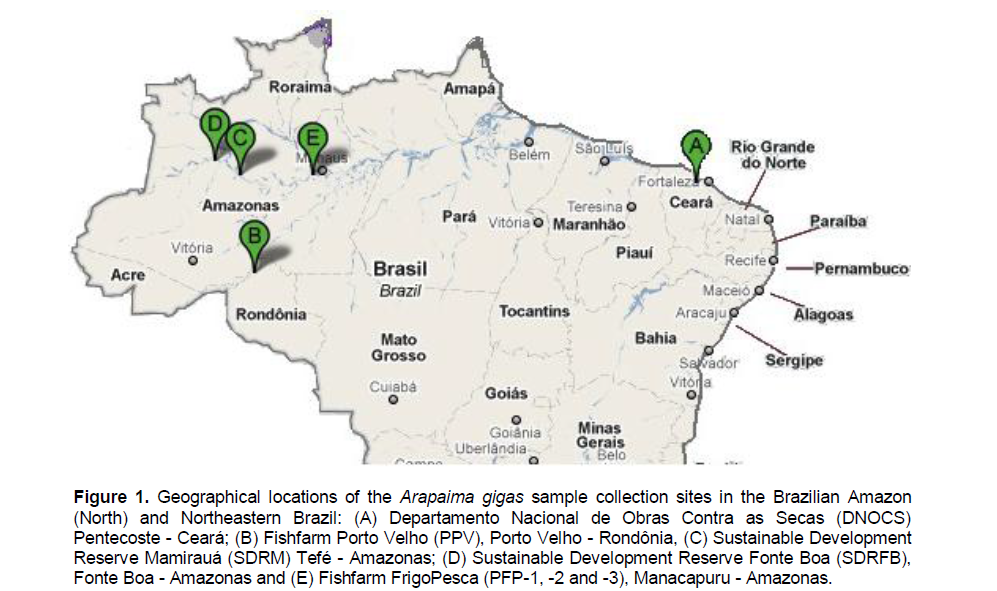
Samples of white muscle were collected from 218 wild (two subpopulations) and captive (five subpopulations) A. gigas individuals from Northern and Northeastern Brazil (Figure 1). The wild individuals were collected from the SDR in Mamirauá (SDRM; 25 samples) (01° 49’ 00” S and 65° 42’ 00” W) and Fonte Boa (SDRFB; 18 samples) (02° 30’ 52” S 66° 05’ 33” W) in Amazonas. All samples of captive individuals were taken from F1 progeny and acquired from three fish farms: FrigoPesca (Amazonas), from which samples were collected three different times (every 6 months) between 2009 and 2010 (PFP-1: 47 samples, PFP-2: 18 samples, and PFP-3: 32 samples) (03° 17’ 39” S and 60° 38’ 04” W); Porto Velho (Rondonia State) (PPV: 48 samples) (08° 45’ 43” S and 63° 54’ 07” W); and Estação de Piscicultura do Departamento Nacional de Obras Contra as Secas (Ceará State) (DNOCS: 30 samples) (03° 47’ 29” S and 39° 15’ 58” W).
DNA extraction and PCR amplification
Total genomic DNA was extracted from the 218 tissue samples using the protocol described by Sambrook et al. (1989) with some modifications. Approximately, 100 mg of tissue was digested overnight at 37°C in 0.7 ml of lysis buffer (6 M urea, 10 mM Tris-HCl, 125 mM NaCl, 1% SDS, 10 mM EDTA, pH 7.5); 10 µl of proteinase K (Fermentas - Thermo Fisher Scientific - Suwanee, GA USA), RNase A (Invitrogen - Life Technologies- Grand Island, NY) and 1,4-dithiothreitol (Biosynth® Chemistry and Biology Rietlistr, Switzerland) were then added. After digestion, the samples were washed with phenol-chloroform-isoamyl alcohol (Invitrogen) and isopropanol on ice. The pellet was resuspended in 50 µl DNase-free H2O. The quality of the extracted DNA was verified by electrophoresis in a 1.5% agarose gel using GelRed® (Invitrogen) and visualization using an L-PIX Molecular Image transilluminator (Loccus Biotecnologia - São Paulo, Brazil). The DNA was quantified using a NanoDrop® 2000 spectrophotometer (Thermo Scientific - Suwanee, GA USA).
The A. gigas samples were genotyped using the 10 microsatellite loci identified by Farias et al. (2003) (AgCTm1, AgCTm3, AgCTm4, AgCTm5, AgCTm7, AgCTm8, AgCAm4, AgCAm16, AgCAm18, and AgCAm26) and the 9 loci identified by Molecular Ecology Resources Primer Development (Consortium et al., 2011) (AG_01, AG_02, AG_03, AG_07, AG_09, AG_11, AG_12, AG_13, and AG_15). Polymerase chain reactions (PCR) were performed using a 96-well VeritiTM Thermal Cycler (Applied Biosystems - Life Technologies - Grand Island, NY) in a final reaction volume of 10 µl. Each PCR contained 1.5 µl of genomic DNA (50 ng/µl), 1.0 µl of forward primer (0.4 mM), 1.5 µl of reverse primer (0.4 mM), 1.0 µl 6-FAM fluorescent M13 primer [14] (0.4 mM), and 5.0 µl PCR Master Mix 2X (Fermentas) containing Taq DNA polymerase (0.05 U), MgCl2 (1.5 mM), and dNTPs (0.4 mM). The PCR cycling conditions were as follows: 94°C for 3 min; 20 cycles at 94°C for 20 s, 56 to 58°C for 20 s, and 68°C for 30 s; 25 cycles at 94°C for 20 s, 53°C for 20 s, and 68°C for 30 s, and a final extension at 72°C for 10 min. The amplified PCR products were confirmed by electrophoresis in a 1.5% agarose gel using GelRed® (Invitrogen) and visualization using an L-PIX Molecular Image transilluminator (Loccus Biotecnologia). The amplified products were genotyped on an ABI 3130xl Genetic Analyzer (Applied Biosystems) using the GeneScan Liz-500 (-250) size standard (Applied Biosystems) to determine fragment length. The alleles were scored based on the consistent pattern of their stutter peaks and the peak intensity in each individual at each locus using GeneMapper v4.0 (Applied Biosystems).
Data analysis
Genetic diversity
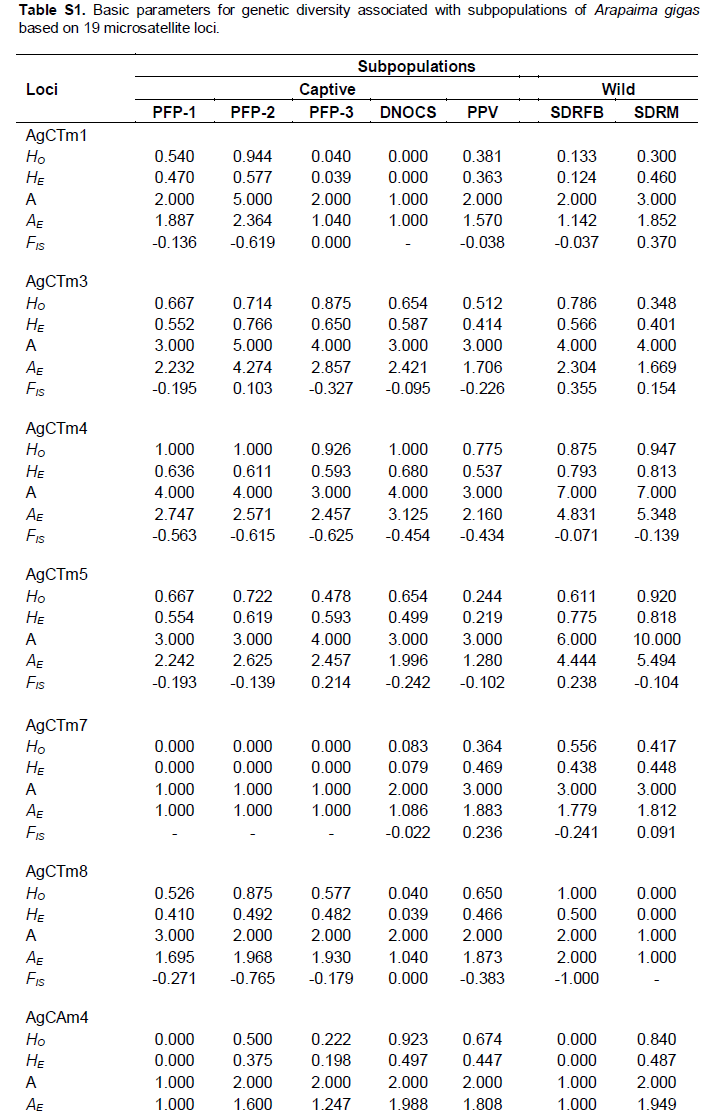
The genetic diversity of the A. gigas subpopulations was estimated based on the following parameters: the observed (HO) and expected (HE) heterozygosities (Fstat v2.9.3.2) (Goudet, 2001); the number of alleles per locus (Genetix v4. 5.2) (Belkhir et al., 2004); the number of private alleles or the fixation index (FIS) (GDA v1.1) (Lewis and Zaykin, 2000); the polymorphism information content (PIC) (Cervus v3.0.3) (Kalinowski et al., 2007); and the effective number of alleles per locus (AE). To calculate the effective number of alleles, we used the following mathematical formula: AE = 1/(1-HE). Micro-Checker v2.3 software (van Oosterhout et al., 2004) was used to test for the presence of null alleles, and their frequencies were calculated using Cervus v3.0.3 software (Kalinowski et al., 2007). The linkage disequilibrium (LD) and Hardy-Weinberg equilibrium (HWE) were calculated using the Fstat software, with sequential Bonferroni corrections to minimize the errors of type I microsatellite markers (Rice, 1989). The significance level was α = 0.05.
Genetic differentiation
The levels of genetic differentiation among sampling sites were analyzed using the F statistics of Wright (FIT, FIS and FST) (Weir and Cockerham, 1984) using the software Fstat and Arlequin v3.5 (Excoffier and Lischer, 2010). The indices of genetic differentiation, FST (Weir and Cockerham, 1984) and RST (Slatkin, 1995), were applied to better address the mutational models for the microsatellite data (e.g., IAM for FST (Kimura and Crow, 1964) and SMM for RST (Kimura and Otha, 1978). We also applied 3 estimators of genetic differentiation, GSTest (Nei and Chesser, 1983), G'STest (Hedrick, 2005), and Dest (Jost, 2008). These estimators were calculated using Smogd v1.2.4 software (Crawford, 2010). Analysis of molecular variance (AMOVA) (Excoffier and Slatkin, 1995) was performed for the 7 A. gigas subpopulations using Arlequin software.
Analysis of population structure
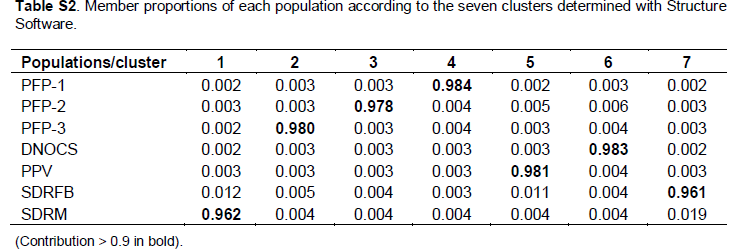
Structure v2.3.1 software (Pritchard et al., 2000; Falush et al., 2003) was used to verify the level of genetic structure among the A. gigas subpopulations under the ancestral admixture model, which correlates gene frequencies between subpopulations. Subsequently, the data generated a burn-in of 50,000 steps per 200,000 using the Markov chain Monte Carlo (MCMC) test for inference. We used the Structure Harvest v0.6.8 software (Earl and Holdt, 2012) to check the value of ΔK (according to Evanno et al., 2005), which represents the highest level of hierarchy of the genetic divisions. Furthermore, we conducted a run for each test with K = 1 and K = the number of sampled populations +2, with 3 replicates for each K. To complement the analysis of genetic structure, we performed a factorial correspondence analysis (FCA) (Benzecri, 1973) of the genetic distances between subpopulations using Genetix software, allowing the program to identify potential outlier individuals. The values of FST (Weir and Cockerham, 1984) and the genetic distance (DA) (Nei, 1978; Cavalli-Sforza and Edwards, 1967) in pairs were constructed after comparing the subpopulations of A. gigas. A neighbor-joining tree (NJ) was constructed using GDA software based on genetic distance according to Nei (1978).
Bottlenecks and detection of outlier loci (FST-outlier method)
We analyzed the occurrence of bottleneck populations (with an excess of heterozygotes) in the wild and captive A. gigas subpopulations using Bottleneck software (Cornuet and Luikart, 1996; Piry et al., 1999). This analysis was used to detect potential bottleneck populations of no more than 2NE-4NE for past generations, depending on the severity of the bottleneck and the rate of change of the loci analyzed. In this study, we applied 2 mutational models [Stepwise mutation model (SMM) and Two phase model (TPM)]. These models are the most appropriate for evaluating microsatellite data (di Rienzo et al., 1994) and were implemented at 95% (SMM) and 5% (TPM) for the various stages of mutation, ranging 12% among several steps, as recommended by Piry et al. (1999).
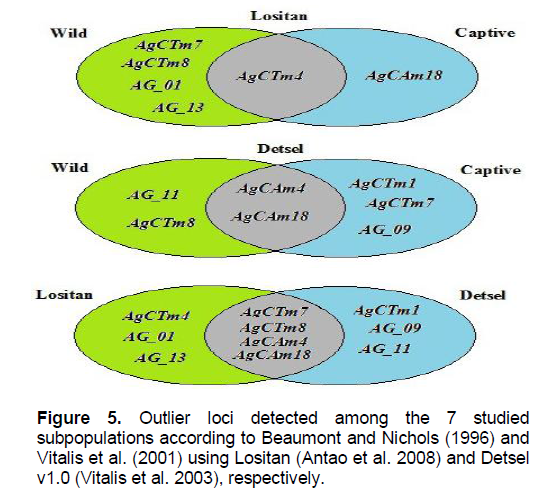
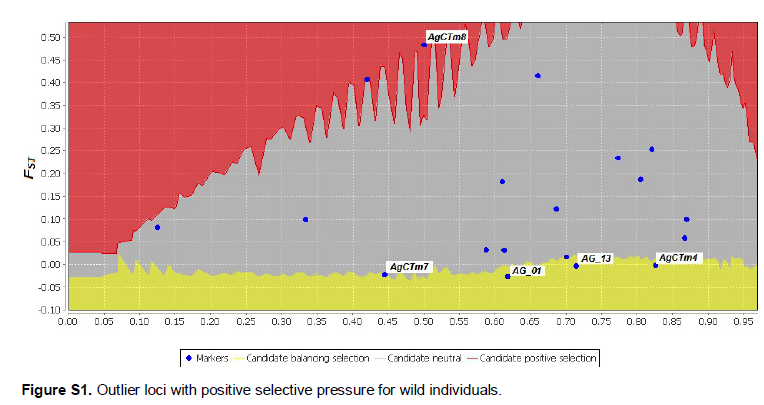
Outlier loci were detected using 2 different approaches. First, a coalescent-based simulation approach was used to identify outlier loci with unusually high and low FST values by comparing the observed FST values with the values expected under neutrality (Beaumont and Nichols, 1996), as implemented in the Lositan selection workbench (Antao et al., 2008). We performed an initial run with 100,000 simulations on all loci using the mean neutral FST as the preliminary value. A more accurate estimate of the mean neutral FST was obtained after the first run by excluding all loci outside the 95% confidence interval because their distribution could result from selection rather than neutral evolution. This refined estimate was used for a final set of 100,000 simulations of all loci. In addition, we used the method described by Vitalis et al. (2001), which investigates outliers in a pairwise fashion based on subpopulation-specific F-statistics. The coalescent simulations were performed with Detsel v1.0 (Vitalis et al., 2003). The null distributions were generated using the following parameters: population size before the split N0 = 500; mutation rate µ = 0.0001 and 0.00001; ancestral population size Ne = 500, 1000 and 10000; time since the bottleneck T0 = 50, 100 and 1000; and time since the population split t = 100. The outliers were determined based on an empirical p value for each locus array of 50 × 50 square cells (Vitalis et al., 2001).
Genetic diversity of wild and captive subpopulations
Summaries of the genetic and allelic diversities of the A. gigas subpopulations are presented in Tables 1 and S1 (Supporting information). We observed the presence of null alleles for loci AG_03 (PPV) and AG_15 (PPV, RDSFB and RDSM). A total of 146 alleles were observed for the 19 microsatellites markers, with an average of 7.68 alleles per locus. The total number of alleles ranged from 49 (2.58 alleles/loci; DNOCS) to 88 (4.63 alleles/loci; SDRM). We also detected the occurrence of 49 private alleles (Table 2), 23 of which had a frequency of greater than 5%. The SDRM (wild) subpopulation showed higher values ??for the mean number of alleles (MNA = 4.632) and allelic richness (AR = 4.258), whereas the group from DNOCS (captive) showed the lowest values (MNA ??= 2.632 and AR = 2.562).
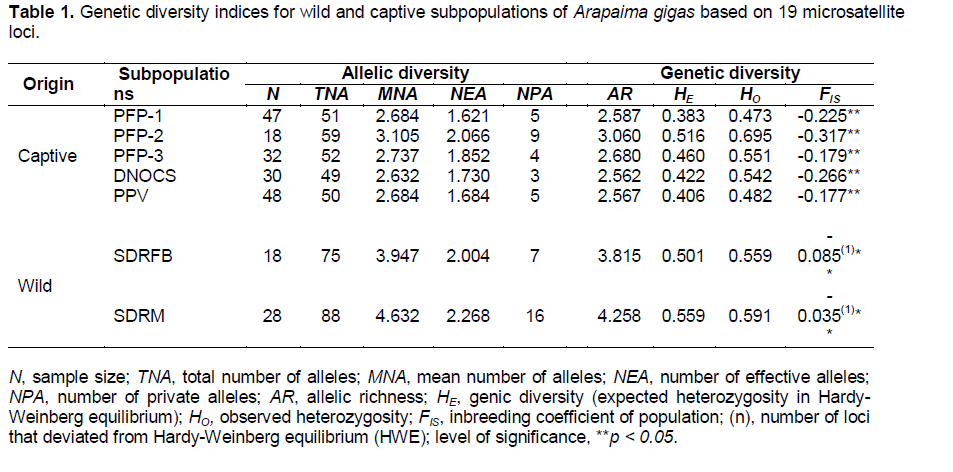
The indices of genetic diversity in this study ranged from 0.473 to 0.695 (HO), 0.383 to 0.559 (HE), 0.198 to 0.848 PIC, and -0.317 to -0.035 (FIS). Of the 19 studied loci, 13 were highly informative (Table 2). However, 6 loci were monomorphic in some subpopulations of A. gigas (Table S1). Only the wild subpopulations had FIS values ??close to 0 (Table 1), indicating that these subpopulations tended to approach Hardy-Weinberg equilibrium (FIS ~ 0; HO ~ HE). The loci AG_09 (RDSFB) and AG_15 (RDSM) significantly deviated from Hardy-Weinberg equilibrium (HWE) (P < 0.05, Bonferroni correction 0.0004). However, we did not detect linkage disequilibrium (LD) for the analyzed pairs of loci (p > 0.05).
Genetic differentiation and population structure
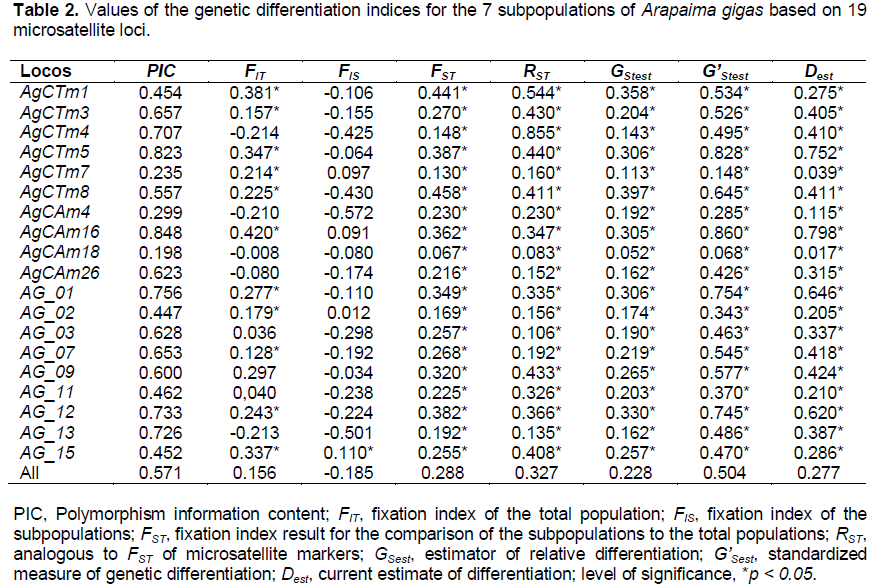
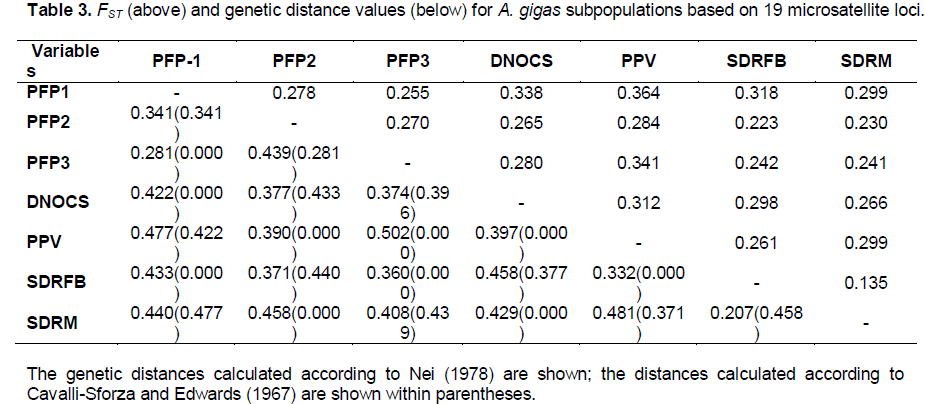
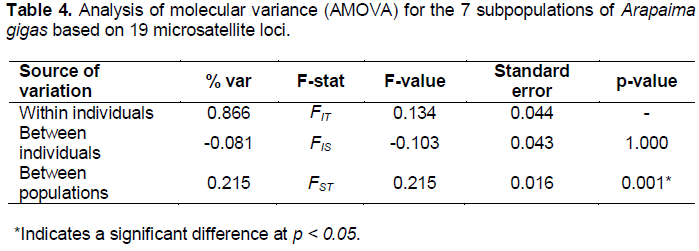
The indices of genetic differentiation (FST, RST, GStest, G'Stest, and Dest) were significant for all examined loci (p < 0.05). The locus AgCAm18 was the only marker that showed low (Dest = 0.017) and moderate (RST = 0.083) genetic differentiation. The average value of FST (0.288) was very close to the GStest (0.228) and Dest (0.277) indices (Table 2). The FST values ??between pairs of A. gigas subpopulations ranged from 0.135 to 0.364, revealing that the level of genetic differentiation between the analyzed pairs varied from high to extremely high (Table 3). The AMOVA revealed that the distribution of genetic variability was 21.5% among the subpopulations and 86.6% among individuals of the subpopulations (Table 4).
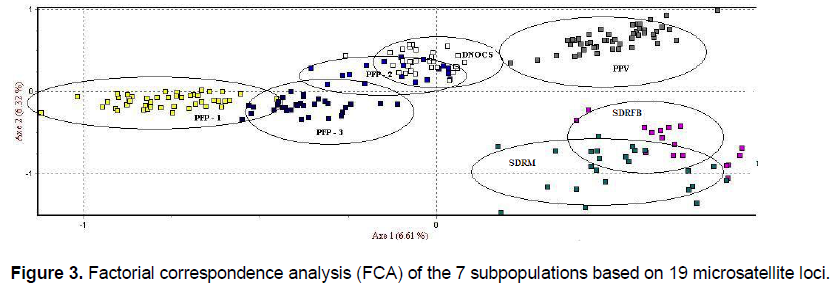
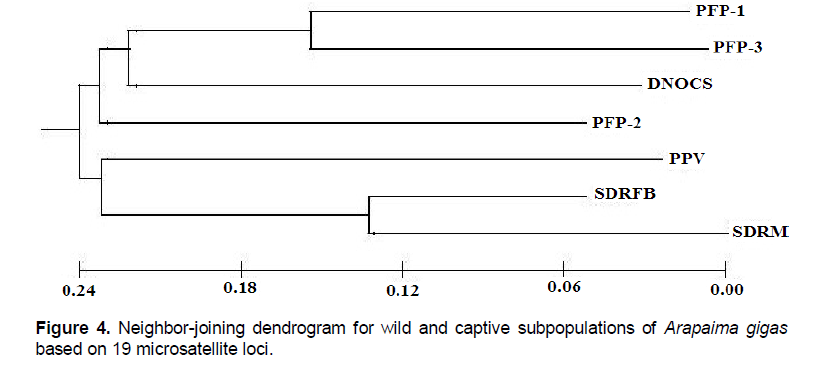
We verified the occurrence of genetic structure among the A. gigas subpopulations with distinct groups (Figure 2); the clusters were based on the data inferred from differences in allelic frequencies. The average association coefficient (q) for each subpopulation (K = 7) showed that the individuals of A. gigas are distributed (Table S2) in specific agglomerations (q > 0.9), resulting in a high-resolution q value and indicating that no subpopulation was mixed. The FCA yielded values of 6.61 and 6.32% ??for Axes 1 and 2, respectively; the dispersion graph of those parts is shown in Figure 3. Notably, there was a clear separation of subpopulations in the wild, with Axis 1 > 0 and Axis 2 < 0, and the formation of two A. gigas populations: one group consisting of the subpopulations PFP-1, PFP-2, PFP-3, and DNOCS (group 1; Axis 1 < 0), and a second group consisting of the PPV, SDRM, and SDRFB subpopulations (group 2, Axis 1 > 0) (Figure 3). The separation of the subpopulations into these two distinct groups by FCA was consistent with the data obtained for the NJ tree based on the genetic distances between the subpopulations (Figure 4).

Bottlenecks and detection of outlier loci (FST-outlier method)
To detect bottlenecks, we eliminated the loci that drifted from Hardy-Weinberg equilibrium because the presence of these loci could strongly influence the final results and because of the effect of selection on the over-dominant loci with an excess of heterozygotes (Luikart and Cornuet, 1998). Furthermore, we verified the minimum number of microsatellite markers needed for an analysis of recent genetic bottlenecks, as the model for mutational markers could influence the final results if an inappropriate number of SSR loci were used.
We detected a recent population bottleneck in all analyzed subpopulations of A. gigas. Both the Sign and Wilcoxon tests showed a significant excess of heterozygotes for the TPM mutational model. However, only the captive subpopulations showed an excess of heterozygotes using the Sign test. The mutational model SMM was significant only for the subpopulations PFP-2 and PFP-3 using the Wilcoxon test.
We observed 10 outlier loci in the A. gigas subpopulations; four of these loci were identified as common to all subpopulations by Lositan and Detsel software (Figure 5), which suggests that these four loci may be related to the local adaptation of A. gigas. The Lositan program identified four outlier loci with balanced selective pressure for the 2 subpopulations of wild and captive specimens. Furthermore, we detected a locus with positive selective pressure for wild individuals, while the remaining loci were considered neutral markers (Figure S1).
Genetic differences between wild and captive subpopulations
According to Ellegren and Sheldon (2008), populations are usually in evolutionary equilibrium; however, evolutionary responses may be hidden due to deterioration or loss of the environment. In addition, the connectivity between populations plays a crucial role in the maintenance of genetic variation, particularly in small populations strongly affected by genetic drift (Broquet et al., 2010). Genetic analyses of 7 subpopulations of A. gigas using 19 microsatellite markers revealed that most of the markers were highly polymorphic, with 13 loci showing values ??of PIC > 0.5 (Table 2). The results also revealed the occurrence of moderate genetic diversity in A. gigas subpopulations, indicating that the evolutionary potential of the wild individuals from the SDR is greater than that of the captive individuals, as expected (Table 1). Hedrick (2001) reported that the pattern of variation within a given variable population generally consists of neutral alleles, that is, the equilibrium is predicted by a reduction of variation through genetic drift and an increase in variation by random mutation. Therefore, even when a population is small, selection may act on the variation in a particular gene, but genetic drift acts more strongly than selection on the allele frequencies.
An excess of heterozygotes was observed in all A. gigas populations (Table 1). We also observed decreased heterozygosity at the AgCAm16 locus in all the domesticated and wild populations, which suggests a recent evolutionary history because this locus is predicted to be under intensive selective pressure. According to Barroso et al. (2005), deficiency in heterozygous loci may occur due to positive selection, improvement of the relatedness between individuals, and population structure. We observed higher allelic richness in wild subpopulations (SDRFB and SDRM) compared to the captive subpopulations; the observed values ??are consistent with those reported by Silva (2008) for individuals of A. gigas in the Jarauá and Maraã lakes (SDRM). Araripe et al. (2013) investigated the wild subpopulations of A. gigas in a large geographical area; based on analyses of 7 informative microsatellite regions, they proposed that the genetic differentiation between subpopulations should increase with increasing geographical distance between them and that the differences among populations separated by geographical distances greater than 1300 km could be caused by historical bottlenecks in population size, in light of the sedentary behavior of the species.
Here, we observed that the average genetic differentiation among all subpopulations (FST) was 21.5% (p < 0.05), demonstrating the high discrimination of the seven studied subpopulations (Figure 2) and the absence of mixtures (Table S2). This genetic differentiation suggests that the captive subpopulations are increasingly isolated due to lack of gene flow between fish farms, which merits further consideration. However, gene flow is also limited between individuals of the wild subpopulations of the SDR. According to Teixeira (2008), A. gigas individuals caught in the wild may not represent the total population because a group may have descended from one pair of individuals. According to Glover et al. (2011), genetic differences have been observed between Atlantic salmon fry in fish sites populated for commercial reproduction from farms of the same company, indicating that the captive environment accelerates genetic differentiation. However, Hedrick (1999) reported that the number of highly polymorphic microsatellite FST might be underestimated and that such an underestimate could influence the observed proportion of heterozygotes in subpopulations compared to the total population. In this context, Hartl and Clark (2010) reported that the estimated F statistic must correct the effects of sampling and the limited number of subpopulations, and suggested that new indices would provide a correction of the values ??of FST.
The recent bottleneck in captive subpopulations is certainly due to the founder effect, which results from the use of a small number of individuals to establish reproductive stocks in fish farms. Furthermore, the lack of allelic richness in captive subpopulations may have contributed to the genetic signature of a new bottleneck (Broquet et al., 2010). These results reinforce the idea that the small number of breeding stations in fish farms may contribute to the genetic deterioration of captive populations.
The bottleneck detected in wild subpopulations is likely due to intense fishing activity in recent years. Furthermore, the practice of selective fishing in the SDR has likely decreased breeding inventories and, subsequently, the effective population size. A decrease in wild fish stocks was reported in the mid-1990s, when the A. gigas production reached 207.5 tons, compared with the previous decade, when production was 1,751 tons (Venturiere and Bernardino, 1999). Luikart and Cornut (1998) reported that natural populations show changes in the frequency of heterozygotes when a stock experiences a recent bottleneck.
We observed that the A. gigas subpopulations are undergoing selection, leading to local adaptation to the new environmental conditions that the species has been recently exposed to (Figure 5). We observed four loci with balanced and positive selection in the wild groups. In the captive groups, we identified two loci with balanced selection. However, when all groups were considered, we observed six loci with positive selection, indicating the existence of local adaptive processes in the wild and captive subpopulations. According to Orr (1998), genotyping many loci is likely important to identify complex adaptive differences between populations. The adaptive complexity provided by genotypic differentiation is directly related to balanced selection, which is common in confined populations but rare in wild populations. Furthermore, balanced selection, which favors heterozygotes, is more frequent than selection favoring homozygotes, thereby maintaining this variation (Amos and Balmford, 2001). The balanced selection of wild A. gigas populations observed in this study is likely due to a recent bottleneck experienced by these subpopulations due to over-fishing.
Local adaptations might be lost through intraspecific hybridization; therefore, actions that increase the amount of genetic exchange among locally adapted populations could be harmful. According to Utter (2004) and Einum and Fleming (1997), the release of individuals from hatcheries or their escape from aquaculture ponds could harm wild populations through intraspecific hybridization and the loss of local adaptations. Nunes et al. (2011) suggested that the identification of loci with adaptive importance is a key step toward understanding the process of speciation in natural populations because these loci are responsible for phenotypic variations that affect the fitness of the species in different environments. According to Sønstebø et al. (2007) and Vasemägi et al. (2005), analysis of the genetic differences between the captive broodstocks and wild populations is also important because the specific genes of each population reflect local adaptability; consequently, the survival of juveniles will be affected if the populations are mixed. Our results indicate that this species requires management and conservation.
Implications for management and conservation
There is a global need to preserve genetic resources by maintaining species and their genetic diversities. The identification of actions that will minimize the effects of genetic changes (or losses) within biological populations is one of the primary mechanisms for maintaining variable and genetically healthy populations (Boettcher et al., 2010). According to He et al. (2012), microsatellite markers, in combination with recent statistical methodologies, represent a useful tool for the conservation and management of endangered species. For A. gigas subpopulations, allelic richness should be maintained and conserved, with a particular focus on preserving the existing rare alleles within populations, as suggested by Pérez-Ruzafa et al. (2006). Genetic information is also needed to aid the understanding of the current level of conservation of endangered species (Laikre et al., 2009).
Conservation projects focusing on the management and conservation of the genetic diversity of endangered species must consider the likely environmental changes (Boettcher et al., 2010) caused by stochastic events or human activity. Our results suggest that subpopulations of A. gigas have had independent evolutionary trajectories, and thus effective conservation measures should focus on preserving the genetic integrity of each subpopulation separately. Therefore, we suggest a more detailed management of breeding groups and periodic monitoring of wild populations.
Hrbek et al. (2005) proposed the use of a large group of matrices of A. gigas (founders) in fish farms, regardless of their geographical origin, thereby minimizing the potential loss of genetic diversity due to founder effects. Furthermore, it has been suggested that confined populations be supplemented with wild individuals from selected areas to maintain high genetic diversity in confinement systems. However, before we consider maintaining or restoring the genetic diversity, we should be alert to individuals collected from nature that served as new breeding on fish farms, as these new breeding, can they bring in parasites from fish farms that might jeopardize the survival of older breeding and consequently reduce the effective size and negatively affect the genetic diversity of these populations.
In addition, we suggest the rotation of A. gigas groups within and between fish farms to maintain the evolutionary potential of the species and avoid greater adaptation to captive systems. A. gigas fingerlings from several wild and captive breeders could also be distributed to fish farmers. However, the formation of closely related couples should be avoided to reduce consanguinity, which could compromise the genetic health of A. gigas lots for future distribution.
The authors thank Prof. Izeni Pires Farias from the Laboratory of Animal Genetics and Evolution (LEGAL/UFAM) for contributions to the original PhD thesis, and LEGAL and the Departamento Nacional de Obras Contra as Secas (DNOCS, CE) for providing A. gigas samples for this work. This work is part of INCT ADAPTA, coordinated by Adalberto Luis Val.
The author(s) have not declared any conflict of interest.
REFERENCES
Agata K, Alassad S, Almeida-Val VMF, Álvarez-Dios JA, Barbisan F, Beadell JS, Beltrán JF, Benítez M, Bino G, Bleay C, Bloor P, Bohlmann J, Booth W, Boscari E, Caccone A, Campos T, Carvalho BM, Clímaco GT, Clobert J, Congiu L, Cowger C, Dias G, Doadrio I, Farias IP, Ferrand N, Freitas FD, Fusco G, Galetti PM, Gallardo-Escárate C, Gaunt MW, Ocampo ZG, Gonçalves H, Gonzales EG, Haye P, Honnay O, Hyseni C, Jacquemyn H, Jowers MJ, Kakezawa A, Kawagushi E, Keeling C, Kwan Y-S, la Spina M, Lee W-O, Lesniewska M, Li Y, Liu H, Liu X, Lopes S, Martínez P, Meeus S, Murray BW, Nunes AG, Okedi LM, Ouma JO, Pardo BG, Parks R, Paula-Silva MN, Pedraza-Lara C, Perera OP, Pino-Querido A, Richard M, Rossini BC, Samarasekera NG, A Sánchez, Sanchez JA, Santos CHA, Shinohara W, Soriguer RC, Sousa ACB, Sousa CFS, Steves VM, Tejedo M, Valenzuela-Bustamante M, van de Vliet MS, Vandepitte K, Vera M, Wandeler P, Wang W, Won Y-J, Yamashiro A, Yamashiro T, Zhu C. Molecular Ecology Resources Primer Development Consortium (2011). Permanent genetic resources added to molecular ecology resources database 1 December 2010 – 31 January 2011. Mol. Ecol. Resour. 11:586-589.
Crossref |
|
|
Amos W, Balmford A (2001). When does conservation genetics matter? Heredity 87:257-265.
Crossref |
|
|
Antao T, Lopes A, Lopes RJ, Beja-Pereira A, G Luikart (2008). LOSITAN: a workbench to detect molecular adaptation based on a FST-outlier method. BMC Bioinformatics 9:323.
Crossref |
|
|
|
Arantes CC, Castello L, Garcez DS (2007). Variações entre contagem de Arapaima gigas (Schinz) (Osteoglossomorpha, Osteoglossidae) feitas por pescadores individualmente em Mamirauá, Brasil. Pan-Am. J. Aquat. Sci. 2(3):263-269. |
|
|
Araripe J, Rêgo PS, Queiroz H, Sampaio I, Schneider H (2013). Dispersal capacity and genetic structure of Arapaima gigas on different geographic scales using microsatellite markers. Plos One 8(1):e54470.
Crossref |
|
|
Barroso RM, Hilsdorf AWS, Moreira HLM, Cabello PH, Traub-Cseko YM (2005). Genetic diversity of wild and cultured populations of Brycon opalinus (Cuvier, 1819) (Characiforme, Characidae, Bryconiae) using microsatellites. Aquaculture 247:51-65.
Crossref |
|
|
Beaumont MA, Nichols RA (1996). Evaluating loci for use in the genetic analysis of population structure. Proc. R. Soc. B 363:1619-1626.
Crossref |
|
|
|
Belkhir K, Borsa P, Chikhi L, Raufaste N, Bonhomme F (2004). GENETIX 4.05, logiciel sous Windows TM pour la génétique des populations. Montpellier, France: Laboratoire Génome, Populations, Interactions, CNRS UMR 5171, Université de Montpellier II. |
|
|
|
Benzecri JP (1973). L'Analyse des donnees. Vol 2: L'Analyse des Correspondances. Paris: Dunod. |
|
|
Boettcher PJ, Tixier-Boichard M, Toro MA, Simianer H, Eding H, Gandini G, Joost S, Garcia D, Coli L, Ajmone-Marsan P, GLOBALDIV Consortium (2010). Objectives, criteria and methods for using molecular genetic data in priority setting for conservation of animal genetic resources. Anim. Genet. 41:64-77.
Crossref |
|
|
Broquet T, Angelone S, Jaquiery J, Joly P, Lena JP, Lengagne T, Plenet S, Luquet E, Perrin N (2010). Genetic bottlenecks driven by population disconnection. Conserv. Biol. 24(6):1596-1605.
Crossref |
|
|
Castello L (2008). Lateral migration of Arapaima gigas in floodplains of the Amazon. Ecol. Freshw. Fish 17:38-46.
Crossref |
|
|
Castello L (2004). A method to count pirarucu: fishers, assessment and management. N. Am. J. Fish Manage 24:379-389.
Crossref |
|
|
Cavalli-Sforza LL, Edwards AWF (1967). Phylogenetic analysis: models and estimation procedures. Am. J. Hum. Genet. 19:233-257.
PMid:6026583 PMCid:PMC1706274 |
|
|
|
Cornuet JM, Luikart G (1996). Description and power analysis of two tests for detecting recent population bottlenecks from allele frequency data. Genetics 144:2001-2014. |
|
|
Crawford NG (2010). SMOGD: software for the measurement of genetic diversity. Mol. Ecol. Res. 10:556-557.
Crossref |
|
|
di Rienzo A, Peterson AC, Garza JC, Valdes AM, Slatkin M, Freimer NB (1994). Mutational processes of simple sequence repeat loci in human populations. Proc. Natl. Acad. Sci. USA 91:3166-3170.
Crossref |
|
|
Earl DA, von Holdt BM (2012). Structure Harvester: a website and program for visualizing structure output and implementing the Evanno method. Conserv. Gen. Res. 4(2):359-361.
Crossref |
|
|
Einum S, Fleming IA (1997). Genetic divergence and interactions in the wild among native, farmed and hybrid Atlantic salmon. J. Fish Biol. 50:634-651.
Crossref |
|
|
Ellegren H, Sheldon BC (2008). Genetic basic of fitness differences in natural populations. Nature 452:169-175.
Crossref |
|
|
Evanno G, Regnaut S, Goudet J (2005). Detecting the number of clusters of individuals using the software structure: a simulation study. Mol. Ecol. 14(8):2611-2620.
Crossref |
|
|
Excoffier L, Lischer HEL (2010). Arlequin suite ver 3.5: a new series of programs to performance populations genetics analyses under Linux and Windows. Mol. Ecol. Res. 10:564-567.
Crossref |
|
|
|
Excoffier L, Slatkin M (1995). Maximum-likelihood estimation of molecular haplotype frequencies in a diploid population. Mol. Biol. Evol. 12:921-927. |
|
|
|
Falush D, Stephens M, Pritchard JK (2003). Inference of population structure using multilocus genotype data: linked loci and correlated allele frequencies. Genetics 164:1567-1587. |
|
|
Farias IP, Hrbek T, Brinkmann H, Sampaio I, Meyer A (2003). Characterization and isolation of DNA microsatellite primers for Arapaima gigas, an economically important but severely over-exploited fish species of the Amazon basin. Mol. Ecol. Notes 3:128-130.
Crossref |
|
|
|
|
|
Goudet J (2001). FSTAT, a program to estimate and test gene diversities and fixation indices (version 2.9.3.2). Updated from Goudet J (1995) FSTAT version 1.2: a computer program to calculate F-statistics. J. Hered. 86:485-486. |
|
|
|
Goulding M (1980). The fishes and the forest. Los Angeles, CA, USA: University of California Press. P. 200. |
|
|
Glover KA, Skaala Ø, Søvik AGE, TA Helle (2011). Genetic differentiation among Atlantic salmon reared in sea-cages reveals a non-random distribution of genetic material from a breeding programme to commercial production. Aquac. Res. 42:1323-1331.
Crossref |
|
|
|
Hartl DL, Clark AG (2010). Princípios de genética de populações, 4th Edition. Porto Alegre: Artmed. P. 660. |
|
|
He L, Xie Y-N, Lu W, Wang Y, Chen L-L, Mather PB, Zhao Y-L, Wang Y-P, Wang Q (2012). Genetic diversity in three redclaw crayfish (Cherax quadricarinatus, von Martens) lines developed in culture in China. Aquac. Res. 43:75-83.
Crossref |
|
|
Hedrick PW (2005). A standardized genetic differentiation measure. Evolution 59:1633-1638.
Crossref |
|
|
|
|
Hedrick PW (2001). Conservation genetics: where are we now? Trends Ecol. Evol. 16(11):629-636.
Crossref |
|
|
Hedrick PW (1999). Perspective: highly variable loci and their interpretation in evolution and conservation. Evolution 53:313-318.
Crossref |
|
|
Hrbek T, Farias IP, Crossa M, Sampaio I, Porto JIR, Meyer A (2005). Population genetic analysis of Arapaima gigas, one of the largest freshwater fishes of the Amazon basic: implications for its conservation. Anim. Conserv. 8:297-308.
Crossref |
|
|
Jost L (2008). GST and its relatives do not measure differentiation. Mol. Ecol. 17(18):4015-4026.
Crossref |
|
|
|
|
Kalinowski ST, Taper ML, Marshall TC (2007). Revising how the computer program CERVUS accommodates genotyping error increases success in paternity assignment. Mol. Ecol. 16:1099-1106.
Crossref |
|
|
|
Kimura M, Crow J (1964). The number of alleles that can be maintained in a finite population. Genetics 49:725-738. |
|
|
Kimura M, Otha T (1978). Stepwise mutation model and distribution of allelic frequencies in a finite population. Proc. Natl. Acad. Sci. USA 75:2868-2872.
Crossref |
|
|
Laikre L, Nilsson T, Primmer CR, Ryman N, Allendorf FW (2009). Importance of genetics in the interpretation of favourable conservation status. Conserv. Biol. 23(6):1378-1381.
Crossref |
|
|
|
Lewis PO, Zaykin D (2000). Genetic Data Analysis: computer program for the analysis of allelic Data, Version 1.0. (d15). Storrs, CT: University of Connecticut. |
|
|
Luikart G, Cornut JM (1998). Empirical evaluation of a test for identifying recently bottlenecked populations from allele frequency data. Conserv. Biol. 12:228-237.
Crossref |
|
|
|
Nei M (1978). Estimation of average heterozigosity and genetic distance from a small number of individuals. Genetics 89: 583-590. |
|
|
Nei M, Chesser RK (1983). Estimation of fixation indices and gene diversities. Ann. Hum. Genet. 47(3):253-259.
Crossref |
|
|
Nunes VL, Beaumont MA, Butlin RK, Paulo OS (2011). Multiple approaches to detect outlier in a genome scan for selection in ocellated lizards (Lacerta lepida) along an environmental gradient. Mol. Ecol. 20:193-205.
Crossref |
|
|
Oliveira V, Poleto SL, Venere PC (2005). Feeding of juvenile pirarucu (Arapaima gigas, Arapaimidae) in their natural environment, lago Quarto Bocas, Araguaiana – MT, Brazil. Neotrop Ichthyol 3(2):312-314.
Crossref |
|
|
Orr HA (1998). The population genetics of adaptation: the distribuition of factors fixed during adaptive evolution. Evolution 52:935-949.
Crossref |
|
|
|
Ortiz WS, Salcedo RDL, Ruíz LC, Macías JNL (2007). Potencial acuícola de pirarucu (Arapaima gigas) em la cueca Amazónica. Rev. Elect. Ing. Prod. Acuíc. 2:75-83. |
|
|
Pérez-Ruzafa A, González-Wangüemert M, Lenfant P, Marcos C, García-Charton JA (2006). Effects of fishing protection on the genetic structure of fish populations. Biol. Conserv. 129:244-255.
Crossref |
|
|
Piry S, Luikart G, Cornuet JM (1999). Bottleneck: a computer program for detecting recent reductions in the effective population size using allele frequency data. J. Hered. 90:502-503.
Crossref |
|
|
|
Pritchard JK, Stephens M, Donnelly P (2000). Inference of population structure using multilocus genotype data. Genetics 155:945-959. |
|
|
|
Pullin RSV (2007). Genetic resources for aquaculture: status and trends. In: Bartley DM, Harvey BJ, Pullin RSV (editors). Workshop on status and trends in aquatic genetic resources: A basic for international policy: 8-10 May 2006, Victoria, British Columbia, Canada. Rome: Food & Agriculture Org. |
|
|
Rice WR (1989). Analyzing tables of statistical tests. Evolution 43:223-225.
Crossref |
|
|
|
Sambrook J, Fritsch EF, Maniatis T (1989). Molecular cloning: a laboratory manual, 2nd ed. Cold Spring Harbor, NY: Cold Spring Harbor Laboratory. |
|
|
Santos CHA, Leitão MAB, Sousa CFS, Santana GX, Paula-Silva MN, Almeida-Val VMF (2012). Genetic variability of wild and captivity populations of Colossoma macropomum (Cuvier, 1818). Acta Sci. Biol. Sci. 34(2):191-197.
Crossref |
|
|
|
Silva JAG (2008). Genética de populações de pirarucus (Arapaima gigas) da Reserva de Mamirauá e considerações sobre a estrutura genética para a espécie. Tese (Doutorado em Zoologia) 101. Belém, Brasil: Museu Paraense Emilio Goeldi, Universidade Federal do Pará. |
|
|
|
Slatkin MA (1995). A measure of population subdivision based on microsatellite allele frequencies. Genetics 130:457-462. |
|
|
Sønstebø JH, Borgstrøm R, Heun M (2007). Genetic structure of brwn trout (Salmo trutta L.) from the Hardangervidda mountain plateau (Norway) analyzed by microsatellite DNA: a basic for conservation guidelines. Conserv. Gen. 8:33-44.
Crossref |
|
|
Stewart DJ (2013a). A new species of Arapaima (Osteoglossomorpha: Osteoglossidae) from the Solimões river, Amazonas State, Brazil. Copeia 3:470-476.
Crossref |
|
|
Stewart DJ (2013b). Re-escription of Arapaima agassizzi (Valenciennes), a rare fish from Brazil (Osteoglossomorpha: Osteoglossidae). Copeia 1:38-51.
Crossref |
|
|
Teixeira AS (2008). The monotony of transferrin and esterase electrophoretic patterns in pirarucu, Arapaima gigas (Schinz, 1822) from Santa Cruz lake, Tefé River, Amazonas, Brazil. Genet. Mol. Res. 7(2):407-416.
Crossref |
|
|
Utter F (2004). Population genetics, conservation and evolution in salmonids and other widely cultured fish; some perspectives over six decades. Rev. Fish. Biol. Fisheries 14:125-144.
Crossref |
|
|
|
|
van Oosterhout C, Hutchinson WF, Wills DPM, Shipley P (2004). Micro-Checker: software for identifying and correcting genotyping errors in microsatellite data. Mol. Ecol. Notes 4:535-538.
Crossref |
|
|
|
|
Vasemägi A, Cross R, Paaver T, Koljonen ML, Nilsson J (2005). Extensive immigration from compensatory hatchery releases into wild Atlantic salmon population in the Baltic sea: spatio-temporal analysis over 18 year. Heredity 95:76-83.
Crossref |
|
|
|
Venturiere R, Bernardino G (1999). Pirarucu, espécie ameaçada pode ser salva através do cultivo. Rev. Panor. Aquic. 9:13-21. |
|
|
|
Viana JP, Castello L, Damasceno JMB, Amaral ESR, Estupi-án GMB, Arantes C, Batista GS, Garces DS, Barbosa S (2007). Manejo comunitário do pirarucu Arapaima gigas na Reserva de Desenvolvimento Sustentável de Mamirauá, Amazonas, Brasil. In: Áreas protegidas como instrumento de gestão pesqueira. Brasília MMA. pp. 239-261. |
|
|
Vitalis R, Dawson K, Boursot P, Belkhir K (2003). DetSel 1.0: a computer program to detect markers responding to selection. J. Hered. 94(5):429-431.
Crossref |
|
|
|
Vitalis R, Dawson K, Boursot P (2001). Interpretation the heterogeneity of F values: a suggestion and a correction. Genetics 84:399-401. |
|
|
Wasko AP, Martins C, Oliveira C, Senhorini JA, Foresti F (2004). Genetic monitoring of the Amazonian fish matrinchã (Brycon cephalus) using RAPD markers: insights into supporting and conservation programmes. J. Appl. Ichthyol. 20:48-52.
Crossref |
|
|
|
|
Weir BS, Cockerham CC (1984). Estimating F statistics for the analysis of population structure. Evolution 38:1358-1370.
Crossref |