ABSTRACT
Due to an increased usage of college counseling centers in the treatment of mental health concerns, it is imperative that centers implement appropriate assessments of psychological symptoms. We examined the Counseling Center Assessment of Psychological Symptoms (CCAPS), which was designed as a routine instrument to assess a range of mental health symptoms. Proper assessment and reporting of reliability are essential before one can meaningfully interpret assessment outcomes. This study employed a meta-analytic technique, Reliability Generalization (RG), to examine reporting practices, and analyze the reported CCAPS reliability estimates. Additionally, reported CCAPS reliability estimates were analyzed in order to assess diversity variables, which can affect the measurement of psychological symptoms and distress. Only 22% (N = 12) of the 54 total research studies reported reliability estimates for the CCAPS. Most studies cited a previous source and others simply noted that the measure was “reliable” (66%; N = 25). More information is needed for subscale reliability since the current CCAPS Cronbach’s alphas ranged from fair to excellent (> 0.60 - > 0.80). An increase in reliability reporting is needed to examine the CCAPS’ use in various sample populations. Implications for reliability reporting standards are discussed.
Key words: Reliability Generalization, Counseling Center Assessment of Psychological Symptoms (CCAPS), reliability reporting, meta-analysis.
College and university counseling centers worldwide serve thousands of students annually. Counseling centers have made significant changes over time to meet the growing demand for support. It was at Princeton University, in 1910, that the first established mental health services for US students became available (Barreira and Snider, 2010; Kraft, 2011). Princeton University, as well as the universities and colleges to follow, were all heavily influenced by the “mental hygiene” movement, which began in 1909 (Barreira and Snider, 2010; Kraft, 2011). Bridges (1928) defined the mental hygiene movement as being “concerned with the prevention of mental disease, mental defect, delinquency, and the many milder forms of social maladjustment and inefficiency which are the sources of so much unhappiness and discontent” (p.1). Although the mental hygiene movement was pivotal in moving college mental health treatment forward, actual on-campus counseling centers were quite rare. University and college counseling centers became more common on college campuses in the 1940s (Barreira and Snider, 2010). The aims of these counseling centers followed suit with the goals of the mental hygiene movement, which was highly focused on primary (e.g., awareness, education, and outreach) and secondary (e.g., intakes, assessment, triage, screenings, and brief therapies) forms of intervention and prevention rather than tertiary interventions (e.g., crisis services, group therapies, inpatient care, and long-term therapies). Since the inception of university and college counseling centers, the goals at the outset have been to provide prevention-based mental health education and basic mental health care with the intended goals for students to include academic and vocational success.
Due to the increased utilization and subsequent rapid growth of college counseling centers over the years, it has become evident that university and college counseling centers’ goals have changed from merely addressing basic mental health concerns and academic achievement to addressing more acute complex mental health concerns and pathology (Eichler and Schwartz, 2010; Lipson et al., 2015; Oswalt et al., 2020). For example, Lipson et al. (2015) reported “roughly one-third of undergraduates exhibit significant symptoms of a mental health problem, such as depression, generalized anxiety, or suicidality” (p. 388). Lipson and colleagues’ (2015) study on college students’ mental health utilized a large sample that consisted of 43,210 undergraduates from 72 US colleges and universities. In this study, utilizing the Patient Health Questionnaire – 9 (PHQ-9) (Kroenke and Spitzer, 2002; Kroenke et al., 2001) and the Generalized Anxiety Disorder scale – 7 (GAD-7) (Spitzer et al., 2006), results revealed that 18.2 and 10.1% of the population had a positive screen for depression and anxiety, respectively. The study also revealed that 7.8% endorsed thoughts of suicide and 16.5% engaged in non-suicidal self-injury (Lipson et al., 2015). Recent research has shown that suicide ranks as the second most common cause of mortality in college students behind accidental injury (Turner et al., 2013).
A recent report published by the American Psychological Association entitled Stress in America: Generation Z (2018) highlighted results from APA’s twelfth annual survey aimed at better understanding the sources of stress in individuals’ lives as well as strategies for coping with stress. Findings from the survey indicate that Generation Z’s (that is, those born between the mid 1990’s and 2000’s) average reported stress level (5.3) was higher than the overall average, with Millennials (those born between the early 1980’s and mid-1990’s) reported the highest average (5.7), and Generation X (those born between the early to mid-1960’s and early to mid-1980’s) reported 5.1 (on a scale from 1 to 10, where
“1” is “little or no stress” and “10” is “a great deal of stress”). Conversely, Boomers (those born between 1946 and 1964) reported stress levels well below the average (4.1) as did older adults (3.3). Results from the survey focused on individuals from Generation Z, especially those between the ages of 15 and 21. Results indicate that individuals from Generation Z were more likely to report their mental health to be fair or poor. Millennials and those from Generation X similarly reported fair or poor mental health, whereas less than one in ten Boomers and one in five older adults considered their mental health as fair or poor. Interestingly, Generation Z individuals reported they received treatment or therapy from a psychologist or other mental health professional or were currently receiving treatment (37%). In addition, Generation Z adults, aged 18 to 21, indicated they experienced stress in the form of depression or sadness (58%), lack of interest, motivation, or energy (55%), or feeling anxious (54%). Generation Z individuals also reported lying awake at night due to stress (68%) or eating too much or eating unhealthy foods (58%). In this report (APA, 2018), it was clear that younger generations were significantly more likely to have received treatment with more than one-third of Generation Z (37%) and Millennials (35%) reporting they had received such help, and are most representative of today’s college populations.
Many campus counseling centers are in high demand due to the aforementioned increase in students seeking mental health treatment. As a result, a majority of counseling centers have adopted session limits or stepped-care models with students. Given that treatment in college counseling centers is most often brief, appropriate assessment of psychological symptoms must be reliable, accurate, and succinct. Oswalt et al. (2020) suggest that centers may need to adjust their standard practice to incorporate brief screening programs as part of treatment in order to better assess students’ mental health concerns. Brief screenings in mental health treatment have been shown to help with diagnostic clarification, treatment planning, and therapeutic outcomes (Groth-Marnat and Wright, 2009). Therefore, using a brief instrument that measures college students’ psychological symptoms accurately is of paramount importance.
Counseling center assessment of psychological symptoms (CCAPS)
The current literature surrounding measures tailored specifically to assessing college students’ psychological symptoms is quite sparse. A review of the literature indicates that the Counseling Center Assessment of Psychological Symptoms (CCAPS; Locke et al., 2011) is one of the most commonly used measures in studies assessing college students’ psychological symptoms and, as such, is the primary focus of this study. The CCAPS was developed at the University of Michigan in 2001 and has since been translated from English into five different languages (that is, Simplified Chinese, Traditional Chinese, Japanese, Thai, and Spanish). The CCAPS was most recently normed on a sample of 448,904 students seeking counseling services at various colleges and universities across the United States (Center for Collegiate Mental Health, 2019).
The CCAPS has a 62 – item and an abbreviated 34 – item version. On both versions of the instrument, students are asked to rate items on a Likert-type scale with a range of 0 “not at all like me” to 4 “extremely like me” (Locke et al., 2011). The CCAPS – 62 has a total of eight subscales that measure domains including Depression, Generalized Anxiety, Social Anxiety, Academic Distress, Eating Concerns, Family Distress, Hostility, and Substance Use. The 62 – item version also has a Distress Index which is a global measurement of a student’s overall psychological distress. Locke et al. (2011) found that the CCAPS – 62 demonstrated strong convergent validity as evidenced by significant correlations between the subscales and their associated referent measures (i.e., Depression and Beck Depression Inventory; Generalized Anxiety and Beck Anxiety Inventory; Social Anxiety and Social Phobia Diagnostic Questionnaire; Academic Distress and Student Adaptation to College Questionnaire; Eating Concerns and Eating Attitudes Test; Substance Use and Alcohol Use Disorders Identification Test; Hostility and State - Trait Anger Expression Inventory - 2; Family Distress and Self-Report Family Inventory). The initial alpha coefficients established by Locke et al. (2011) were 0.781 for Academic Distress, 0.811 for Family Distress, 0.823 for Social Anxiety, 0.846 for Generalized Anxiety, 0.853 for Substance Use, 0.863 for Hostility, 0.883 for Eating Concerns, and 0.913 for Depression, which ranged from acceptable to very good. In a sample of participants within the United Kingdom, Broglia et al. (2017) reported “good” reliability estimates ranging from a = 0.81 - 0.89 for all subscales. Meanwhile, Ratanasiripong et al. (2015) conducted research translating the CCAPS into a Thai version and reported reliability estimates for the total CCAPS a = 0.91, and subscales ranging from a = 0.66 - 0.87.
The CCAPS – 34 has a total of seven subscales that measure domains including Depression, Generalized Anxiety, Social Anxiety, Academic Distress, Eating Concerns, Hostility, and Alcohol Use (Locke et al., 2012). The 34 – item version also has a Distress Index. However, the CCAPS – 34 discarded the Family Distress subscale and also re-named the Substance Abuse subscale to Alcohol Use, as all items in this subscale are concerned solely with alcohol use. During the development and validation of the CCAPS – 34, researchers utilized the same referent measures as they did when testing convergent validity of the CCAPS – 62. Results revealed similar findings in that all subscales had significant correlations with their referent measure, thus revealing adequate convergent validity (Locke et al., 2012). Internal consistency for each subscale established by Locke et al. (2012) was 0.760 for Academic Distress, 0.796 for Social Anxiety, 0.820 for Generalized Anxiety, 0.854 for Hostility, 0.869 for Alcohol Use, 0.871 for Eating Concerns, and 0.892 for Depression, and ranged from acceptable to good.
Both the CCAPS – 34 and the CCAPS – 62 assess for suicidal ideation and homicidal ideation. This is assessed with one item on both instruments using a Likert – type scale with a range from 0 “not at all like me” to 4 “extremely like me,” to provide both quantitative and qualitative data to assist in capturing potential, and degree of, suicidal ideation and homicidal ideation. Consequently, a 2018 update removed the term homicidal ideation and this was replaced with “thoughts of hurting others” in order to reflect the actual content and questions asked on the instrument. The CCAPS measure is currently available for use within any college and counseling center that employs either the Titanium Schedule (Titanium Software, 2020) electronic records system or other electronic records systems.
Reliability reporting and reliability generalization
A current challenge in published research centers on reliability analysis and reporting. All too often researchers report reliability incorrectly, if at all (Vacha-Haase and Thompson, 2011). Publications frequently present previous sources of reliability estimates as if these estimates are confirmations of reliability and omit the presentation of a reliability estimate for their own sample. This “induction” of reliability has led to reduced reporting practices and limited the potential volume of information about self-report measures as they are applied to individuals across studies. This also leads to a false inference that a measure is reliable, when in fact internal consistency is based on the individual taking a measure. Since a reliability coefficient is affected by the characteristics of the individuals completing assessment measures (Vacha-Haase, 1998), it is essential for researchers to report reliability coefficients for their study samples (Wilkinson, 1999). Reliability coefficients provide useful information about the calculated internal consistency when self-report measures are used with diverse samples. In psychometrics, a threat to reliability and generalizability in studies is both the homogeneity and heterogeneity of samples in characteristics such as education, age, or mental health status.
Reliability generalization (RG) was initially developed by Tammy Vacha-Haase (1998) and is a form of meta-analysis. RG is a technique that can be used to examine reliability estimates and identify the sources of variance (Vacha-Haase et al., 2002). An initial step in the RG process is conducting a thorough and exhaustive search for all available publications (e.g., books, chapters, dissertations, and journal articles) which have employed a particular measure in their study. Next, the publication studies are assessed to determine whether or not they have reported reliability coefficients based on their sample. Zedeck (2014) defined a reliability coefficient as a value that represents the consistency of scores which occur across varied circumstances, such as different points in time. The reliability coefficient’s value yields an estimate that typically ranges from 0 to 1, and this value is reflective of the obtained score variance and considered true variance, not error (Zedeck, 2014).
When statistically analyzing internal consistency for a study sample, varying forms of reliability coefficients exist. Cronbach’s (1951) alpha is one of the most commonly reported reliability coefficients and was selected for use in this study. As with many meta-analyses, an initial presenting challenge in conducting RG research is acquiring enough studies reporting reliability coefficients based upon their study sample. Subsequently, as each study may vary in the scope and detail of information it provides the reader regarding the measurement and sample characteristics, coding information regarding the demographics of the sample can also present a challenge.
The overall goal of meta-analysis is to review the existing information across articles to determine any patterns present (Borenstein et al., 2009). Specifically, meta-analytic research empirically summarizes all available literature on a particular topic, or in this case, a measure, in order to synthesize and present information. RGs can be conducted with a varying number of studies. Depending on the purpose, some meta-analyses have been conducted with as few as two studies. Meta-analysis is considered secondary research, and therefore, is limited by the available primary research that has been conducted. Previous RG studies using scales such as the Beck Scale of Suicidal Ideation (BSSI) have been conducted with just 12 studies (King et al., 2014). Despite the fact that small sample sizes may occur in RGs, the purpose is to provide a current summary of what reliability information is available in literature from primary research. Thus, results reported reflect the current state of the literature and reporting practices.
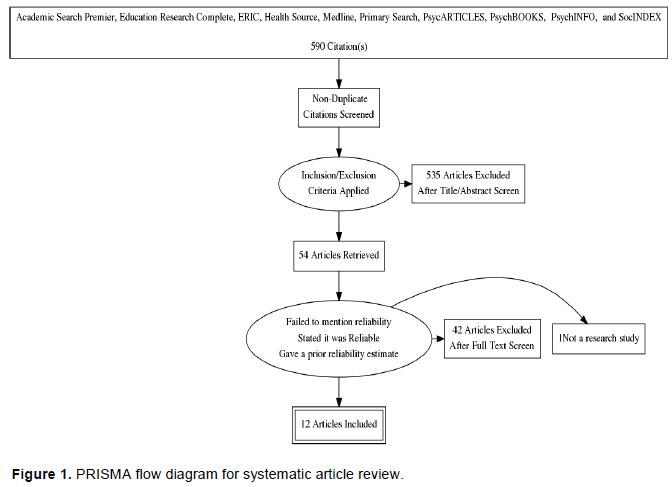
The term Counseling Center Assessment of Psychological Symptoms and its acronym “CCAPS” were searched in multiple databases including Academic Search Premier, Education Research Complete, ERIC, Health Source, Medline, Primary Search, PsycARTICLES, PsychBOOKS, PsychINFO, and SocINDEX, for studies published from the scales’ inception in 2010 to the present. Initial search results yielded 590 possible sources. Unfortunately, many of these references pertained to another measure with the same CCAPS acronym, and had to be excluded from this study. Overall, there were 55 sources found directly related to the CCAPS. Among these, one was excluded in the present study as it was not a research study. All sources were able to be located and all were written in English. A total of 54 studies that reported the use of the CCAPS were included in this RG.
The 54 articles were assessed by an initial coder and then sorted into one of four assigned categories. The first category was reserved for those articles which used the CCAPS, but failed to mention the psychometric property of reliability in any form (n = 16, 29.6%). The second category contained studies that purported the instrument was reliable and/or presented the issue of reliability in some form but made no mention of a reliability estimate from either the authors’ own data (that is, based on the individuals in their study), or from a previous source which employed the CCAPS (n = 5, 1%). In the third category were articles which used the CCAPS in their study, yet only presented reliability coefficients based on samples in previous studies (n = 19, 35%). The final category contained studies that used the CCAPS and reported a reliability coefficient based upon data collected in their current study (n = 12, 22%). For the purpose of this RG, only articles in this final category were included in the analysis of reliability coefficients for the CCAPS (Figure 1).
The current RG reviews Cronbach’s (1951) alpha reliability coefficients, although different types of reliability coefficients may be used to estimate the reliability of a set of scores, such as spilt-half reliability estimate coefficients (Yin and Fan, 2000). Cronbach’s (1951) alpha coefficients are a classic method for reliability investigations (Geisinger, 2013), a more commonly reported form of reliability (Hogan et al., 2000; Streiner, 2003), and are especially referred to in RG analyses. Consequently, one study reporting reliability in another form was omitted from the final analysis (Ghosh et al., 2018). When Cronbach’s (1951) alpha data is reported in ranges it is not utilizable in the RG process. None of the studies provided alphas in ranges, which allowed for use of all alphas reported.
Interpreting Cronbach’s (1951) alpha is typically based on ranges. Cronbach’s (1951) alpha internal consistency reliability estimates can range from a value of zero (0) to 1.00, though there is some contention about whether or not it fully possesses an upper or lower limit (Streiner, 2003; Vaske et al., 2017). Reliability estimates can be interpreted using a variety of proposed value ranges. The recommendations proposed by Nunnally and Bernstein (1994) suggested coefficients greater than 0.70 are acceptable, and cautioned against values much greater than a = 0.80, to be used as appropriate guidelines for interpreting typical research outcomes (Nunnally, 1978). Nunnally (1978) also expressed initial caution against alpha values much greater than 0.80, in terms of test-item construction, as he assumed some redundancy and, consequently, some artificial inflation in calculated reliability estimates. However, he recommended that in settings where key decisions are made based on the outcomes interpreted, alphas of 0.90 - 0.95 would be more appropriate (Nunnally, 1978).
Additional guidelines are provided by George and Mallery (2003) where “> 0.9 – Excellent, > 0.8 – Good, > 0.7 – Acceptable, > 0.6 – Questionable, > 0.5 – Poor, and < 0.5 – Unacceptable” (Nunnally, 1978, p. 231). While there is variation among researchers in the interpretation of ranges of alpha values, it is generally acknowledged that values over 0.80 are representative of an acceptable range (Webb et al., 2006). Cronbach’s (1951) alpha estimates close to 1.00 have been criticized as indicating replication or redundancy within a scale. It is noted that alpha coefficients above 0.95 are not necessarily desirable as it would indicate item redundancy on a scale (Panayides, 2013; Streiner, 2003), as such values higher than a = 0.95 may be viewed with caution.
Coding method
A uniform coding sheet was created to document and summarize the relevant information and variables of interest for each of the 12 articles (see Appendix A). Each study used in this RG was coded by an initial coder to assess details of the study and subsequently blind-coded by a second coder. Each study was reviewed for coding accuracy and any discrepancies were discussed and resolved prior to final data entry. Some of the continuous variables coded included publication year, total reliability scores/coefficients, subscale total reliability score/coefficients, sample size, sex of study participants (coded as both the sample number as well as the percentage of males and females within the study), mean age, standard deviation of age, mean CCAPS scores, standard deviation of CCAPS scores, and means for CCAPS subscale total scores. In addition, certain sample and measurement characteristics were categorically coded as follows:
(i) Race/Ethnicity: 1 = Predominantly Caucasian or 2 = Predominantly Non-Caucasian
(ii) Education: 1 = In Undergraduate Studies, 2 = Completed Undergraduate Studies, 3 = In Graduate School, 4 = Completed Graduate School, 5 = Greater than 50% of the Sample Completed Some College, 6 = Other Education Levels (with space for qualitative entry), or 99 = Unknown
(iii) Sample Type: 1 = Inpatient, 2 = Outpatient, 3 = Non-Clinical, or 4 = Other
(iv) Sample Location: 1 = Within the US, or 2 = Countries Outside the US
(v) Sampling Procedure: 1 = Random, 2 = Purposeful, 3 = Convenience, 4 = Other (with space for qualitative entry), or 99 = Unknown
(vi) Sample Measurement: 1 = Pre/Post or 2 = Multi-Measure (over
X sessions ________)
(vii) Version of the CCAPS: 1 = The 62 - item version, 2 = The
34 - item version, 3 = Other item version/Number of Items, or 4 = Both the 34 - and 62 - item versions.
Coding sheets were completed and then scanned and saved electronically. Copies of all applicable articles were kept electronically. Data were initially entered into a Microsoft Excel datasheet and then imported into the Statistical Package for Social Sciences (SPSS) for statistical analyses.
Interrater reliability
Interrater reliability was calculated among the three coders in this study. Each of the coders is a licensed psychologist with a history of training in meta-analysis methodology and was experienced in conducting RGs. Calculated percent agreement between coders was 88.87%. Interrater reliability was excellent indicating that coders were in alignment with one another on RG coding elements for this study.
Studies reviewed within this RG were predominantly based on published peer-reviewed journal articles with the inclusion of one dissertation (see Appendix B). There were no book chapters included in the analysis. Reliability reporting practices for studies employing the CCAPS were low. Of the research reviewed, 38 studies mentioned reliability in some way, and among them, a total of 24 did not report their own reliability (63.16%). For those not reporting their own reliability, half (50%) cited a previous source (n = 19), while 13% stated it was “reliable” (n = 5). One study (n = 1; 3%) cited a different type of reliability (RCI; Ghosh et al. (2018) wherein the researchers used the original 62-item version. The authors calculated Reliability Confidence Index (RCI) subscale values ranging from 0.71 (Substance Use) to 1.16 (Academic Distress; Ghosh et al., 2018). Overall, a total of 12 studies provided 13 Cronbach’s (1951) alphas calculated based upon the study sample of individuals representing a total of 27,237 participants were analyzed in this RG.
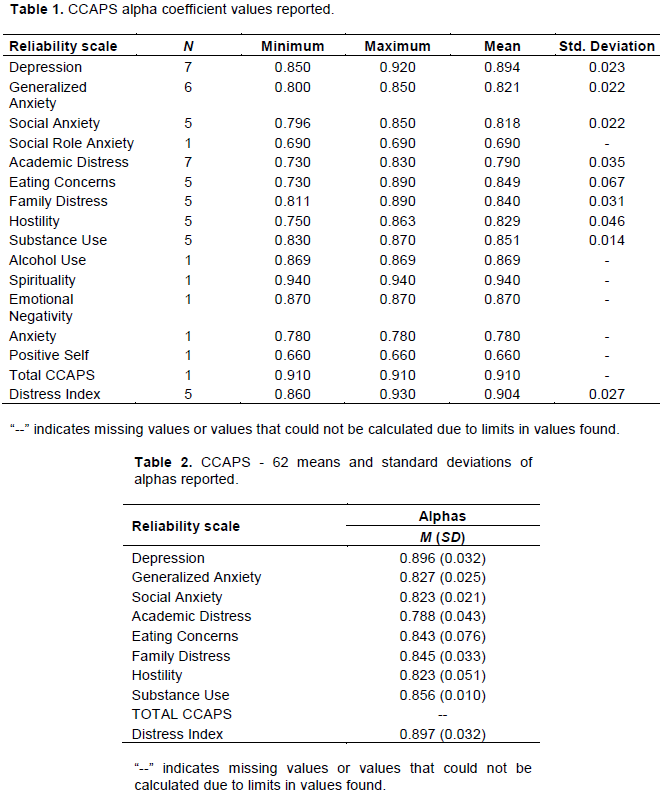
Those studies using both the original CCAPS 62 – item scale, or the 34 - item scale, reported Cronbach’s (1951) alphas which ranged from good to excellent (Minimum a = 0.730; Academic Distress and Eating Concerns, Maximum a = 0.920; Depression). Only one study provided information regarding Cronbach’s (1951) alpha for the Total CCAPS which was in the excellent range (a = 0.930); interestingly, this study was a validation study of a Thai version of the CCAPS 62 – item instrument (Ratanasiripong et al., 2015). One study reported their own subscales devised as a part of their investigation; reported alphas for this study ranged from 0.660 - 0.940. Table 1 provides a summary of reliability estimates reported for all versions of the CCAPS found within this study.
Examining internal consistency estimates calculated for studies reporting Cronbach’s (1951) alpha values were robust for the subscales of the 62 – item scale, with mean alpha values no less than 0.788 (M a R = 0.788 - 0.896). One study which used the 34 – item version reported alphas for the Distress Index for the 62 – item version and the 34 – item version, when combined, were in the good to excellent range (M a = 0.876, M a = 0.915, respectively). Table 2 gives a summary of mean alphas and standard deviations of alphas reported for the 62 – item version compared with the initial 62 – item validation study (Locke et al., 2011). Unfortunately, due to low reliability reporting in studies using the 34 – item version, data for this version were not available to present in Table 2. Additionally, there were no reported Cronbach’s (1951) values available for the total CCAPS scale to assess and report.
The CCAPS 34 – item version was not well represented in this RG study as there was only one study which employed this version whose authors calculated and reported alphas for their sample (Locke et al., 2012). The sole study by Locke et al. (2012) reported alphas from a = 0.760 (Academic Distress) - 0.896 (Depression). No meaningful data analysis could be conducted based on the 34 – item version due to the lack of reliability reporting in published studies. The CCAPS Distress Index is often utilized as a general measure of college distress endorsed by the individual. In this analysis, the Distress Index reported reliability estimates that were in the good to excellent range (n = 5; R a = 0.860 - 0.930, M a = 0.904). A study that generated their own subscales produced slightly lower reliability estimates based on the individuals who completed the measure (n = 1; R α = 0.660 - 0.940; M a = 0.8625).
Despite low reliability reporting, statistically significant outcomes were observed for some of the variables examined in this study though these results should be interpreted with caution. For the depression subscale, there were three significant findings of note. First, although there was a small sample size there is some indication that Publication Year was significantly, negatively, correlated with Depression subscale reliability estimates (r (5) = -0.77, p = 0.043). This finding suggests that reliability estimates are decreasing over time for the subscale. Second, the Depression subscale and Location Type, whether a study was conducted within the US or outside the US, was statistically significant (n = 5; t (3) = 3.811, p = 0.032). While both alphas reported in the US (M a = .92) and Outside the US (M a = .86) were within the excellent range, US – based sample reliability estimates were significantly higher. Third, the percent of females within a reported study was significantly, negatively, correlated with the Depression subscale reported reliability estimates (r (6) = -0.716, p = 0.046).
As shown in this RG study, very few studies employing the CCAPS reported calculated Cronbach’s alphas (1951) or any reliability estimate for their study sample. As such, to estimate the number of studies which may impact the current findings, a Fail-Safe N proposed by Howell and Shields (2008) was calculated. The calculated Fail-Safe N for the CCAPS 62 – item version reflected a possible 15 “file drawer” studies that could lower the reliability estimates below the threshold of 0.80. Unfortunately, the following variables were unable to be used as there were not enough studies that reported details for these characteristics: Alcohol Use subscale, CCAPS Total, subscale means, and standard deviations, reliability total, Family Distress Index, Distress Index total, Eating Concerns subscale, DSM Diagnosis, presenting problem, medical diagnosis, marital status, religion, income, medications, academic probation, suicidal ideation, homicidal ideation and language.
Even though the CCAPS is widely used among many college and university counseling centers, an RG meta-analysis examining the overall reliability of the instrument has not been conducted. A problem exists in current published literature; authors are not calculating and reporting reliability estimates, such as Cronbach’s (1951) alphas for their study sample. Reliability is essential to calculate and ensure it is robust (≥ 0.80) in order to begin to infer validity. Unfortunately, many studies are using measures, inferring validity of their results and not reporting reliability coefficients; thus, eliminating a crucial element in statistics and scientific inference. RG studies help illuminate and assess reliability reporting (Vacha-Haase, 1998). The current RG found that reliability estimates on the subscales for the CCAPS – 62 had similar reliability to those that were reported by Locke et al. (2011). Unfortunately, due to low reliability reporting practices in published literature for the CCAPS – 34 (Locke et al., 2012), analysis could not be conducted for this version.
Overall, reporting patterns among published research studies using the CCAPS measures demonstrated there was an overall underreporting of reliability coefficients. Many studies did not report reliability coefficients based on their own samples, rather, they reported alpha coefficients from previous sources, stated that the CCAPS is “reliable,” reported a different type of reliability coefficient, or did not discuss reliability at all. More specifically, in the current study, only 34% of the articles that were reviewed reported an alpha coefficient directly calculated from their sample. These results are consistent with previous reliability generalization studies (Vacha-Haase and Thompson, 2011) that indicate very small percentages of studies overall reviewed reported reliability data for their samples.
Analysis of the available reliability coefficients revealed the average reliability on the CCAPS – 62 to be comparable to the original study by Locke et al. (2011), who found a range of alpha values from 0.781 (Academic Distress) to 0.913 (Depression). Based on the limited Cronbach’s (1951) alphas reported and found in this study, the reliability estimates within US samples and for samples internationally fell within good to excellent ranges. Thus, with limited information to date, the CCAPS seems to be able to be used with diverse samples worldwide, though further research is necessary to more concretely affirm this observed trend. Due to the aforementioned underreporting patterns, more in-depth analysis of cross-cultural reliability and generalizability are needed to understand the CCAPS instruments’ psychometric properties when used with diverse undergraduate and graduate student populations.
The Depression subscale revealed some trends suggesting significant outcomes in relation to other variables. This study found a significant, negative correlation between the Depression subscale and publication year, inferring that reliability estimates related to depression decrease over time. This suggests wording present on this subscale may not translate well over time. A significant, negative correlation was found between percentage of females and the Depression subscale. This infers that there may be some aspects of the depression subscale that are less likely to be endorsed or experienced by females completing the CCAPS. This finding may provide further insight to research postulating that men and women endorse different symptoms of depression (Martin et al., 2013). For example, Martin and colleagues’ (2013) findings inferred that men with depression were more likely to endorse engaging in aggression, substance abuse, and risk-taking behaviors. And finally, there was a statistically significant difference between Depression subscale estimates reported within the US and those internationally, with studies in the US reporting higher alphas values. It is important to note both alpha values calculated for individuals within the US and internationally were within the excellent range, thus individuals globally appear to respond reliably to the Depression subscale. The CCAPS Distress Index alpha coefficients reported for this study were within the excellent range which indicates that the Distress Index can be useful to indicate to a clinician whether or not a client is experiencing significant psychological distress.
The lack of available reliability estimates in the majority of published studies using the CCAPS measures was a limitation for this reliability generalization meta-analysis. Due to the limited studies that were available for analysis, it is possible that different results may have been found if all studies had indeed reported Cronbach’s (1951) alphas for their samples. This meta-analytic technique requires reliability estimates based upon each study’s own data, and it is unfortunate that a great proportion of publications do not report Cronbach’s (1951) alpha coefficients, or even mention reliability at all. A second limitation was that some variables were difficult to track due to a lack of reporting and drastic variability within the published research which included income, religion, medical illness, DSM diagnosis, education, marital status, academic probation, and alcohol use. Given the nature of meta-analytic research as secondary research this limits the current data able to be reported. For example, no studies reported religion in the same way, confounding the ability to quantify it.
Subscale analyses revealed there may be sex bias on the CCAPS related to the Depression subscale, however, given the limited data in this study, additional research may need to examine this point further. There are also possible generational concerns, as it was found that publication year had a significant and negative relationship with measuring depression; suggesting that the measure is not able to reliably capture depression in the same manner over time. This warrants further investigation as the current study had limited reliability estimates reported. With the increases in rates of anxiety and depression in the younger generations such as those reported in the Stress in America: Generation Z (2018) report, it is important to select appropriate measures that capture the essence of these constructs reliably and in a language that is easily relatable.
In summary, reliability reporting practices such as those purported in the APA Task Force on Statistical Inference (Wilkinson, 1999), those suggested by the American Educational Research Association, in conjunction with American Psychological Association and National Council on Measurement in Education (2014), and the Journal Article Reporting Standards for Quantitative Research (Appelbaum et al., 2018), are not being upheld to these expected standards. This study provides additional evidence that reliability reporting practices continue to be lacking in published research.
Recommendations for upholding reporting standards
It is imperative for those in teaching, training, and journal review positions to appropriately model reliability reporting practices. As leaders and mentors in the field of counseling and psychology, these professionals can help shape the new generations of researchers while also effecting changes in reliability reporting practices. Faculty and dissertation committee members can be key influences to ensuring masters and doctoral level counseling and psychology students uphold standards of reliability reporting practices. Instructors of statistics courses need to ensure that the relevance and importance of reliability analyses within studies is covered as part of the core content. Journal reviewers are in an excellent role to provide feedback about reliability analyses and request revisions implementing these reliability reporting practices if missing in initial drafts of submitted manuscripts. As demonstrated by this study, reliability reporting is necessary though often overlooked.
Upholding best practices for journal and publication reliability reporting standards includes a few steps. First, authors can cite prior reliability coefficients for scales they are using in their study, as well as initial normative data, and any subsequent reliability coefficients which are related to their current study sample demographics. Second, it is incumbent upon authors to calculate and report the reliability coefficient for the individuals in their study sample. Third, it is helpful to include as many sample (that is, age, ethnicity, sex, gender, sexual orientation, romantic orientation, marital status, mental health diagnosis) and measurement characteristics (total scores, subscale scores, means, standard deviations, language) as possible so that future studies employing meta-analytic techniques may be more meaningful. Fourth, authors need to be explicit about the version of the measure used within the study. If there are any variations in version used, these should be noted clearly followed by calculating and reporting the associated reliability coefficients. Following these four simple steps will align with the standards of practice for reliability reporting and augment the field of psychometrics in counseling and psychological research.
Future directions
Future CCAPS research efforts could focus on inclusion of DSM diagnosis, alcohol use, academic probation, as well as diversity variables and report reliability coefficients based on study participants. Additionally, there were few studies that reported use of the CCAPS with lesbian, gay, bisexual, and gender variant individuals. Future researchers are encouraged to be mindful of diversity and permit study participants to self-identify sex, gender, and sexual orientation in order to better capture an accurate picture of their sample. This is significantly important as many LGBT+ individuals are navigating their sexual and gender identity prior to and during their college years (Bilodeau and Renn, 2005; Edwards-Leeper et al., 2016; Wolff et al., 2016). It is also well documented that navigating the stages of one’s sexual and gender identity development has a significant impact on mental health and functioning (Cass, 1996; Cramer et al., 2018; D’Augelli, 1994; Edwards-Leeper et al., 2016; Fassinger, 1998; Wolff et al., 2016). For example, LGBT+ individuals are at higher risk for mental disorders and suicide attempts when compared to heterosexual individuals (Hass and Drescher, 2014; Wolff et al., 2016). With this information, further CCAPS research could explore reliability coefficients for individuals with different sexual orientations and gender identities.
In summary, our findings illustrate that published reliability scores are good to excellent which are similar to those published by Locke et al. (2011) for the CCAPS – 62. Current findings indicate the CCAPS demonstrates excellent reliability coefficients for college and university students worldwide, with the exception of the Depression subscale which shows some initial indication suggesting reliability is decreasing over time and needs further research. It is important for researchers who use the CCAPS, or any other self-report measure, to report the reliability estimates for their specific sample in order to uphold standards of reporting practices in counseling and psychological research.
The authors have not declared any conflict of interests.
#The third author delineates that this article and included views and research findings are the author’s own and are in no way affiliated with Minnesota Department of Human Services, Direct Care and Treatment – Forensic Services.
REFERENCES
|
American Educational Research Association (AERA), American Psychological Association and National Council on Measurement in Education (NCME) (2014). Standards for Educational and Psychological Testing, 2014 Edition. American Educational Research Association (AERA).
|
|
|
|
American Psychological Association (APA) (2018). Stress in America: Generation Z. Stress in America™ Survey.
|
|
|
|
|
Appelbaum M, Cooper H, Kline RB, Mayo-Wilson E, Nezu AM, Rao S M (2018). Journal article reporting standards for quantitative research in psychology: The APA Publications and Communications Board task force report. American Psychologist 73(1):3-25.
Crossref
|
|
|
|
|
Barreira P, Snider M (2010). History of College Counseling and Mental Health Services and Role of the Community Mental Health Model (J. Kay & V. Schwartz, Eds.). In Mental Health Care in the College Community 18:21-31.
Crossref
|
|
|
|
|
Bilodeau BL, Renn KA (2005). Analysis of LGBT identity development models and implications for practice. New Directions for Student Services 111:25-39.
Crossref
|
|
|
|
|
Borenstein M, Hedges LV, Higgins JPT, Rothstein HR (2009). Introduction to Meta-Analysis, 7th edition. John Wiley and Sons, Ltd.
Crossref
|
|
|
|
|
Bridges J (1928). The mental hygiene movement. The Public Health Journal 19(1):1-8.
|
|
|
|
|
Cass VC (1996). Sexual Orientation Identity Formation: A Western Phenomenon (R.P. Cabaj & T. S. Stein, Eds.). In Textbook of Homosexuality and Mental Health (pp. 227-251). American Psychiatric Press, Inc.
|
|
|
|
|
Center for Collegiate Mental Health (CCMH) (2019).
|
|
|
|
|
Cramer RJ, Golom FD, Golom M, Gemberling T M, Trost K, Lewis R, Wright S (2018). Examining the lesbian, gay, and bisexual identity scale among members of an alternative sexuality special interest group. Archives of Sexual Behavior 47(4):1251-1264.
Crossref
|
|
|
|
|
Cronbach LJ (1951). Coefficient alpha and the internal structure of tests. Psychometrika 16:297-334.
Crossref
|
|
|
|
|
D'Augelli AR (1994). Identity development and sexual orientation: Toward a model of lesbian, gay, and bisexual development (E. J. Trickett, R. J. Watts, & D. Birman, Eds.). In Human Diversity: Perspectives on People in Context (pp. 312-333). Jossey-Bass.
|
|
|
|
|
Edwards-Leeper L, Leibowitz S, Sangganjanavanich VF (2016). Affirmative practice with transgender and gender nonconforming youth: Expanding the model. Psychology of Sexual Orientation and Gender Diversity 3(2):165-172.
Crossref
|
|
|
|
|
Eichler RJ, Schwartz V (2010). Essential Services in College Counseling (R. J. Kay & V. Schwartz, Eds.). In Mental Health Care in the College Community 18:57-93.
Crossref
|
|
|
|
|
Fassinger RE (1998). Lesbian, Gay, and Bisexual Identity and Student Development Theory (R. L. Sanlo, Ed.). In Working with Lesbian, Gay, Bisexual, and Transgender College Students: A Handbook for Faculty and Administrators. The Greenwood Educators Reference Collection, pp. 13-22.
|
|
|
|
|
Geisinger KF (2013). Reliability. In APA handbook of testing and assessment in psychology, Vol. 1: Test theory and testing and assessment in industrial and organizational psychology. (pp. 21-42). American Psychological Association.
Crossref
|
|
|
|
|
George D, Mallery P (2003). SPSS for Windows step by step: A simple guide and reference. 11.0 update (4th ed.). Allyn & Bacon.
|
|
|
|
|
Ghosh A, Rieder Bennett S, Martin JK (2018). Use of the Counseling Center Assessment of Psychological Symptoms 62 (CCAPS-62) as a repeated measure. Journal of College Student Psychotherapy 32(2):151-162.
Crossref
|
|
|
|
|
Groth-Marnat G, Wright AJ (2009). Handbook of psychological assessment (5th ed.). John Wiley & Sons, Inc.
|
|
|
|
|
Hass A, Drescher J (2014). Impact of sexual orientation and gender identity on suicide risk: Implications for assessment and treatment. Psychiatric Times 31(12):24-25.
|
|
|
|
|
Hogan TP, Benjamin A, Brezinski KL (2000). Reliability methods: A note on the frequency of use of various types. Educational and Psychological Measurement 60(4):523-531.
Crossref
|
|
|
|
|
Howell RT, Shields AL (2008). The file drawer problem in reliability generalization: A strategy to compute a fail-safe N with reliability coefficients. Educational and Psychological Measurement 68(1):120-128.
Crossref
|
|
|
|
|
King C, Kivisalu TM, Phillips CE, O'Toole SK (2014). Reliability generalization study of the beck scale for suicidal ideation (BSSI) scale. Canadian Psychological Association, MindPad, Fall 3-7.
|
|
|
|
|
Kraft D (2011). One hundred years of college mental health. Journal of American College Health 59(6):477-481.
Crossref
|
|
|
|
|
Kroenke K, Spitzer RL (2002). The PHQ-9: A new depression diagnostic and severity measure. Psychiatric Annals 32(9):509-515.
Crossref
|
|
|
|
|
Kroenke K, Spitzer RL, Williams JB (2001). The PHQ-9: Validity of a brief depression severity measure. Journal of General Internal Medicine 16(9):606-613.
Crossref
|
|
|
|
|
Lipson SK, Gaddis SM, Heinze J, Beck K, Eisenberg D (2015). Variations in student mental health and treatment utilization across US colleges and universities. Journal of American College Health 63(6):388-396.
Crossref
|
|
|
|
|
Martin LA, Neighbors HW, Griffith DM (2013). The experience of symptoms of depression in men vs women: Analysis of the national comorbidity survey replication. Journal of the American Medical Association Psychiatry 70(10):1100-1106.
Crossref
|
|
|
|
|
Nunnally JC (1978). Psychometric theory. McGraw-Hill.
|
|
|
|
|
Nunnally JC, Bernstein IH (1994). Psychometric theory (3rd ed.). McGraw-Hill.
|
|
|
|
|
Oswalt SB, Lederer AM, Chestnut-Steich K, Day C, Halbritter A, Ortiz D (2020). Trends in college students' mental health diagnoses and utilization of services, 2009 - 2015. Journal of American College Health 68(1):1-11.
Crossref
|
|
|
|
|
Panayides P (2013). Coefficient alpha: Interpret with caution. Europe's Journal of Psychology 9(4):687-696.
Crossref
|
|
|
|
|
Spitzer RL, Kroenke K, Williams JBW, Löwe B (2006). A brief measure for assessing generalized anxiety disorder: The GAD - 7. Archives of Internal Medicine 166(10):1092-1097.
Crossref
|
|
|
|
|
Streiner DL (2003). Starting at the beginning: An introduction to coefficient alpha and internal consistency. Journal of Personality Assessment 80(1):99-103.
Crossref
|
|
|
|
|
Titanium Software (2020). Titanium [Computer software].
|
|
|
|
|
Turner JC, Leno EV, Keller A (2013). Causes of mortality among American college students: A pilot study. Journal of College Student Psychotherapy 27(1):31-42.
Crossref
|
|
|
|
|
Vacha-Haase T (1998). Reliability generalization: Exploring variance in measurement error affecting score reliability across studies. Educational and Psychological Measurement 58(1):6-20.
Crossref
|
|
|
|
|
Vacha-Haase T, Henson RK, Caruso JC (2002). Reliability generalization: Moving toward improved understanding and use of score reliability. Educational and Psychological Measurement 62(4), 562-569.
Crossref
|
|
|
|
|
Vacha-Haase T, Thompson B (2011). Score reliability: A retrospective look back at 12 years of reliability generalization studies. Measurement and Evaluation in Counseling and Development 44(3):159-168.
Crossref
|
|
|
|
|
Vaske JJ, Beaman J, Sponarski CC (2017). Rethinking internal consistency in Cronbach's alpha. Leisure Sciences 39(2):1-11.
Crossref
|
|
|
|
|
Webb NM, Shavelson RJ, Haertel EH (2006). Reliability coefficients and generalizability theory. Handbook of Statistics 26:1-44.
Crossref
|
|
|
|
|
Wilkinson L (1999). Statistical methods in psychology journals: Guidelines and explanations. American Psychologist 54(8):594-604.
Crossref
|
|
|
|
|
Wolff JR, Himes HL, Soares SD, Miller Kwon E (2016). Sexual minority students in non-affirming religious higher education: Mental health, outness, and identity. Psychology of Sexual Orientation and Gender Diversity 3(2):201-212.
Crossref
|
|
|
|
|
Wright S (2018). Examining the lesbian, gay, and bisexual identity scale among members of an alternative sexuality special interest group. Archives of Sexual Behavior 47(4):1251-1264.
Crossref
|
|
|
|
|
Yin P, Fan X (2000). Assessing the reliability of Beck Depression Inventory scores: Reliability generalizations across studies. Educational and Psychological Measurement 60(2):201-223.
Crossref
|
|
|
|
|
Zedeck S (Ed.). (2014). APA Dictionary of Statistics and Research Methods. American Psychological Association.
Crossref
|
|