ABSTRACT
Assessing the performance of an irrigation scheme is an important management function which will indicate the state of the scheme and suggest possible remedial measures to improve the effectiveness of the scheme. This study was conducted to assess the technical and agricultural performances of the Okyereko irrigation scheme in the Central Region of Ghana. Secondary data were collected from the scheme with respect to rainfall, yield for the period of 2011 to 2015 seasons whilst field measurements were carried out to determine the water supply and demand. This study assessed three technical performance indicators and two agricultural performance indicators during the 2014/2015 season. The V-notch and the rectangular weir were used to measure the water delivery and the Manning formula was used to calculate the flow-rates in canals. Water requirements were estimated using the modified Penman method. The results from this study indicated an overall scheme conveyance efficiency of 78.2%, a maximum dependability of irrigation intervals between water applications of 2 and a scheme relative irrigation supply of 1.38. The agricultural performance indicators, output per unit irrigation supply and water productivity per unit crop evapotranspiration (ET), were found to be 0.90 and 20.53 kgm-3, respectively for rice. This study recommends that farmers should be actively involved in all performance assessments and scheme organizations in order to improve the performance since the farmers are major stakeholders of irrigation schemes and are responsible for operation and maintenance after the introduction of Participatory Irrigation Management.
Keywords: Irrigation scheme, agricultural productivity, performance assessment.
Water for irrigation is increasingly becoming limited owing to increased demand from other uses such as domestic water, industries and the environment (Perry, 2005) which give higher economic and social returns. In Ghana, fresh water is becoming scarce due to the activities of illegal miners. As Ghana’s agriculture is faced with seasonal rainfall, irrigation remains one of the obvious options to meet future food demands. To meet the increasing demands for food with an increasingly limited water supply, water resources management must be improved.
The Food and Agriculture Organization (FAO) predicted that food production must increase by 70% globally and that developing countries must double production to match a 40% increase in World population by 2050 (Mukherji et al., 2009). However, unpredictable climate, depleted water resources and the critical shortage of other production resources pose a challenge to increased food production. In anticipation of a food deficit in future, most researchers in the agricultural sector are looking at efficient utilization of water (Mukherji et al., 2009).
Performance assessment of irrigation schemes has gained momentum since the late 1980s due to the perception that the resources (land and water) in irrigation schemes are not being managed appropriately. According to Mdemu et al. (2008), improving water productivity is one important strategy for addressing future water scarcity. Water productivity is an indicator of agricultural productivity in relation to the crop’s consumptive use of water (World Development Report, 2003). Productivity enhancements are accompanied with optimum resource utilization and maximization of the marginal production.
Improving water productivity in agriculture reduces competition for scarce water resources, gives solutions to mitigate environmental degradation and finally may lead to enhanced food security. The government of Ghana sees irrigation as a tool for improving the citizen’s livelihood, food security and empowering and mainstreaming the previously disadvantaged farmers in the local, national and international economy. Irrigated agriculture has been the major fresh water consumer among the water using sectors in Ghana and the world, and it has been highly threatened under water scarcity situation in the recent past as a result of growing water demands from emerging sectors (Aman, 2003).
The inadequate technical skills in planning, implementing and monitoring of the system, poor man-management, and technical deficiencies in the physical system, salinity and low yield are major problems in irrigation schemes. As such, the government of Ghana and the Japan International Cooperation Agency (JICA) has invested significant financial resources into the rehabilitation of irrigation schemes across the country in order to ensure that Ghana becomes self-sufficient in food production. The performance assessment of irrigation schemes should employ a holistic approach (interdisciplinary stakeholder approach) to benefit the less privileged farmers.
According to Sam-Amoah and Gowing, 2001), little attention has been paid to the perception of the consumer of irrigation services and the fundamental stakeholder – farmers – when discussing the performance of irrigation schemes. This study focuses on some of the technical aspects of irrigation performance (water balance, water service and maintenance which will be evaluated using conveyance efficiency, dependability of irrigation intervals between water applications and relative water supply); agricultural performance, which will be evaluated using output per unit irrigation supply and output per unit water consumed. Therefore the objective of this study was to assess the performance of the Okyereko irrigation scheme and to identify the best organization practices for the scheme.
Study area
The research was carried out at the Okyereko Irrigation Scheme at Okyereko which is located on latitude 5° and longitude 5°, 30° N near the Okyereko village in the Central Region of Ghana. The Okyereko scheme is situated about 1.5 km off the Accra- Winneba road, 49 km from Accra. The scheme consists of an earthen dam with a catchment area of about 1685 km2; the reservoir is fed by the tributary from the Ayensu river with Coastal Savannah vegetation and annual average rainfall of 750 mm.
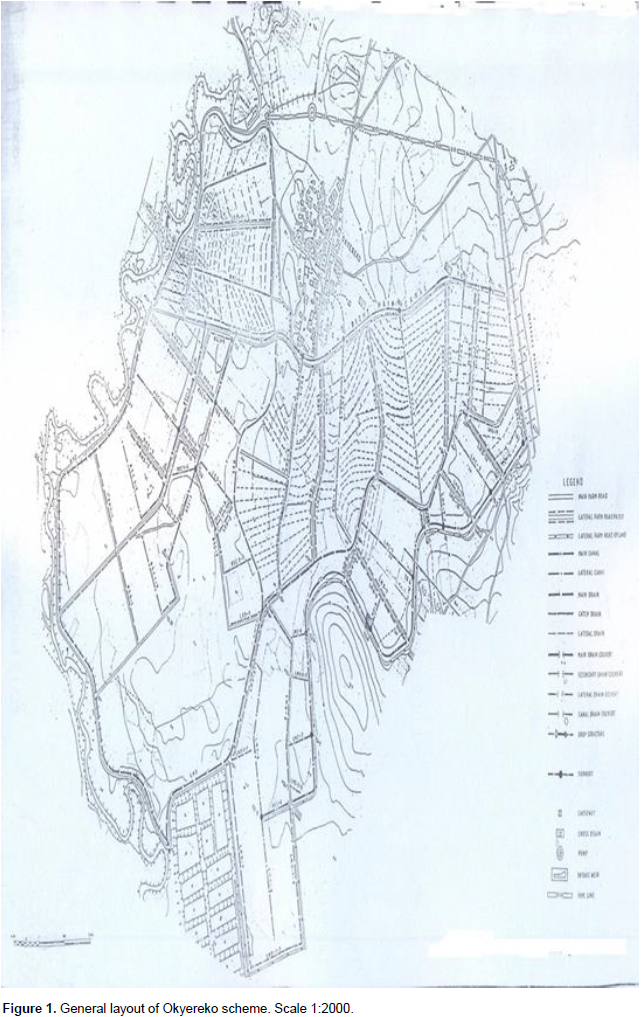
The scheme has two main canals, the left and the right main canals but due to flooding the left main canal is damaged and no more in use. The scheme spans approximately 81 hectares with 132 farmers. It is divided into 0.68 ha per plot. Water is diverted from a weir constructed across the Ayensu river into a trapezoidal concrete canal which runs for 2.4 km from the diversion point to the end of the scheme (Koie, 2000). This concrete-lined canal with a top width of 2.0 m and a depth of 0.5 to 0.7 m is designed to convey approximately 100 L s-1.
The scheme is divided into 7 lateral blocks of different sizes for management and ease of water distribution. The scheme layout is depicted in Figure 1. Water is diverted from the reservoir and conveyed to the scheme through a trapezoidal concrete canal from which distributary canals of different shapes (U-flume for secondary canal, steep portion for lateral and gentle for sub-laterals) branch to supply water to the plots. The scheme was chosen because it is one of the medium sized schemes in Ghana exhibiting water shortage, salinity and therefore needs to be investigated.

Field measurements
Flow rates at various points in the scheme and crop yields were measured, and crop yields within the scheme were physically measured. Although there are new, accurate and more encompassing technologies such as remote sensing (Perry, 2005), field measurements were used in this study due to resource constraints and the small size of individual irrigated plots which measured approximately 0.68 ha per plot.
Data collection
For the study, all the necessary primary data were collected from the Okyereko irrigation scheme and secondary data from Winneba Meteorological station. In addition, some discussions were also held with farmers. Data collected included: flow rate, crop production records, price of crops, area irrigated, command area, cropping pattern, soil and climatic data.
Flow rate measurement
Measuring devices of irrigation discharge
There are several types of measuring devices, the common ones being rectangular and V-notch weirs. A V-notch weir measures smaller discharges as compared to a rectangular weir, and was installed at the start of the main irrigation canal, just after the dam outlet pipe to enable discharge to be measured precisely.
The constructed measuring device consists of an outlet box, an energy dissipating wall and a thin V-notch plate with an angle of 120°. An effective free-flow discharge coefficient was adopted with a value of 0.58, which is the theoretical value for C in the Manning formula.
The relationship between the overflow depth and discharge of the V-notch weir is calculated using the Manning equation which is defined as follows:

Where, Q is the Discharge (m3s-1); C is the effective free-flow discharge coefficient; Ø is the V-notch angle (degree) and h is the overflow depth (m) to be read using a staff gauge installed on the outlet box wall.
Turnout discharge
Turnout gates are constructed at various sections along the main canal. There are seven turnout gates along the main canals. The gate opening is regarded as a rectangular weir to measure discharge of water to farmers’ fields. The turnout gates are of two types, type 1 and type 3 with different effective free-flow discharge coefficients (C value) which are 1.68 and 1.77 respectively. These values were adopted from the operation and maintenance manual of the Okyereko irrigation scheme. The relation between overflow depth and discharge of the rectangular weir used is calculated using the Manning equation which is defined as follows:
Where, Q is the Discharge (m3s-1); C is the effective free-flow discharge coefficient; B is the effective width of constriction (m) and h is the overflow depth (m) to be read using staff gauge installed on the outlet box wall.
Water demand (ETo)
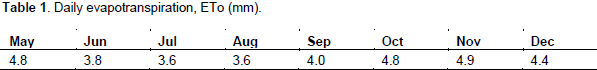
Reference crop evapotranspiration in mm/day (ETo) was estimated by the modified Penman method. There are many methods to estimate crop evapotranspiration. The modified Penman method was used, since it is likely to provide the most satisfactory results and is adopted for many projects in estimating the reference crop evapotranspiration. The estimated ETo is shown in Table 1.
Technical performance indicator used
Relative irrigation supply (RIS)
The RIS is an indicator that shows the irrigation efficiency of the scheme as a whole. This is because it compares the irrigation water supplied with the irrigation water needed. Relative Irrigation Supply (RIS) gives an indication of how well crop water requirements are met or satisfied in a scheme (Molden et al., 1998). It is calculated using Equation 3:
Where, RIS is the relative irrigation supply, Si is the irrigation supply [m3.s-1], and Di is the irrigation demand [m3.s-1].
Conveyance efficiency (Ec)
Conveyance efficiency refers to the ratio of volume of water leaving a canal section to that introduced into the section.
As a performance indicator, Ec is assessed by measuring inflow and outflow of selected canal and calculated using Equation developed by Bos et al. (2005):

Where, Ec is the Conveyance efficiency, Qinflow is the total water flowing into a specific section of the canal [m3.s-1], and Qoutflow is the total water flowing out of a specific section of the canal [m3.s-1].
This indicator can be analyzed either as a trend in time to quantify the need for system maintenance or spatially to identify sections of the canal sections that need maintenance. The temporal variation of the conveyance efficiency over the same section shows that either the system has deteriorated or has been rehabilitated, depending on whether the variation is positive or negative. A value >1 implies more water leaves a specific canal section than that which enters it, while a value equal to 1 implies there is no water loss over the section under consideration. A value < 1 indicates that there was water loss in the section and therefore a need for maintenance of the system. The amount of water lost will determine the need for maintenance of the system. It is recommended that the conveyance efficiency of concrete lined-canal should be above 85% (Brouwer et al., 1989; Gungor et al., 1996), cited by Korkmaz et al. (2009). The indicator has been used in various performance assessment studies in water scarce regions.
Dependability of irrigation interval between water application
Dependability is the reliability or timeliness of water delivery to the edge of the plots. This indicator, when given as a trend in time, shows changes in service to farmers (timing only) while it illustrates the equity of water delivery service to farmers when analyzed in space (Bos et al., 2005).

Where,
Dint = dependability of irrigation interval between water applications,
Aint = actual irrigation interval [days], and
Iint = intended or design irrigation interval [days].
Dint equals 1 if water is delivered as scheduled, less than 1 if water is delivered more often than planned and greater than 1 if farmers wait longer than scheduled to receive water.
Agricultural performance indicators used
Output per unit water consumed (WPET)
It is calculated using Equation 6 by Molden et al. (1998):
Where
WPET is the output per unit water consumed [kg/m3],
P is the yield [kg], and
QET is the volume of water consumed by crop (ETo) [m3].
This indicator provides information on yield to those who are more concerned with crop behavior such as crop physiologists and agronomists (Gomo, 2012).
Output per unit irrigation supply
This indicator provides information on water use in the field or plot which is expressed in kg/m3 and it is calculated using Equation 7.
Where
WPI is the water productivity with respect to irrigation water supply [kg/m3],
P is the crop yield [kg],
Qd is the diverted irrigation water into a specific plot [m3].
This indicator is important to water managers and farmers since water managers are usually concerned with water use, and farmers use the water to maximize returns from their investments. Values for diverted irrigation water into a specific plot [m3] and volume of water consumed by crop ET [m3] were for only 2015/2016 cropping season. These values were used for the previous years since no such records were available.
Yield measurements
Crop yields were measured from farmers in the head, middle and lower location in all the 9 plots. Individual paddy rice bags were weighed and an average weight calculated for each plot. The total harvest per irrigated land was calculated from the average weight of yield per plot. The yield measurements were done just before the produce was taken to the market.
Technical performance indicators
Conveyance efficiency (Ec)
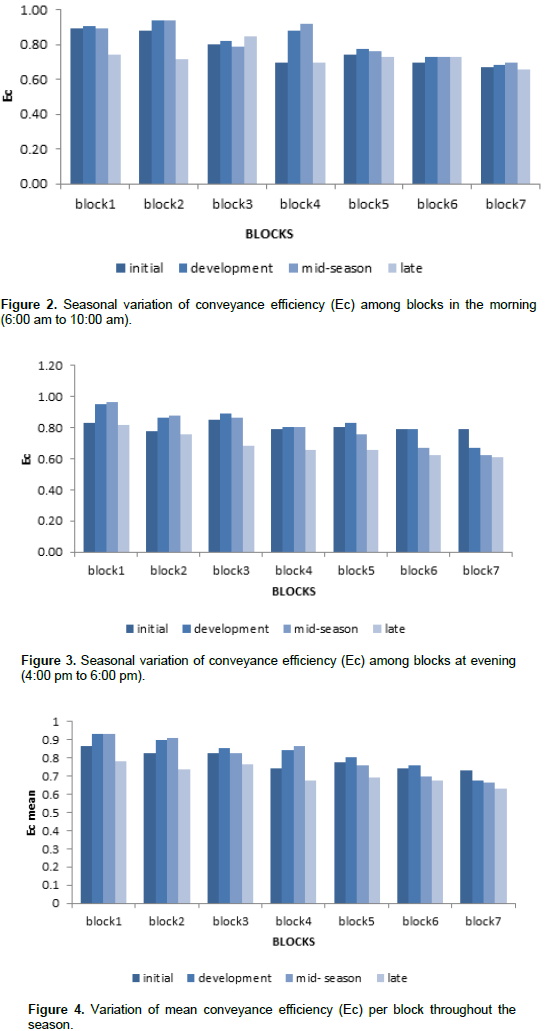
The results presented in Figure 2 show the sequential conveyance efficiency values at the scheme. Conveyance efficiency is calculated from the ratio of irrigation supply from the inlet of the V-notch weir as input and discharge to farmers’ plots through the turnout gate as the output flow for the various stages of growth for each block. The variation of conveyance efficiency at the initial, developmental, mid- season and late stages of the season at morning and evening hours for each block can be seen in Figures 2 and 3 while the variation of overall mean Ec per block in the scheme is illustrated in Figure 4.
Dependability of irrigation interval between water applications (Dint)
The dependability for successive water deliveries to the edge of plots varied within each block and along the canal from head to tail-end between 0.43-2.00 (Figure 5).
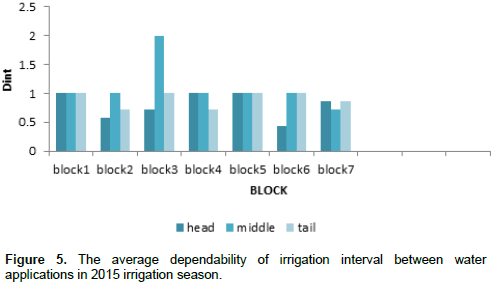
In the 2015 irrigation season at Okyereko Irrigation Scheme (OIS), the values of Dint were equal to 1 for Blocks1 and 5, indicating that water was delivered to the edge of the plots as planned from the head to the tail portions of the blocks; Dint values were around 1 in blocks 2, 3, 4 and 6, showing that water is delivered around the planned time on average but only the middle section of block 3 had a Din value > 1 meaning that the farmers wait for a longer time to get water on the edge of their plots than assured. Dint values are Ë‚ 1 for block 7 indicating that more water was delivered to the edge of the plots than planned. These values were obtained from the intended irrigation interval for the scheme and the actual irrigation interval by the farmers.
Relative irrigation supply
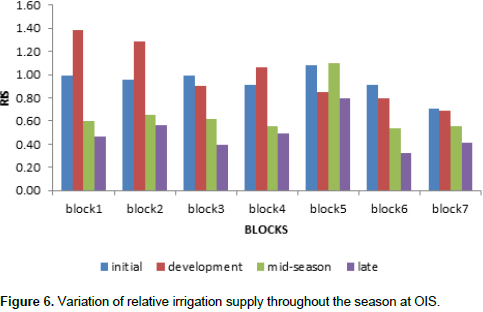
The level to which crop water demands were met varied with the growth stages of the rice growth from the initial, developmental, mid-season and late stages of the season. RIS varied among the blocks from 0.39 to 1.38, increasing in the developmental stage of the season varying between 1.38 to 0.69 from the head to the tail end of the blocks, as can be seen in Figure 6. This graph was obtained from the water supply values obtained from the intake weir using the V-notch weir and the discharge calculated using the Manning formula whilst the crop water demand was obtained from daily ETo for the various months of the rice growth.
Agricultural performance indicators
Output per unit water consumed (WPET)
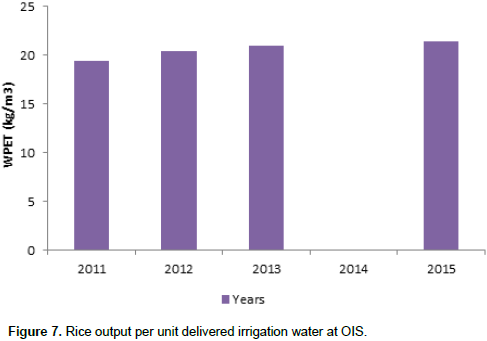
The average values of output per unit of water consumed by the rice at OIS for the 2011, 2012, 2013, and 2015 are 19.34, 20.40, 20.93 and 21.44 kg/m3 respectively (Figure 7). The value for 2014 was not obtained because there was no cropping due to flooding.

Output per unit irrigation supply
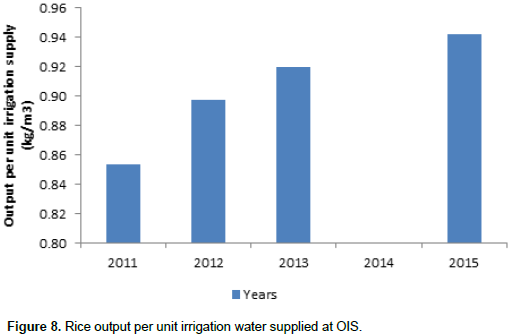
The Output per unit irrigation supply is shown in Figure 8. The trend in these results shows that output per irrigation supply increased from 2011 to 2015. The output per unit irrigation supply for rice varied from 0.85 to 0.94 kg/m3. The highest productivity was in 2015. There was no cropping due to flooding in 2014.
Conveyance efficiency
The conveyance efficiency varied within the day, at the initial, development, mid- season and late growth stages of rice during the season and among the blocks throughout the scheme as can be seen from Figures 2 and 3. The average conveyance efficiency of the concrete-lined U- flume main canal was 78.2%. According to Jadhav et al. (2014), average conveyance efficiency should be 75% for concrete-lined canals and this was also recommended by Bahramlou (2007)who reported conveyance efficiencies of 71.1 and 94.4% for concrete and stone lined irrigation canals respectively.
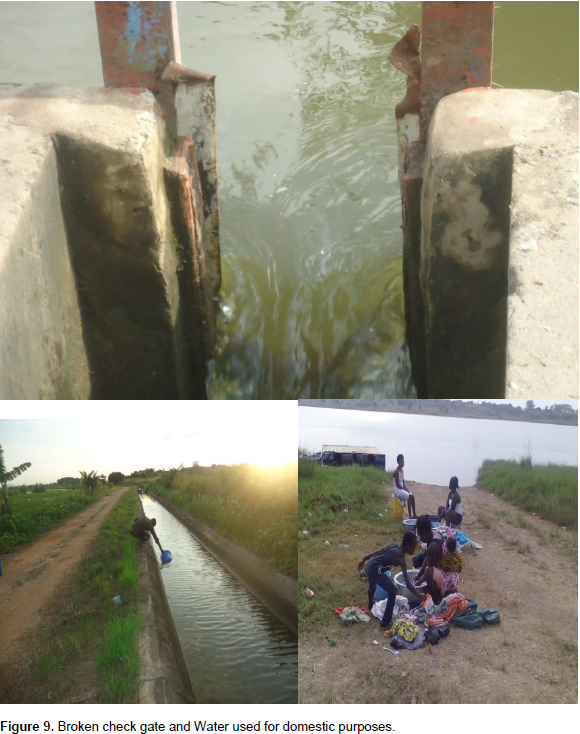
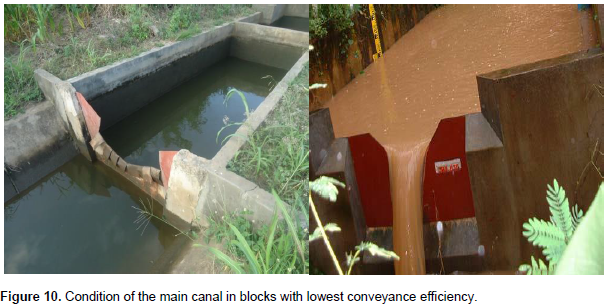
The conveyance efficiencies in the morning (6:00 am to 10:00 am), mean (12:00 noon), and evening (4:00 pm to 6:00 pm) at the initial, development, mid- season and late growth stages of the season were almost constant in each block, as shown in Figures 2 to 4, for Blocks 1 to 7, ranging from 61 to 97%, indicating that there was no significant decline of the system nor increased illegal water withdrawals throughout the season. This was because the farmers have access to adequate irrigation water and there are proper maintenance practices. The slight variations can be explained by the fact that water supply is for multiple-use that is, domestic and irrigation. Also there are broken turnout gates as seen in Figure 9.

The conveyance efficiency values obtained from this study were found to be comparable to other results from various irrigation canals in Africa, Iran and other parts of the world which ranged between 61% and 95% (Manzanera et al., 1992). Conveyance efficiency in concrete lined irrigation canal in Asia and Latin America was also found to range from 61 to 93% (Manzanera et al., 1992). According to Jadhav et al. (2014), average conveyance efficiency was found to be 75% in concrete-lined trapezoidal canal in India, while Awulachew and Ayana (2011)found a conveyance efficiency of 88.7% in Bilate irrigation scheme in Ethiopia, and Gomo (2012)found a conveyance efficiency 86.4% in Mooi river irrigation scheme. Results from this study revealed a scheme average conveyance efficiency of 78.2% which is not so different from those found in South Africa, India, Iran, Sri Lanka and Ethiopia.
Dependability of irrigation interval between water applications (Dint)
The dependability of irrigation intervals between water deliveries was equal to one in blocks 1 and 5 indicating that water was being delivered to the edge of the plots as planned and from the head to the tail portions of the blocks as intended. The waiting period between two consecutive water applications within and among these blocks is 7 days, averaging 7 days for the season. In blocks 2, 3, 4 and 6, the Dint value was less than 1 on average. The waiting period between two consecutive water applications within and among these blocks ranged between 1 to 6 days, averaging 4 days for the season. This is less than the intended interval of 7 days between water applications. The farmers have access to water at any time of the day hence they do not wait for the planned day of delivery at the expense of those further away at the tail end.
According to Bos et al. (2005), the pattern of water delivery over time is directly proportional to the overall water that is consumed with a direct impact on crop production. It should be noted that frequent access does not transform directly into adequacy of water unless the supply meets demand over a given period (Gomo, 2012). The values of dependability of irrigation intervals between water applications shown in Figure 5 are almost uniform along the scheme within and among the blocks from the head to the tail end blocks. The results show that the farmers in the middle part of block 3 waited for longer periods of up to 14 days before water was delivered. The farmers would not be sure of the actual time the water would be delivered and as such would tend to temper with the infrastructure in order to access the little water that reaches them, as can be seen in Figure 10.
The farmers would also not use other inputs such as fertilizers in optimal quantities faced with erratic variation in timing of water delivery. Instead, they would be concerned with the survival of the crop. The results of this study are comparable to those found in other studies. For example, Bos et al. (2005)found that the dependability of irrigation interval between water application in Chivilcoy canal in Argentina ranged between 0.1 and 1.15, where the water distribution was controlled by the government and Gomo (2012)reported that dependability of irrigation interval between water application in Mooi river irrigation scheme ranged between 0.34 and 2.81. These results are thus comparable to those determined from this study which ranged between 0.43 and 2.00.
Relative irrigation supply
In this study, the average Relative Irrigation Supply (RIS) values for the season were established to be 0.94 at the initial stage of the season, 0.99 in the developmental stage of the season, 0.66 in the mid-season stage and 0.49 at the end of the season. This indicator was calculated based on measurements of water diverted through turnout gates from the secondary canals; hence there is a possibility of over-estimation of the RIS since other water users such as block molders and siphoning of water to irrigate other crops outside the scheme were evident.
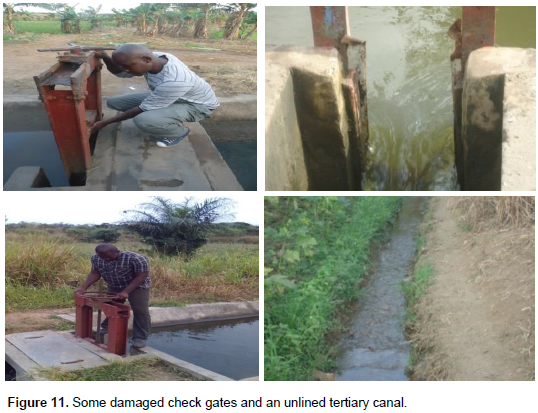
The values of RIS per block in this study were found to vary significantly at the initial to the late stages of growth of the season. Blocks 1 and 2 had the highest values, as can be seen in Figure 6, indicating that they may be over irrigating. This might be because the farmers have access to water at any time of the day since they have most of their check gates damaged and are also responsible for opening the turnout gates for water distribution. The results show that there was an increase in the RIS values for blocks 1 and 2 from 0.47 to 1.38. This can be attributed to the farmers increasing their water application because of damaged check gates, unlined tertiary canals and broken bunds around the plots in the study area. This can be seen in Figure 11. The farmers always wanted to see their plot ponded with water in spite of the fact that there might be enough water in the soil to sustain the crop growth.
Blocks 6 and 7 had low RIS values ranging from 0.32 to 0.92 throughout the season, indicating a fairly huge mismatch between the irrigation water supplied and the crop demand. This may be explained by the fact that more water is used upstream than in the downstream blocks. The relative irrigation supply values for 18 different irrigation schemes located in 11 countries ranged from 0.41 to 4.81 (Molden et al., 1998). De Fraiture and Garces-Restrepo (1997)also suggested that at field levels, RIS values are generally low with an average value of 0.88. In Turkey, the RIS values found were 1.2, 1.4 and 1.5 in the evaluation of Irrigation Management Transfer (IMT) as management intervention in the Aegean region (Uysal and Atis, 2010). Results from this study revealed a scheme average of 0.77 which shows that the performance is comparable to other schemes around the world.
Output per unit irrigation supply (OPIS)
The values for the OPIS show a rising trend over the past five years showing a general trend of increasing agricultural production. Notwithstanding the rising trend, there is a lot of variation between the years, the lowest value being 0.85 and 0.94 kgm-3 as the highest value. The value of OPIS was found to range from 8.80-28.78 kgm-3 for rice in Sri Lanka (Lakmali et al., 2015). According to De Fraiture and Garces-Restrepo (1997), a closer analysis of irrigation and rainfall showed that if rainfall is higher than irrigation needed, the value of OPIS is high but less in the dry season.
According to Molden et al. (1998), it is recommended that results should be compared in terms of yield obtained when dealing with sole crops, otherwise comparison should be made in terms of standardized market value. In each year, the water productivity with respect to water supply was taken to be constant from 2011 to 2015.
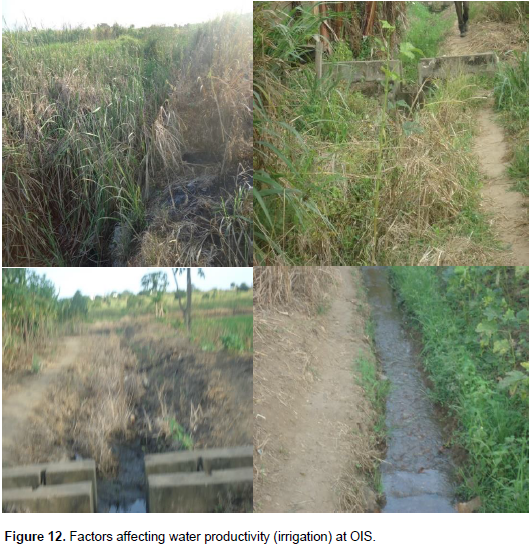
Comparing the results obtained from this study with those from other countries throughout the world, OIS has a low OPIS value even with minimal rainfall or no rainfall. Various factors which were observed during the study period that could have contributed to the lower water productivity with respect to irrigation are tail-water not re-used and flowing back to the river from the plots, signs of over-irrigation and poor cultural practices such as lack of weeding round canals, laterals and drainage systems. All these reduce crop yield per irrigation water supply. These can be seen in Figure 12.

Output per unit water consumed (WPET)
The average values of water productivity with respect to crop evapotranspiration (WPET) for 2011, 2012, 2013 and 2014 at the OIS were 19.43, 20.40, 20.93 and 21.44 kgm-3 respectively. The variation of WPET was very small throughout the five years. The results are comparable to those estimated by FAO (2002), which ranged between 12 to 20 kgm-3. The increase in value can be due to the varieties of rice (Jasmine 45) grown by the farmers. Other factors are proper crop management and farmers having adequate knowledge about the rice variety and the inputs such as fertilizer and pesticides that they apply.

 found that the dependability of irrigation interval between water application in Chivilcoy canal in Argentina ranged between 0.1 and 1.15, where the water distribution was controlled by the government and Gomo (2012) reported that dependability of irrigation interval between water application in Mooi river irrigation scheme ranged between 0.34 and 2.81. These results are thus comparable to those determined from this study which ranged between 0.43 and 2.00. Relative irrigation supply In this study, the average Relative Irrigation Supply (RIS) values for the season were established to be 0.94 at the initial stage of the season, 0.99 in the developmental stage of the season, 0.66 in the mid-season stage and 0.49 at the end of the season. This indicator was calculated based on measurements of water diverted through turnout gates from the secondary canals; hence there is a possibility of over-estimation of the RIS since other water users such as block molders and siphoning of water to irrigate other crops outside the scheme were evident. The values of RIS per block in this study were found to vary significantly at the initial to the late stages of growth of the season. Blocks 1 and 2 had the highest values, as can be seen in Figure 6, indicating that they may be over irrigating. This might be because the farmers have access to water at any time of the day since they have most of their check gates damaged and are also responsible for opening the turnout gates for water distribution. The results show that there was an increase in the RIS values for blocks 1 and 2 from 0.47 to 1.38. This can be attributed to the farmers increasing their water application because of damaged check gates, unlined tertiary canals and broken bunds around the plots in the study area. This can be seen in Figure 11. The farmers always wanted to see their plot ponded with water in spite of the fact that there might be enough water in the soil to sustain the crop growth.)

The main objective of this study was to assess the technical and agriculture performance of the Okyereko irrigation scheme, with respect to water supply and delivery and agricultural performance indicators. The results of the study show that the scheme performance is comparable to results found in other parts of the world. Results from the conveyance efficiency calculation indicate that the system delivers enough water to irrigate the whole scheme but inadequate institutional framework, poor man management and many other technical deficiencies limit effective water distribution within the blocks. Farmers located in the head blocks of the scheme have unlimited access to water at the expense of middle and tail-end blocks.
If this water distribution is regulated it may improve the effective performance of the scheme. Even though water productivity is generally low within the scheme, it is still performing like other schemes around the world. However, the level of infrastructure damage taking place could lead to further deterioration of the scheme’s performance. This can be averted if farmers actively participate in the management of the scheme as well as putting in place a regulating authority, which should involve Ghana Irrigation Development Authority (GIDA) and influential traditional governance system which will be responsible for land allocation and fairness of water distribution in the scheme.
The authors have not declared any conflict of interests.
The authors wish to express their gratitude to Mr. Fianu, the Scheme Manager, Okyereko Irrigation Scheme, the School of Agriculture, University of Cape Coast, staff of Winneba Meteorological Station and farmers at the scheme for their support during the field work.
REFERENCES
|
Aman M (2003). Evaluating and comparing the performances of different irrigation systems using remote sensing and GIS. International Institute for Geo-Information Science and Earth Observations, The Netherlands. Available at:
View
|
|
|
|
Awulachew S, Ayana M (2011). Performance of irrigation: An assessment at different scales in Ethiopia. Cambridge University Press. Cambridge, UK. J. Exp. Agric. 47:57-69.
Crossref
|
|
|
|
|
Bahramlou R (2007). Comparison of Conveyance Efficiency in unlined and lined with Concrete and Stone Irrigation Canals (Case Study: Hamedan-Bahar Plain). Agric. Res. J. 7(2):67-77.
|
|
|
|
|
Bos MG, Burton MA, Molden D (2005). Irrigation and drainage performance assessment : practical guidelines. Irrig. Drain. Syst. 7(1):153-160.
|
|
|
|
|
Brouwer C, Prins K, Heibloem M (1989). Irrigation water management: Irrigation scheduling. Training Manual Number 4. FAO Publication. Rome, Italy.
|
|
|
|
|
De Fraiture C, Garces-Restrepo C (1997). Assessing trends and changes in irrigation performance. the case of Samaca irrigation scheme, colombia 1:19.
|
|
|
|
|
Food and Agriculture Organization (FAO) (2002). Utilization efficiency for harvested yield (Ey) for cabbage heads. Available at:
View
|
|
|
|
|
Gomo T (2012). Assessing the performance of smallholder irrigation in south africa and opportunities for deriving best management practices. J. Irrig. Drain. Syst. 17:285-303.
|
|
|
|
|
Gungor Y, Ersozel A, Yildirim O (1996)."Sulama" Ankara Univ. ziraat Fak. Ankara 1443(424).
|
|
|
|
|
Jadhav PB, Thokal RT, Mane MS, Bhange HN, Kale SR (2014). Conveyance Efficiency Improvement through Canal Lining and Yield Increment By Adopting Drip Irrigation in Command Area. Int. J. Innov. Res. Sci. Eng. Technol. 3(4):40-71.
|
|
|
|
|
Koie N (2000). Operation and maintenance manual for okyereko. pp.16-210.
|
|
|
|
|
Korkmaz N, Avci M, Unal HB, Asik S, Gunduz M (2009). An evaluation of the water delivery performance of the Menemen Left Bank irrigation system, using variables measured on site. J. Irrig. Drain. Eng. 135(5):633-643.
Crossref
|
|
|
|
|
Lakmali WAS, Dayawansa NDK, Gunawardena ERN (2015). Comparative Performance Assessment of Major Irrigation Systems in Upper Deduru Oya Basin. Trop. Agric. Res. 26(2):343-358.
Crossref
|
|
|
|
|
Manzanera M, Querner EP, Ciancaglini NC (1992). Utilization of SIMWAT model in an irrigated area of Mendoza, Argentina. In IIMI; CEMAGREF. International Workshop on The Application of Mathematical Modelling for the Improvement of Irrigation Canal Operation, October 26-30, 1992. Montpellier, France. pp. 55-65.
|
|
|
|
|
Mdemu MV, Rodgersa C, Vleka PLG, Borgadi JJ (2008). Water productivity (WP) in reservoir irrigated irrigation system in the upper east region (UER) of Ghana. Phys. Chem. Earth J. 34:324-328.
Crossref
|
|
|
|
|
Molden D, Sakthivadivel R, Perry C, De Fraiture C, Kloezen W (1998). Indicators for Comparing Performance of Irrigated Agricultural Systems Research Report 20. IWMI Publications. Colombo, Sri Lanka.
|
|
|
|
|
Mukherji A, Facon T, Burke J, De fraiture C, Molden D, Colin C (2009). Revitalzing Asia's irrigation to sustainably meet tomorrow's food needs. Colombo, Sri Lanka. IWMI. Rome, Italy. FAO. Water Policy 14(3):430-446.
Crossref
|
|
|
|
|
Perry C (2005). Irrigation reliability and the productivity of water: A proposed methodology using evapotranspiration mapping. Irrig. Drain. Syst. 19:211-223.
Crossref
|
|
|
|
|
Sam-Amoah LK, Gowing JW (2001). Assessing the performance of irrigation schemes with minimum data on water deliveries. Irrig. Drain. 50:31-39.
Crossref
|
|
|
|
|
Uysal O, Atis E (2010). Assessing the performance of participatory irrigation management over time: A case study from Turkey. Agric. Water Manag. J. 97:1017-1025.
Crossref
|
|
|
|
|
World Development Report (2003). Sustainable Development in a Dynamic World: Transforming Institutions, Growth, and Quality of Life. World Bank.
|
|