Full Length Research Paper

ABSTRACT
The study was conducted to investigate microbiological quality of goat carcass in the Ethiopian export abattoirs, located in Modjo from January to April, 2017. Swabbed samples of 180 were collected from three abattoirs: 144 were from 12 carcass of three anatomical sites (thorax, hind and foreleg), 24 employees' hands and apron, and 12 carcass washing water to determine coliform counts (CFU), Escherichia coli and total plate counts (TPC) as indicator organisms focusing carcass decontamination effects of post washing, acid spray and chilling. The mean result for TPC log/cm2 was 4.22, 4.03 and 3.56 for Abattoir 1, 2 and 3, respectively. Ranging from 1.7 to 7.4 and mean 3.95 ± 1.3 TPC log/cm2 for the water, employees' hands and apron. There was 1.9±1.006 TPC counts/cm2, 1.38±0.874 CFU counts/cm2 and 1.28±0.799 E. coli/cm2 mean in the carcass with statistically significant difference (p<0.05) level that meat handling procedures enabled the abattoirs with minimal microbial counts from washing to chilling. Strongly significant correlation (p<.05) among the microbials was observed. The study confirmed the abattoirs slaughtering procedures enabled to deliver safe carcass with very minimum microbial counts that 96.5% of the carcass was safe cumulative wise of which 84% was categorized in excellent standards. Carcass contaminating bacteria should be determined.
Key words. Microbial, goat carcass decontamination, Ethiopian export abattoirs.
Abbreviation: APC, Aerobic plate count; SPC, standard plate counts; TPC, total plate counts; TVC, total viable counts; CFU, coliform counts; ECC, Escherichia coli counts.INTRODUCTION
The export of meat and meat products is an important element in the Ethiopian economy as there is an ever increasing demand for meat and meat products worldwide including beef, sheep, goat, processed meats, etc., both as fresh and frozen products. Ethiopia has the opportunity to respond to this international demand and increase its market share in what is a very lucrative trade, subject to it meeting the stringent requirements demanded by livestock and meat importing countries. Because of its composition, meat of all sorts is highly susceptible to microbiological and chemical contamination. Unless derived from healthy animals, handled % processed in a proper manner, it may present a serious health hazard to consumers. To prevent this, importing countries are setting high standards for both product preparation and final product involving the most strict health and quality controls and scientific inspection. Therefore, it is essential for Ethiopia to comply with the requirements of importing countries. To do otherwise, results in costly rejections and loss of product (Nega, 2015). The safety of meat has been at the forefront of societal concerns in recent years, and indications exist that challenges to meat safety will continue in the future (Sofos, 2008).
Wholesome meat must be produced hygienically, free from pathogenic organisms and retains its natural state and nutritive value. Monitoring the prevalence of microorganisms of hygienic interest in primary production at abattoirs makes data available for effective control of pathogenic agents before they entered the food (Bhandare et al., 2010). Raw meat is an ideal medium for bacterial growth; this is due to its high moisture contents. It is rich in protein, fermentable carbohydrate (glycogen), favorable pH and other growth factors (Magnus, 1981). Mayr et al. (2003) showed that meat provides an ideal condition for the growth of different spoilage bacteria making meat very perishable. Indicator organisms are bacteria that are used to provide evidence of poor hygiene, inadequate processing or post-process contamination of foods. They are often chosen because they are relatively quick and simple to detect. Their absence in food provides a degree of assurance that the hygiene and food manufacturing process has been carried out appropriately, whereas their presence usually indicates that a potential problem or failure in the process has occurred (Mead, 2007).
Microbiological tests are important in governmental food inspection to enforce legal requirements, international trade to determine compliance with microbiological standards, commercial relationships between trading partners to ensure that agreed microbiological specifications are met, the food industry to maintain quality control and process requirements, academic areas for research purposes, and reference laboratories to confirm the results of other laboratories and to provide surveillance data (Mead, 2007). Both total viable counts (TVC) and Escherichia coli testing are necessary to understand the process of slaughter, dressing and chilling. Testing for other organisms may be specified by specific customer (AS 4696-2002). Testing foods and water for coliform has remained popular, not least because specific guidelines and regulations demand coliform testing. Microbiological criteria are used at any stage in the food chain to assess the acceptance of lots of raw material or finished product. They are based on the absence/presence of certain microorganisms or quantitative limits per units. Product counts were obtained using methods set out based on surveys of Australian meat (AS 4696-2002) descriptions used: Excellent, Good, Acceptable and Marginal for microbial levels listed:
If E. coli/cm2 is a) zero- excellent; b) 1-10= good; c) 10-100= acceptable; d) 100-1000= marginal; e) E. coli/cm2 more than 1000 is not acceptable.
If total plate counts (TPC)/cm2 is a) <1000= excellent; b) 103-104= good; c) 104-105= acceptable; d) 105-106-= marginal; e) TPC/cm2 more than 106 is not acceptable.
If coliform counts (CFU)/cm2 is a) zero= excellent; b) 1-10= good; c) 10-100= acceptable; d) 100-1000= marginal; e) E. coli/cm2 more than 1000 is not acceptable.
Coliform more than 1000 is unacceptable. For water samples, detection of any coliform unit is undesirable.
The food industry uses microbial test as an indicator to determine the overall level of sanitation within the manufacturing and distribution processes and to determine whether the processing kill step was significant. The higher the microbial load found in TPC is, the greater is the possibility that the processing environment is not clean or that the process was not sufficient enough to kill an adequate number of the organisms present. TPC is a good indicator for the overall bacterial load of meat and meat products. Critical hygienic dimensions are reached when the total number of bacteria on fresh meat lies between 104 and 105/g. E. coli are bacteria present in intestines of human and animal. Shiga toxin-producing strains of E. coli or STECs are responsible for most food-related E. coli infections. E. coli O157:H7 and other STECs like E. coli O145 and E. coli O121:H19 produce a toxin called Shiga toxin, which causes illness in humans (Nagarajan et al., 2018). E. coli were enumerated on Eosin methylene blue agar by plating an appropriate dilution on plates followed by aerobic incubation at 37°C for 24 h. After incubation, E. coli were counted as colonies with distinct metallic sheen (Bhandare et al., 2007).
Therefore, the aim of the study was to investigate HACCP/GMPs practices and evaluate the microbial distribution of goat carcass at export abattoirs.
Specific objectives
(1) To satisfy regulatory requirements providing customers with information on product quality, (2) To monitor process control and approve the exportable carcass quality,
(3) To investigation poor performance with a view to improve the process of the abattoirs gauging the effectiveness of cleaning procedures,
(4) To assess product against a national and international benchmark.
MATERIALS AND METHODS
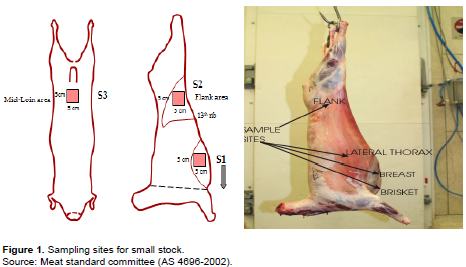
A total number of 180 cotton swapped samples were collected equally from three abattoirs, of which 144 were from thorax, hind and fore limbs, 12 water samples and 12 aprons and 12 employee palm. Samples were collected aseptically in sterile containers and brought to the laboratory within 30 to 45 min using ice box. After collection, bacteriological analysis of the samples were performed to assess the selected microbial attributes such as TPC, CFU and E. coli in goat carcass of different sources by using Plate Count (PC) agar, MacConkey (MC) agar to find out the sanitary quality of goat carcass of Ethiopian Export Abattoirs. Investigations were carried out over the period January to March, 2017, during the production of goat carcass for export. The surface to be examined was swabbed twice using parallel strokes at right angles to the first strokes. Care was taken to swab the whole of the predetermined area. After swabbing, the swabs were transferred to the respective tubes containing the 5 ml of sterile 0.1% peptone water. An area of 100 cm2 marked with a sterile frame of 10 cm × 10 cm on each site of the carcass was rubbed for 30 s and swabs were transferred to a screw-capped test tube containing 10 ml of sterile maintenance medium 0.1% peptone water (Hamdan et al., 2019) (Figure 1).
The research materials included cotton swabs, ice boxes, alcohol, amenities, water, and camera and 12 samples of fresh goat carcass were randomly assessed from 3 major export abattoirs in Modjo areas after carcass was washed and organic acid sprayed and after 24 h chilling. The samples were collected from different portions of carcasses and 36 abattoir employees' hands and apron who engaged in meat washing along with the water they used to wash. The samples were collected once/week from each export abattoir. The samples were aseptically collected in different clean polyethylene bags and were transferred immediately to the laboratory for bacteriological quality assessment. The meat samples were collected in aseptic containers labeled and transported in an ice box for 30 min, subjected to qualitative or quantitative analysis for bacterial zoonotic pathogens indicator organisms.
The data on TPC, CFU and E. coli obtained from the study carcass surface were analyzed in completely randomized design/CRD using SPSS and Excel. Data collated were analyzed using IBM SPSS Statistics version 20 (IBM Corporation, 2011). Simple means, percentages and frequencies were computed. Means were compared using Analysis of Variance (ANOVA) and Chi-squared test was used to determine associations.
Yijk = μ + Ti+ Sj + (TS)ij + Eijk
where Yijk = microbial count, μ = overall mean, Ti = effect of treatment (before and after treatment), and Sj = effect of site (1 = Thorax, 2 = Hind limb and 3 = Fore limb), (TS)ij = interaction between treatment and site, Eijk = random error.
For food control purposes, the organisms in question are often referred to as ‘markers’ of the microbiological quality of food, and they are seen as a key indicator/analytical tool for validating compliance with legislation. Where their occurrence in foods is associated with the possible presence of pathogens that are related to them taxonomically, physiologically and ecologically; they are termed ‘index’ organisms/marker. Here, it refers to any suitable organism that is deliberately added at a pre-determined level to a carcass or item of equipment in a slaughter or processing line in order to determine a possible route of cross-contamination, or to verify that a particular control measure is limiting its spread and the marker organism is one that is readily distinguished from all others present or can be isolated specifically and enumerated on a selective agar medium (Mead, 2007). Total bacterial count load is exemplified by measuring the amount heterotrophic organisms. These organisms can be tested by APC, TPC, TVC or SPC that are acronyms used fairly interchangeably by industry and testing laboratories alike, although TPC is the most common. The total aerobic plate count is useful for indicating the overall microbiological quality of a product and, thus, is useful for indicating potential spoilage in perishable products. The aerobic plate count is also useful for indicating the sanitary conditions under which the food was produced and/or processed (FAO, 2007).
The control of food safety and quality is an integral part of national programs for development. National food control systems are designed to protect the health and welfare of the consumer, to promote the development of trade in food and food products, and to protect the interests of the fair and honest food producer, processor or marketer against dishonest and unfair competition.
Microbiological examination of samples, TVCs and ECs were determined by standard plate count methods according to the criteria specified by ISO 4833:2003. Each sample homogenate swabbing was then diluted decimally in peptone water, and 1 ml aliquots were added to suitable Petri dishes, reaching a 10-6 dilution (TVC) and a 10 dilution (EC). Samples were analyzed within 24 h of collection. The culture media were plate count agar for TVCs and violet red brilliant green agar for ECs. PCA plates were incubated at 37°C for 48 h before colonies were counted. Enterobacteriaceae were incubated at 37°C for 24 h. The detection limit was 0.50 CFU/cm2 for all ovine carcasses.
Water samples 3×4=12 totally from carcass washing were collected for bacteriological analysis according to EC (2007) to estimate the number of Coliform bacilli in 100 ml of water using the presence-absence method. The method was chosen because the focus was the positive detection of E. coli, regardless of quantity; as the guideline for E. coli in drinking water is none per 100 ml, and qualitative results are sufficient for protecting public health (Nouichi, 2009; Verhille, 2013). For more than a hundred years, E. coli and coliform bacteria have been used as bacterial indicators of faecal pollution in water supplies. Currently, total coliform and E. coli are the most common microorganisms used as the primary indicator to assess water quality (Wen et al., 2020). Their use relates to the occurrence of such organisms in the faeces of man and a wide variety of warm-blooded animals, and the fact that the bacterial pathogens of greatest concern in water (Mead, 2007).
RESULTS AND DISCUSSION
The mean result for fresh goat carcass quality as determined for CFU, E. coli and TPC in three abattoirs of 144 samples from the three carcass sites was 1.36, 128 and 1.90 count/cm2, respectively. The upper and lower values are higher for TPC than CFU and E. coli and it was statistically significant at p<0.05. The F-distribution is also highest for TPC (Tables 1 and 2).
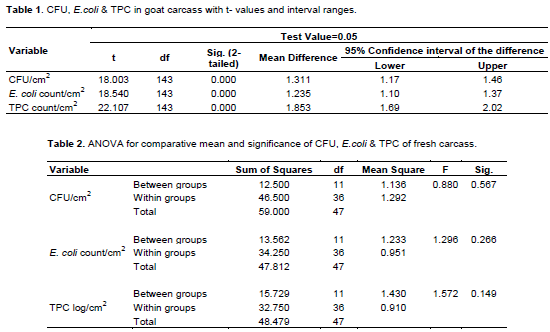
The variability result of between groups due to treatments was smaller than within groups/errors or residues. Statistically remarking the population effect is small/inferior, justifying the difference could be due to chance. The F-test for TPC, E. coli and CFU were small (close to 1.0) indicating least effect, but comparatively higher F test values for TPC and least for CFU.
Table 3 remarked many of the descriptive statistics including the fixed and random effects of CFU, TPC and E. coli in abattoirs 1, 2 and 3. There is significant difference in CFU and E. coli in abattoir 1 but not in TPC log/cm2 mean that is reversed from abattoir 3 to 2 to 1, recommending abattoir 1 HACCP team and top management for due attention in both E. coli and CFU effects though comparatively safe in TPC. The research result warns abattoir 3 that scored higher TPC. There was significantly higher mean (P<0.05) in TPC/cm2 (1.9+1) but least in E. coli/cm2 (1.28+0.8) in the carcass of the abattoirs.
CFU strongly (0.54) correlate with E. coli and weakly correlate (0.21) with TPC. Coliform significantly correlate with E. coli at P< 0.01 and P< 0.05 significant level with TPC. TPC was positively (0.13) correlated with E. coli weakly. So strong correlation in between coliform and E. coli has severe consequence in meat quality and risk in consumers’ health (Table 4).
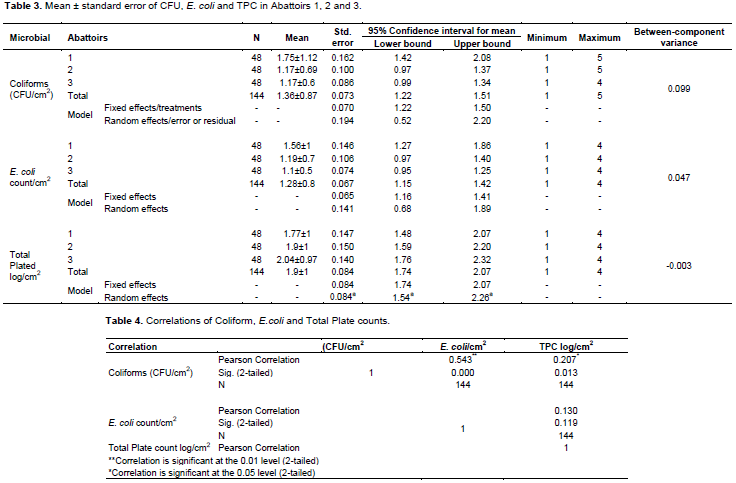
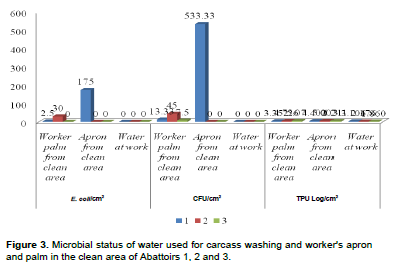
TPC log/cm2 values for the water quality, employee apron and hands in the clean area are shown in Table 5 and ranged from 1.7 to 7.4 with 3.95 mean. There was no detection of CFU and E. coli in the carcass washing water in abattoirs 1, 2 and 3, but significantly higher TPC log/cm2 in abattoir 1 (3.1), abattoir 2 (2.2) and abattoir 3 (1.86), although it was categorically excellent distribution. Comparatively, in abattoir 1, there was higher bacterial contamination since both CFU and E. coli were in marginal category in employee apron working in clean area, followed by abattoir 2 where TPC log/cm2 was marginal category that demands action for strict correction measures of HACCP implementation (Figure 3). Abattoir 1 scored the highest TPC log/cm2 in washed thorax and chilled hind limb, thorax and forelimb that fall in marginal category; followed by abattoir 2 that scored higher TPC, besides to the significant difference in E. coli and CFU in the chilled thorax and hind limb of carcass site. Abattoir 1 scored the highest coliform and E. coli counts/cm2 in the clean area employee apron, followed by abattoir 2 in employee swapped palm. Worker palm from clean area was higher in abattoir 3 followed by abattoir 2 that scored higher counts in the apron from clean area in TPC (Figure 2).
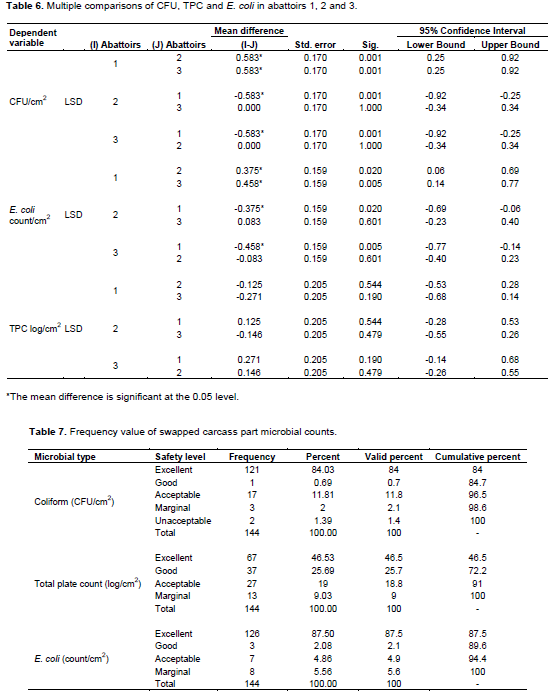
The study resulted in pair wise comparisons of CFU, E. coli and TPC in abattoirs 1, 2 and 3, and there was a significant difference between CFU and E. coli (p < 0.05). The mean difference between each pair was 0.583, 0.458 and 0.207, respectively for CFU, E. coli and TPC (Table 6).
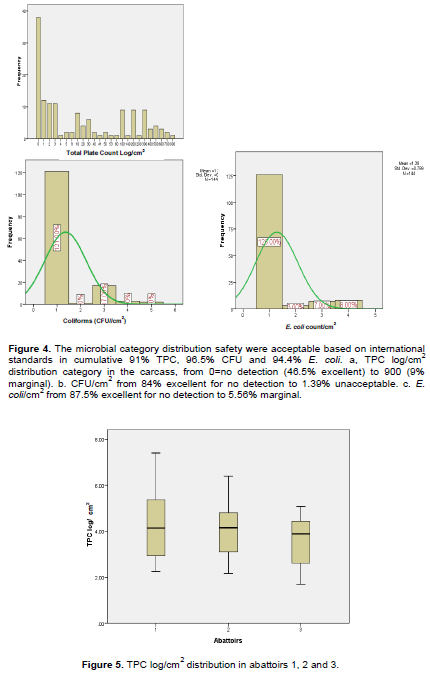
The frequency of E. coli in the carcass was 87.5% that supported the distribution category excellent for no detection (Table 7). The maximum values for CFU/cm2 and E. coli/cm2 were 500 and 800, respectively. The excellent category out weighed in all the bacterial forms followed by good, acceptable and marginal sequentially for TPC, but for CFU, acceptable, marginal and unacceptable were followed. The majority are located in center of normal curve (Figure 4).
When looking at the box plot, the similarities and differences of the three abattoirs in TPC distributions were striking. Comparing the interquartile ranges and quartiles that Abattoir 3 was in the lower 25 percentile and Abattoir 1 stood at the upper 75 percentile of the box plot remarking that the median (center) was roughly similar for TPC log/cm2. The 25, 50 and 75% were 2.84, 3.97 and 4.7, respectively while the mean and standard deviation was 3.94+1.29. Note that the result provides more intuition about variability by interpreting small variability as stability, and large variability as lack of stability. The center of the distribution is more meaningful as a typical value for the distribution when there is little variability (little “noise”) around it. In abattoirs 1 and 2, the length of the whiskers far exceeds the length of the box. A well proportioned tail would give rise to whiskers about the same length as the box, or maybe slightly longer. The box plot indicated that mean TPC log/cm2 increases from abattoir 3 to 1, that the mean TPC log/cm2 was 3.56, 4.03 and 4.22, respectively (Figure 5).
The carcass decontamination effects of TPC log/cm2 in carcass sites displayed in comparative abattoirs 1, 2 and 3. Thoracic area after carcass washing and chilling and hind limb after chilling in abattoir 1, and hind limb after carcass washing in abattoir 2, were the highest in TPC. Figure 7 remarked that abattoir 1 leads thoracic area in many measures of carcass handling procedures that recalling caution particularly chilling room case that HACCP team should implement. There was a drop of TPC load from washing to acetic acid spray to chilling slightly in thorax, hind and forelimb in abattoirs 1, 2 and 3, with the exception in hindlimb of abattoir 1 that contradictively increased from washing to acid spray and chilling, alerting HACCP team and top mangement for correction. In abattoir 1, there was increasing order from washing to acetic acid spray to chilling in the hind limb (Figure 6). TPC log/cm2 declined from washing to acetic acid sprayer, but slightly increased post chilling, warning chillers efficiency.
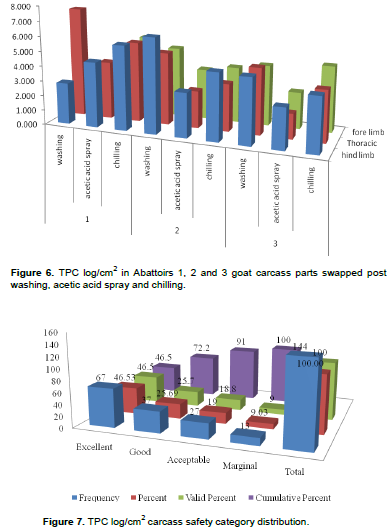
Abattoirs 1, 2 and 3 performance of TPC frequency indicated that the carcass dressing practices were apt and of international standards (Figure 8).
Figure 8 shows that CFU wise, 96.5% of the carcass was safe cumulative wise of which 84% was excellent, 0.7% good, 11.8% acceptable, and 2.1% marginal where action is required. However, apron from clean area in abattoir 1 and acetic acid sprayed and chilled thorax in abattoir 2 in 1/4 sampling days scored 1.39% unacceptable result that is great time to warn the HACCP team and the abattoirs' top management to strictly implement HACCP procedures for quality meat products routinely.
Figure 9, indicated that E. coli wise 94.4% of the carcass was safe cumulatively of which 87.5% was excellent, 2.1% good, 4.9% acceptable and 5.6% marginal. Marginal score resulted in acetic acid sprayed and chilled hind limb at the 1st sampling day, and 2nd sampling day, washed fore limb and thorax, and employee's apron from clean area of abattoir 1; simultaneously employee's palm from clean area of abattoir 2, and in the washed hind limb of abattoir 3 at the 3rd sampling day, that is not acceptable on fresh meat, indicating precautionary measures of meat hygiene along the slaughter and meat handling chains.
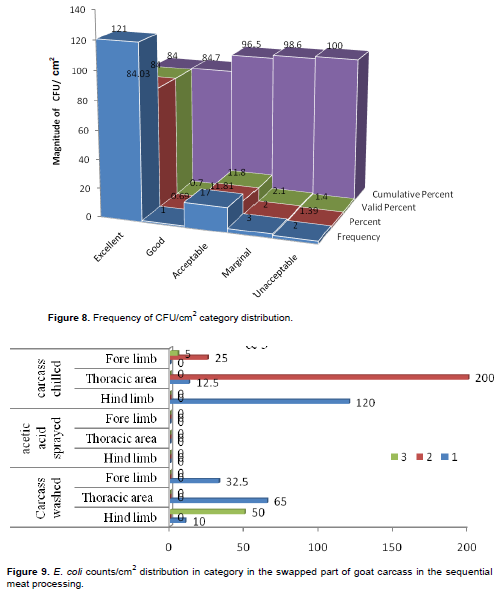
E. coli counts/cm2 in abattoir 2 scored 200 in the thorax post acetic acid sprayed and chilling followed by abattoir 1 of apron in the clean area that scored 175 E. coli/cm2. Thorax post acetic acid spray and chilling more contaminated by E. coli in abattoir 2 thorax followed by hind limb post washing was more contaminated by TPC log/cm2 in abattoir 1.
The rate of carcass contamination was related to the higher contact area by the abattoir employee engaged to move manually goat or beef carcass conveniently by Ahouandjnou et al. (2015). However, Ahouandjnou et al. (2015) in Benin reported that there was 100% unsatisfactory (6.16±0.17) TPC log/cm2 contamination in beef thigh while Zweifel and Stephen (2003) reported high contamination in neck and chest sites that contradict with the Ethiopian export abattoirs' goat carcass contamination mean findings of acceptable category (3.9±0.2 TPC log/cm2), ranged 1.7 TPC log/cm2 in abattoir 3 at the thoracic area after acetic acid spray to 7.4 TPC log/cm2 at thorax after washing. There was no detection of CFU and E. coli in the carcass washing water, but significantly higher TPC log/cm2, although it was categorically excellent distribution. Comparatively, in abattoir 1, there was higher bacterial contamination since both CFU and E. coli were in marginal category in employee apron working in clean area, followed by abattoir 2 where TPC log/cm2 was marginal category that demands action for strict correction measures of HACCP implementation.
The bacterial loads decline from washing to acetic acid spray to chilling in the abattoirs in the carcasses' sampled parts, confirming that the sequential procedures do have vital effects in minimizing the bacterial counts, consistent to Bhandare et al. (2007, 2010) and FAO (2007). The research found meat contamination with significantly higher mean (P< 0.05) of 1.9±1 TPC/cm2 and least in E. coli/cm2 (1.28±0.8) that agreed with research findings of Haque et al. (2008) goat carcass report. On the basis of microbiological standards of raw meat, the finding of the microbial counts was indeed similar to Australian carcass standards that meat from well-controlled processes will usually be in the excellent or good categories, with only occasional departures into the acceptable category. It would be very unusual for these products to have TPC or E. coli count in the marginal category and other count is a trigger for investigating reasons for high counts, and for Corrective Action (AS4696-2002), consistent to this research findings of E. coli wise, 94.4% of the carcass was safe in cumulative of which 87.5% was excellent, 2.1% good, 4.9% acceptable and 5.6% marginal, 91% TPC of the carcass was safe in cumulative of which 46.5% was excellent, 25.7% good, 18.8% acceptable and 9% marginal. Coliforms wise, 96.5% of the carcass was safe in cumulative of which 84% was excellent, 0.7% good, 11.8% acceptable and 2.1% marginal. However, apron from clean area in abattoir 1 and thorax in chiller of abattoir 2 scored 1.39% unacceptable result, which alerts the HACCP team and the abattoirs' top management to strictly implement HACCP procedures for quality meat products routinely. Similar values to those presented in the study were confirmed by Jahan et al. (2015) whose findings stated 40% satisfactory and 32% acceptable for TPC, however, disagreed with 28% rejected resources which is the highest in comparative to our research. Martinez et al. (2010) has reported that most of the samples (63.7%) had TPCs of 4.1 to 5.0 CFU log/cm2, and most of the carcasses (49.8%) had ECs of 1.1 to 2.5 CFU log/cm2. According to the International Standard Organization (ISO 4833: 2003), TPC of 80% of analyzed samples must not exceed 5 log cfu/g, whereas 20% of the samples may have counts of up to 5 log cfu/g.
CFU strongly correlate with E. coli and weakly correlate with TPC. CFU significantly (0.01) correlate with E. coli and at 0.05 significance level with TPC. So strong correlation in between coliform and E. coli could have severe consequence in meat quality and risk in consumers’ health. Haque et al. (2008) found a significant correlation between TPC and CFU that disagreed with the present research findings. The reduction of TPC after treatment in this study may be attributed to proper slaughtering procedures resulting in decreased level of contaminating bacteria (Aftab et al., 2012). However, there could be higher bacteria in chilling in abattoir 1 similar to research conducted by Abdalla et al. (2009) whose findings increased post washing. Jeffery et al. (2003) and Abdalla et al. (2009) found 3.74±0.02 log/cm2 on workers' hands similar to our study findings of workers' hands and apron along with carcass washing water scored TPC log/cm2 3.93±1.29 that was also supported by Jeffery et al. (2003) who confirmed workers' hands and equipments as sources of meat contaminations.
CONCLUSION AND RECOMMENDATION
The study was conducted to investigate the targeted organisms TPC, CFU and E. coli and were with safely acceptable range, but coliform result was unacceptable (1.39%) in abattoir 1 in employee apron in the 2nd visit day and abattoir 2 in the thorax post chilling in the 2nd visiting day that alerts the HACCP team although 96.5% of the carcass was safe cumulative wise of which 84% was excellent. The result confirmed that the bacterial loads decline from washing to acetic acid spray to chilling in three of the abattoirs’ sampled carcass parts, confirming that the sequential procedures do have vital effects in minimizing the bacterial counts. Employee apron and thorax part of the carcass displayed bacterial contamination to alert the abattoirs management. Carcass contaminating bacteria should be determined. Besides to the refreshing training need of abattoir employees, the abattoir supervisors could be source of contamination for they used to wander in and out restlessly with negligence of clean to dirty area routine procedures.
CONFLICT OF INTERESTS
The authors have not declared any conflict of interests.
ACKNOWLEDGEMENTS
The authors are grateful for the collaboration received from the management of the abattoirs where samples were collected, Ethiopian Meat and Dairy Industry Development Institute for providing the required facilities to carry out this research work, and laboratory technician SelamTariku for her supports of sampling.
REFERENCES
|
Abdalla MA, Suliman SE, Ahmed DE, Bakhie AO (2009). Estimation of bacterial contamination of indigenous bovine carcasses in Khartoum (Sudan). African Journal of Microbiology Research 3(12):882-886. |
|
|
Aftab M, Rahman A, Qureshi M, Akhter S, Sadique U, Sajid A, Zaman S (2012). Level of Salmonella in Beef of Slaughtered Cattle at Peshawar. The Journal of Animal and Plant Sciences 22(2):24-27. |
|
|
Ahouandjnou H, Baba-Moussa F, Bonnou J, Dougnon V, Adeoti Z, Yedji R, Toukourou F, Baba-Moussa L (2015). Evaluation of the Microbiological quality of cattle carcasses in some slaughterhouses at Benin, West Africa. International Journal of Scientific Report. |
|
|
AS4696 (2002). Microbiological testing for process monitoring in the meat industry guidelines as of Australian standard for hygienic production and transportation of meat and meat products for human consumption AS4696-2002, section 3.12 requirement. |
|
|
Bhandare S, Ashish MP, Vikas SW, Ravindra JZ (2010). Prevalence of microorganisms of hygienic interest in an organized abattoir in Mumbai, India. Journal of Infection in Developing Countries 4(7):454-458. |
|
|
Bhandare SG, Sherikar AT, Paturkar AM, Waskar VS, Zende RJ (2007). A comparison of microbial contamination on sheep/goat carcasses in a modern Indian abattoir and traditional meat shops. Food Control 18(7):854-858. |
|
|
European Commission (EC) (2007). EC Regulation No 1441/2007 of 5 December 2007 amending Regulation (EC) No 2073/2005 on microbiological criteria for foodstuffs. Official Journal of the European Union L 322/15. |
|
|
Food and Agriculture Organization (FAO) (2007). Food and Agriculture Organization: Statistical database: 2007. |
|
|
Haque M, Siddique P, Habib MA, Sarkar V, Choudhury KA (2008). Evaluation of sanitary quality of goat meat obtained from slaughter yards and meat stalls at late market hours. Bangladesh Agricultural University, Bangladesh Journal of Veterinary Medicine 6(1):87-92 |
|
|
Hamdan MH, Mohamed IMF, Siham ES, Ismail MF, Mohammed ASA (2019). Microbiological Quality of Goat Carcasses at different stages of slaughter in Dallam Island Abattoir. International Journal of Current Microbiology and Applied Sciences 8(3):242-250. |
|
|
IBM Corporation (2011). SPSS Statistics version 20. |
|
|
ISO 4833 (2003). Microbiology of food and animal feeding stuffs. Horizontal method for the enumeration of microorganisms. Colony-count technique at 30°C. |
|
|
Jahan F, Mahbub E-E, Siddique A (2015). Bacteriological Quality Assessment of Raw Beef Sold in Sylhet Sadar. Sylhet Agricultural University, Bangladesh. A Scientific Journal of Krishi Foundation: The Agriculturists 13(2):9-16. |
|
|
Jeffery B, Donald B, Gill O (2003). Implementation of validated HACCP system for the control of microbiological contamination of pig carcass at a small abattoir. Canadian Veterinary Journal 44(1):51-55. |
|
|
Magnus P (1981). Meat composition. Food Science and Technology 14th Ed. Gobumunary Pub. London pp. 108-215. |
|
|
Martinez B, Celda M, Begon A, Ines G, Lopez-Mendoza M (2010). Microbiological Sampling of Carcasses by Excision or Swabbing with Three Types of Sponge or Gauze. Journal of Food Protection 73(1):81-87. |
|
|
Mayr D, Margesin R, Klingsbichel E, Hartungen ED, Jenewein D, Schinner F, Mark TD (2003). Rapid detection of meat spoilage by measuring volatile organic compounds by using proton transfer reaction mass spectrometry. Applied and Environmental Microbioliology 69:4697-4705. |
|
|
Mead GC (2007). Microbiological analysis of red meat, poultry and eggs. Wood head Publishing Limited and CRC Press NY,USA. pp 83-97 and 148-160. |
|
|
Nagarajan V, Wahab A, Shivraj S (2018). Study of bacterial contamination of raw meat in Hyderabad. MOJ Proteomics & Bioinformatics 7(1):46-51. |
|
|
Nega T (2015). SPS & Related requirements of importing countries in middle East, North and West Africa and South East Asia. Societa cooperative a responsabilita limitata (OPERA-Italy) Addis Ababa-Ethiopia. |
|
|
Nouichi S (2009). Superficial Bacterial Contamination of Ovine and Bovine Carcasses at El-Harrach Slaughterhouse. Algeria. European Journal of Scientific Research 38(3):474-85. |
|
|
Sofos JN (2008).Challenges to meat safety in the 21st century. Meat Science 78(1-2):3-13. |
|
|
Verhille S (2013). Understanding microbial indicators for drinking water assessment: interpretation of test results and public health significance. National collaborating centre for environmental health pp. 1-12. |
|
|
Wen X, Chen F, Lin Y, Zhu H, Yuan F, Kuang D, Jia Z, Yuan Z (2020). Microbial indicators and their use for monitoring drinking water quality. A Review Sustainability 12(6):2249. |
|
|
Zweifel C, Stephan R (2003). Microbiological monitoring of sheep carcass contamination in three Swiss abattoirs. Journal of Food Protection 66(6):946-952. |
|
Copyright © 2024 Author(s) retain the copyright of this article.
This article is published under the terms of the Creative Commons Attribution License 4.0


