Barley (Hordeum vulgare L.) is an annual cereal crop which belongs to the genus Hordeum in the Tribe Triticeace of grass family Poaceae which contains about 350 wild species (Amanda, 2008). It is thought that barley has to be originated in the Fertile Crescent area of the Near East from the wild progenitor Hordeum spontaneum over 10,000 years ago (Badr et al., 2000; Blattner and Badani, 2001; Grando and Helena, 2005; Azhaguvel and Komatsuda, 2007; Dai et al., 2012). Barley is a progenitor Hordeum spontaneum over 10,000 years ago (Badr et al., 2000; Blattner and Badani, 2001; Grando and Helena, 2005; Azhaguvel and Komatsuda, 2007; Dai et al., 2012). Barley is a major crop, grown worldwide and in a wide range of climatic conditions; despite its importance as a crop species, little is known about the population genetics of barley and the effects of bottlenecks, adaptation, and gene flow on genetic diversity within and between landrace populations (Leino and Jenny, 2010; Tanto et al., 2010). The crop successfully grows in the arid climates of the Sahara, the Tibetan plateaus, the highlands of the Himalayas, and the Andean countries, the tropical plains of India and the mountains of Ethiopia (Grando and Helena, 2005).
Ethiopia is an important primary and secondary gene center for many field crop species, including barley, which were introduced centuries ago and since then adapted and developed wide genetic diversity (Abdi, 2011). Landraces represent over 90% of the barley cultivated in Ethiopia (Tanto et al., 2010). In Ethiopia barley is the fifth most important cereal crop both in area coverage and production, with around 1,013,623.72 ha and 18,155,830.29 qt respectively (CSA, 2012). It is grown both in Meher (June-September) and Belg (March-April) seasons. The diversity in soils, climate, altitude and topography, together with geographical isolation for long periods, are considered the main factors influencing the large diversity in Ethiopian barley (Harlan, 1976); social factors also play an important part in the diversification, thus, the morphological, biochemical and molecular groups in Ethiopian barley are the result of accumulated long-term mutations, hybridization, gene recombination and natural and human selection in heterogeneous environments (Lakew and Alemayehu, 2011).
In our country Ethiopia to conserve plant genetic resources including barley, the Plant Genetic Resources Centre of Ethiopia (PGRC/E), now the Institute of Biodiversity Conservation (IBC) was established in 1976. The primary mandates of IBC include the preservation of genetic diversity of crop plants, their wild relatives, and native species important to Ethiopian agriculture and biodiversity. Over 65 000 accessions from more than 120 plant species have been collected across the country and preserved ex situ at IBC. This germplasm collection includes a principal base collection of barley with >15,000 accessions (Abdi, 2011). However, most of collected and preserved landraces at the Gene Centre are not yet studied for their morphological diversity (Alemayehu and Parlevliet, 1997; Abdi, 2011). Therefore, this study is proposed with the following objectives:
1. To assess the extent of morphological variation in barley accessions in respect to regions of origin and altitudes of collection.
2. To cluster the accessions into relatively homogenous groups and to identify the major characters contributing to the overall diversity of the germplasm.
Experimental materials
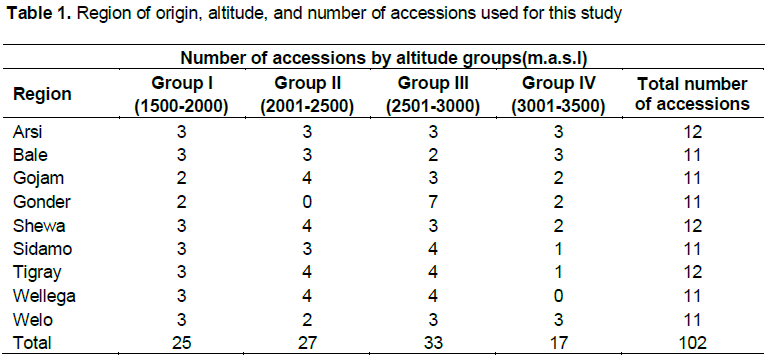
A total of 102 barley accessions were obtained from the Institute of Biodiversity Conservation, Addis Ababa, Ethiopia. The accessions were selected based on their region of origin and altitude (Table 1). Five standard checks (controls) (HB-42, Ardu, Shege, HB1307 and Balami), that were obtained from the Holetta Agricultural Research Center were included (a total of 107 genotypes were used in this study). The region of collection and altitude range is given in Table 1. Five gram of seed (100 kg ha–1) was obtained from IBC for each accession.
Experimental site
The experiment was conducted at the Holetta Agricultural Research Center, Ethiopia, during the main cropping season of 2012 under rain fed condition. Holetta Agricultural Research Center is located at 9° 3’N, 38° 30'E with an altitude of 2400 m.a.s.l. It is 28 km west of Addis Ababa on Ambo road of and characterized with annual rainfall of 1044 mm, mean relative humidity of 60.6% and mean maximum and minimum temperature of 22.1 and 6.2°C, respectively (Figure 1).
Experimental procedures
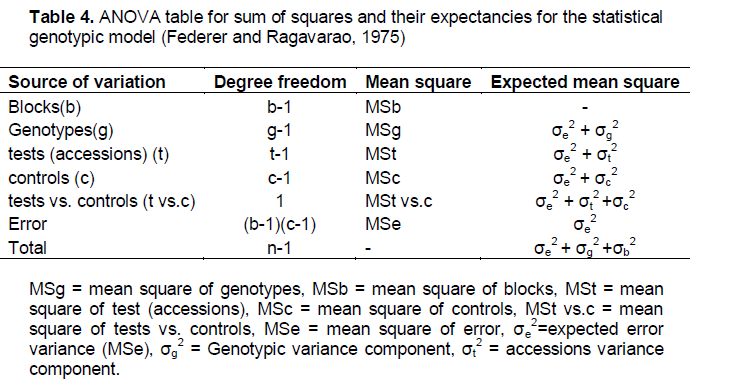
The experiment was laid out in augmented randomized complete block design (Federer and Ragavarao, 1975) consisting of four blocks in which the 102 accessions were planted in un-replicated plots and the five checks were replicated four times (ones in each block) to estimate an error variance. The plot size used was one row with 2.5 m length, and 0.4 m between rows. Seeds were planted by hand with a seeding rate of 100 kg/ha. Plots were kept free from weeds.
Data collection
Based on the IPGRI descriptor list (IPGRI, 1994); ten quantitative and six qualitative characters were recorded (Tables 2 and 3). For each accession, 10 randomly selected individual plants were used for recording quantitative characters, except days to 50% flowering, days to maturity and thousand seed weight, which were recorded on plot basis.
ANALYSIS OF VARIANCE
Quantitative traits
All quantitative data were analyzed using SAS v 9.1.3 Software (SAS, 2004). A mixed model in which standard checks effect were considered as fixed, and accessions effect as random effect, was adopted as:
Yij = μ + αi + βj + eij
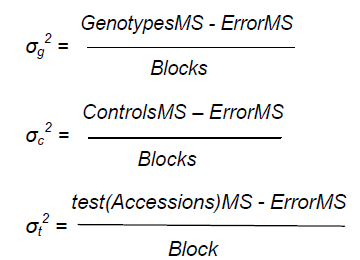
Where: Yij is response variable; μ is general mean, αi is the fixed effect of ith standard checks and random effect of accessions, βj is the random effect of jth block and eij is random errors. Mean squares
were calculated as shown in Table 4. Estimates of σe2, σg2 and σb2 were obtained by equating the obtained sum of squares to their expectancies, and solving the resulting system equations:
Where genotypes = accessions + checks (controls).
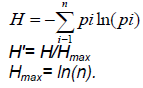
Where: H′= standardized relative diversity index; n = is the number of phenotypic classes per characters; Pi = is the proportion of the total number of entries in the ith class; ln = natural logarithm.
Analysis of variance
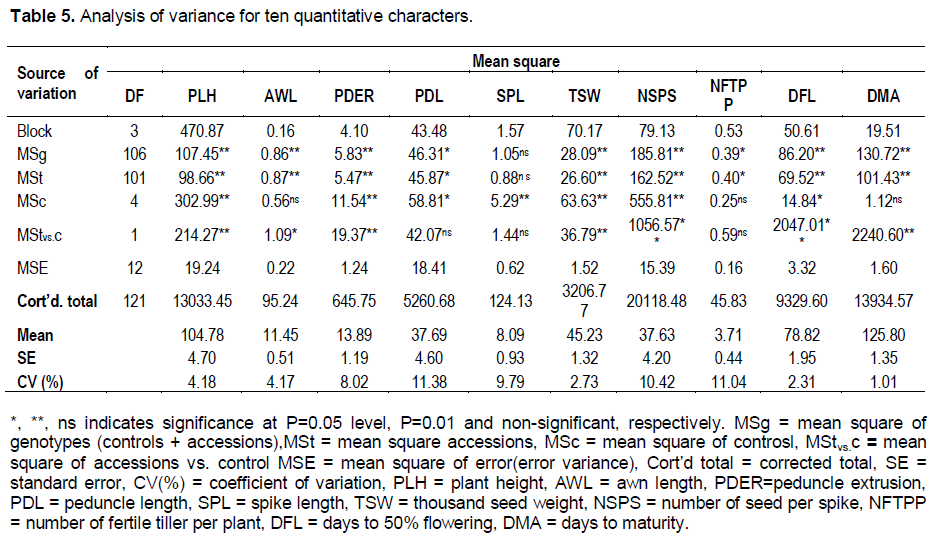
Analysis of variance indicated significant difference (p<0.01) among genotypes, accessions, controls and accessions vs. controls for all quantitative characters except awn length in controls, peduncle length in accessions vs. controls, spike length in genotypes, accessions and accessions vs. controls, number of fertile tiller per plant in controls and accessions vs. controls, and days to maturity in controls (Table 5). Hence, the result indicated the existence of high morphological variation in Ethiopian food barley landraces, in their regions of origin and altitude groups. The same results were reported on morphological diversity of Ethiopia barley landraces by different authors (Tanto et al., 2009; Abay et al., 2009; Eticha et al., 2010; Dejene et al., 2010; Tanto et al., 2010; Muhe and Alemayehu, 2011; Jalata et al., 2011).
Morphological variation within regions
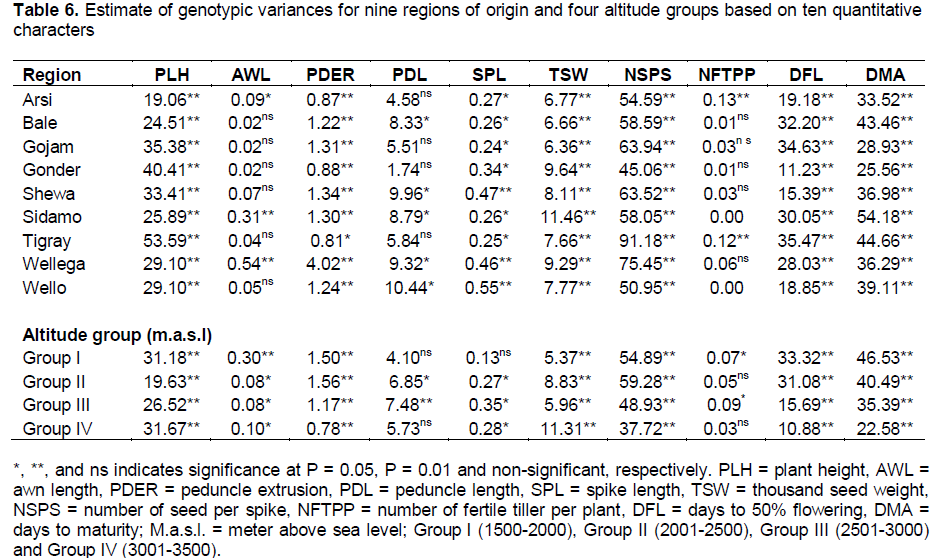
Estimate of genotypic variance for regions of origin among accessions showed highly significant difference (p<0.01) for plant height, peduncle extrusion, spike length, thousand seed weight, number of seeds per spike, days to 50% flowering and days to maturity in all regions. Similarly, awn length from Arsi, Sidamo, and Wellega; peduncle length from Bale, Shewa, Sidamo, Wellega and Wello; number of fertile tillering per plant from Arsi and Tigray significantly varied (Table 6). Analyses of diversity pattern, among accessions from different regions for quantitative characters revealed existence of morphological diversity within regions indicating differences in agro-ecological conditions across regions contributing for the observed morphological diversity. Similar results were also reported in several studies (Negassa, 1985; Demissie and Bjornstad, 1996; Dejene et al., 2010).
Morphological variation within altitudinal gradients
Most of the morphological characters showed significant variation among altitude groups except peduncle length in altitude group I (1500-2000) and IV (3001-3500), spike length in altitude group I and number of fertile tiller per plant in altitude group II (2001-2500) and IV (Table 6). The altitude group III (2501-3000) showed significant genotypic variation for all characters measured. In general, high genotypic variation was observed in an altitude groups II and III, which comprised the major barley growing areas in the country. Similar result was reported by Demissie and Bjornstad (1996) and Dejene et al. (2010) where they found high variation concentration in areas between 2000-3000 and 2400-3000 m.a.s.l. respectively. This high variation attributed to mixed farming system, which is typically found in areas of higher elevation usually above 2000 m.a.s.l. Tanto et al. (2009) also reported the reduction of area of cultivation for barley as altitude decreased which indicated that barley is cool climate crop.
Cluster analysis
Cluster analysis for accessions
Cluster analysis grouped the 102 accessions in to five distinct groups (Table 7). Numbers of accessions per cluster varied from 44 accessions in cluster I to 4 accessions in cluster V. Cluster means and percent of populations (accessions) in each cluster are presented in Tables 7 and 8. Forty four accessions were found in cluster I, which was 43.1% of the total experimental materials. This cluster has been characterized by intermediate plant height, relatively the heaviest thousand seed weight, relatively higher number of fertile tillers per plant, early flowering and early maturity. Accessions grouped under cluster I were scattered along all regions and more at altitude group I (1500-2000) and II(2501-3000). Cluster II accounts 22.6% of the population and included 23 accessions and had shorter peduncle extrusion, longer days to 50% flowering and longer days to maturity. Majority of these accessions were collected at altitude group III (2501-3000) from all regions except Shewa and Tigray. Relatively accessions with shorter plant height, earlier days to 50% flowering, earlier maturity, and smaller thousand seed weight were grouped under cluster III which contribute 17.7% to the population (18 accessions).
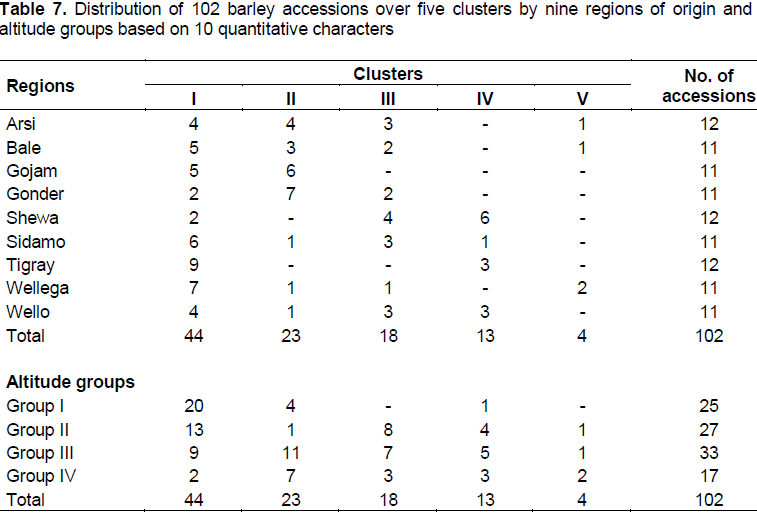
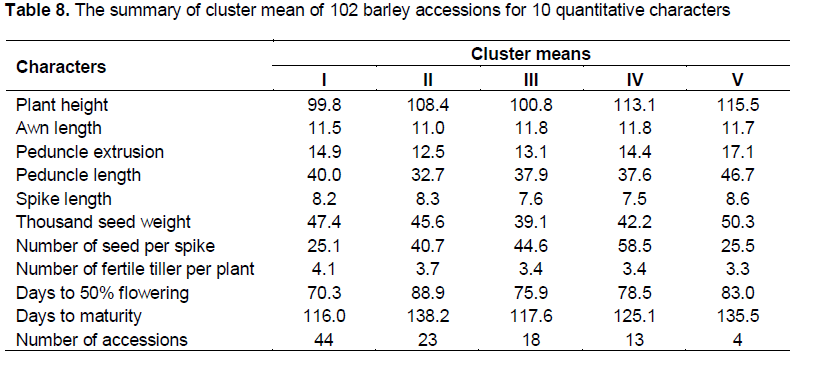
Cluster IV consisted of thirteen accessions, 12.8% of the population, characterized by high number of seeds per spike and moderate in days to 50% flowering and days to maturity; which includes more accessions collected from Shewa and from all altitude groups. This cluster, cluster IV, contains accessions which have high number of seeds per spike and early mature, especially accession number 4879, 243571, 235068 and 242093. Cluster V included four accessions (3.9% of the population) and characterized by taller plant height, longer awn length, peduncle extrusion, peduncle length, spike length, and heavier thousand seed weight, fewer number of seeds per spike, lower number of fertile tillers per plant, relatively late days to 50% flowering and days to maturity, in which accessions were collected from Arsi, Bale and Wellega from altitude groups II (2001-2500), III (2501-3000) and IV (3001-3500).
Although the cluster analysis grouped barley accessions with greater morphological similarity, the cluster did not necessarily included all accessions from the same or adjacent sites. This result is in agreement with the work of Dejene et al. (2010) who reported that, clustering of accessions based on the agronomic characters revealed no distinct regional grouping patterns in which accessions from same or adjacent regions appeared in different clusters.
Clustering indicated that environment had an impact on the performance of barley and specifically altitude had great contribution for the variability of the characters.
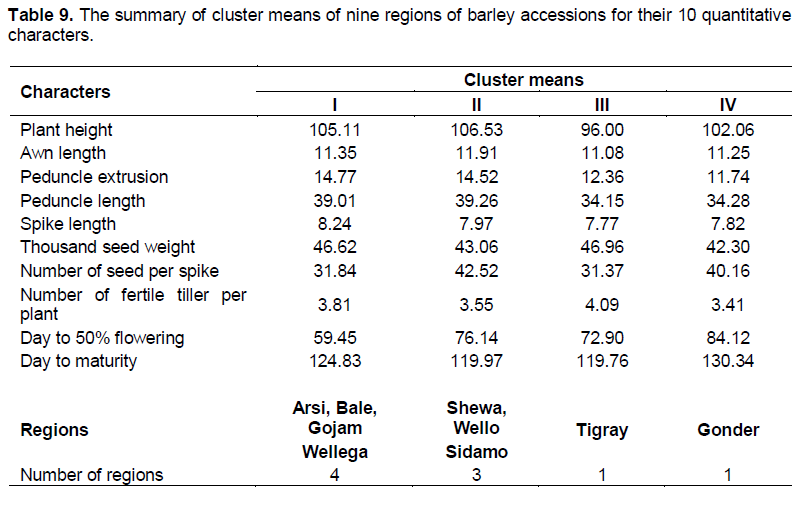
Cluster analysis for regions
Regional cluster analysis grouped the nine regions of barley accessions in to four groups based on 10 quantitative characters (Table 9). Arsi, Bale, Gojam and Wellega grouped in to cluster I characterized with the longest spike length and earlier flowering. Cluster II was characterized with the longest plant height, awn length, peduncle extrusion, peduncle length, and number of seeds per spike, in which Shewa, Wello and Sidamo were grouped in this cluster. The shortest plant height, awn length, peduncle length, spike length, the heaviest thousand seed weight, the lowest number of seeds per spike and the highest Number of fertile tillers per plant were clustered under cluster III, in which Tigray is the source of collection for this cluster. Cluster IV comprised one region (Gonder) which was characterized with shorter peduncle extrusion; longer spike length, smaller number of fertile tiller per plant, delayed flowering and maturity. The same results were reported by Dejene et al. (2010) and Demissie and Bjornstad (1996).
Principal component analysis
Principal component analysis for accessions
The principal component analysis exhibited variances of 30, 17, 15 and 10%, were extracted for the first four principal components and accounts about 72% of total variation (Table 10). Days to 50% flowering, days to maturity, number of seeds per spike and peduncle extrusion showed greater loading for the variation in the first principal components. Similarly, thousand seed weight, days to maturity, spike length and number of seeds per spike contributed major variation in the second principal component. The variation in the third principal component were mainly due to number of fertile tiller per plant, peduncle extrusion, plant height, awn length and peduncle length, while the fourth principal component showed 10% of total variation with greater loading from awn length, plant height and spike length. In line with the present finding, Demissie and Bjornstad (1996) employed principal component analysis for detecting variation in 49 barley populations in which the first four PCs contributed 63% of total variation. Generally days to 50% flowering, days to maturity, and number of seeds per spike were the most loading characters for the variation among accessions.
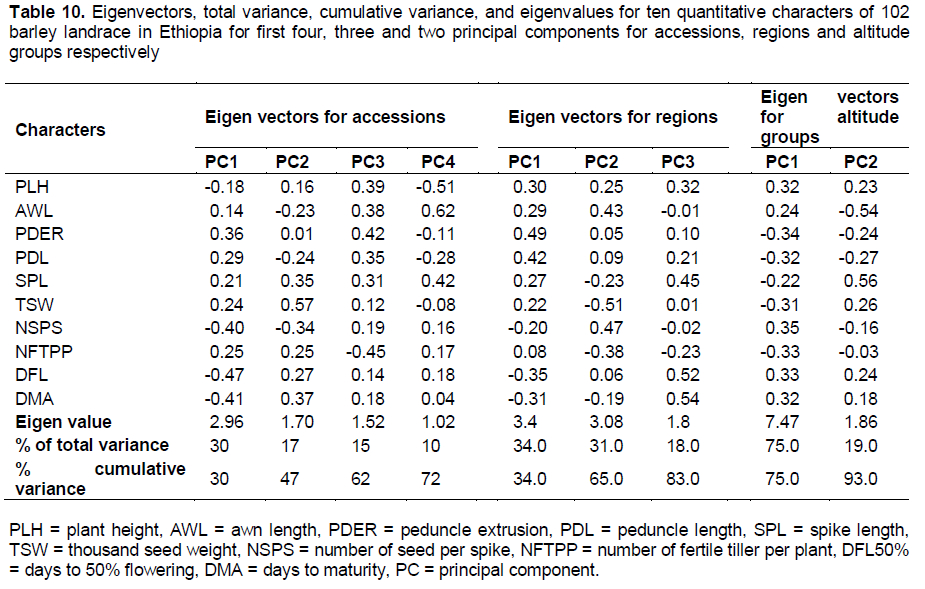
Principal component analysis for regions
Principal component analysis showed that 83% of total variation among regions was extracted for the first three principal components having eigenvalue greater than one (Table 10). Peduncle extrusion, peduncle length, days to flowering, days to maturity and plant height gave the most loading contribution for the variation in first principal component which contributed 34% of the variation. The second principal component contributed 31% of the variation in which thousand seed weight, number of seed per spike, awn length and number of fertile tillers per plant contributed greater variation. Similarly, days to maturity, days to flowering, spike length and plant height were the most loading contributors for the third principal component.
Principal component analysis for altitude groups
The first two principal components extracted 93% of total variation among altitude groups having eigenvalue greater than one (Table 10). Number of seed per spike, peduncle extrusion, number of fertile tiller per plant and days to 50% flowering were the most loading contributors in the first principal component. Similarly, spike length, awn length and peduncle length were showed greater loading in the second principal component.
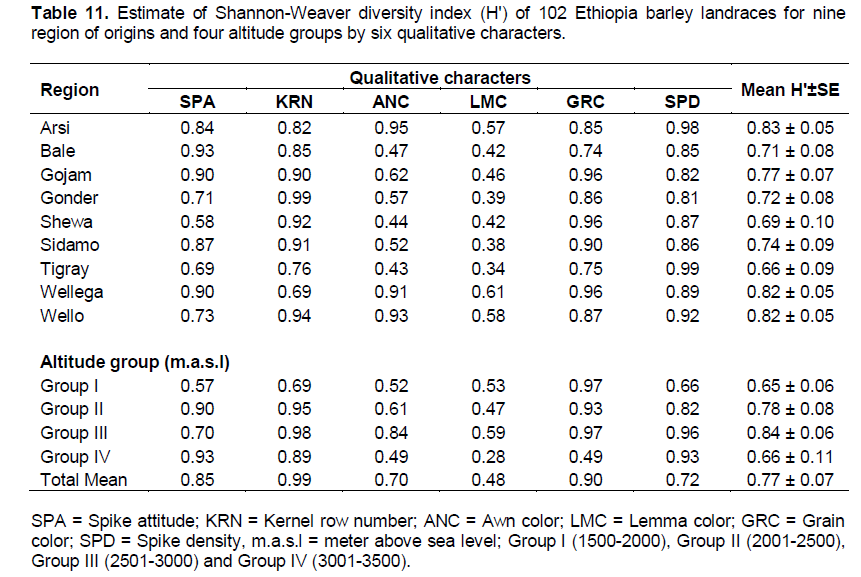
Diversity index
Estimates of Shannon Weaver diversity index over regions of origin and altitude groups showed high diversity index for the six qualitative characters studied. Phenotypic diversity was very high for kernel row number (H′=0.99), grain color (H′=0.90) and spike attitude (H′=0.85) and low for lemma color (H′=0.48) (Table 11). This is due to high ecological heterogeneity of the country, which is favorable condition for barley landrace cultivation. Except lemma color, all characters were high in phenotypic diversity over all regions of origin and altitude groups for this study. The same results were reported by different authors (Demissie and Bjornstad, 1996; Abdi, 2011; Lakew and Alemayehu, 2011).
Regional diversity index
Estimate of diversity index (H') pooled over regions of origin showed high phenotypic diversity among six qualitative characters (Table 11). The mean H' varied from 0.66 for Tigray to 0.83 for Arsi. Arsi, Wellega and Wello showed greater diversity index followed by Bale, Gojam, Gonder and Sidamo. Tigray and Shewa showed lower genetic diversity index. Among all characters, kernel row number from Gonder, grain color from Gojam, Shewa, and Wellega, spike density from Arsi and Tigray showed high genetic diversity index. Lemma color and awn color showed lower genotypic diversity index in most regions.
Altitudinal diversity index
Altitude groups showed high phenotypic diversity among six qualitative characters. The mean H' pooled over characters for four altitude groups varied from 0.65 for altitude group I (1500-2000 m.a.s.l) to 0.84 for altitudes group III (2501-3000 m.a.s.l) with mean value of 0.77 ± 0.07 (Table 11). Kernel row number from altitude group II (2001-2500), and III, grain color from altitude group I and III and spike density from altitude group III and IV (3001-3500) showed the highest diversity index. Altitude group II indicated lower genetic diversity index for lemma color. Difference in altitude gradient and agro-ecological setting gave high diversity variation in cereal crops especially barley landraces. The result indicated high H' in Ethiopia barley landrace in altitude group III (2501-3000 m.a.s.l). Diversity index decreased at an altitude above 3000 m.a.s.l. This result is in agreement with the work of Demissie and Bjornstad (1996) and Abdi (2011). Similarly, mean diversity index for characters increases with altitude reaching a maximum between 2400 and 2800 m.a.s.l and decreasing beyond that altitude (Engels, 1991). This indicates high genotypic diversity in barley is related to high rainfall and lower temperature at high altitudes, which shows barley that is a cool season crop.