ABSTRACT
The sweet popcorn aroma conferred by 2-acetyl-1-pyrroline (2AP) is a highly economic trait of rice grain attracting premium price worldwide. This research study was conducted to determine the levels of 2AP in Ugandan rice lines with the aim of establishing a better understanding on the level and classes of 2AP and aroma phenotype. Concentration of 2AP was assayed using two-dimensional gas chromatography-time-of-flight mass spectrometry (GC × GC-TOF-MS) in tandem with sensory evaluation. Substantial variations in aroma intensity within and between the Uganda rice families were recorded. However, the levels of aroma variation were strongly influenced by the type of rice, and the breeding population it was derived from. Hence, three aroma based categories, namely, nonaromatic, moderately aromatic and highly aromatic were identified. GC with complementary sensory evaluation suggested a highly complex nature of rice aroma, as several rice lines were re-classified on the basis of this study. The 2AP contents and aroma intensity for genotypes with O. glaberrima were low compared to O. sativa and O. barthi. Genotypes of Supa 5, Supa 1052, Yasmin aromatic and MET 3 contained high 2AP levels whereas MET 16, MET 6, AGRA 78, AGRA 55, AGRA 41 and Sande TXD 306 exhibited moderate 2AP contents. Therefore, in developing an optimal breeding strategy aimed at improving the aroma in rice, quantitative information about 2AP and complementary sensory evaluation are a prerequisite.
Key words: Grain aroma, sensory evaluation.
Rice (Oryza sativa L.) is the second most important food crop after wheat worldwide (FAOSTAT, 2017) and it provides approximately 70% of the dietary energy intake for more than two billion people (Sharma et al., 2018). Africa reportedly produces at least 23.8 million tons of rice, approximately 16.4% of the global milled rice production (FAOSTAT, 2017). In Uganda, rice productivity has increased since 1961 from 1.3 to 2.3 t/ha (Kikuchi et al., 2015) with recently estimated total production at 261,620 tons (FAOSTAT, 2017). Even with the recent yield increase mainly due to newly released high yielding rice varieties, the country is unlikely to attain self-sufficiency in rice production by 2025 (Oort et al., 2015). Consequently, research has been focused on improving productivity at the expense of enhancing quality traits of importance to final consumers (Custodio et al., 2016; Asante, 2017).
Rice consumers have diverse preferences for extrinsic and intrinsic quality attributes of the grain (Laizer et al., 2018). With regard to intrinsic sensory attributes, the sweet taste and aromatic characteristics of rice grain are the core traits desired by the majority of consumers (Laizer et al., 2018), and the basis of aroma in rice may be classified as aromatic or nonaromatic rice. Aromatic rice is mainly defined by the concentration of 2-acetyl-1-pyrroline (2AP), a N-heterocycle produced by a mutation in the betaine aldehyde dehydrogenase (badh2) gene, leading to accumulation of 4 aminobutanal, its acetylation and subsequent cyclisation (Daygon et al., 2017). 2-Acetyl-1-pyrroline is a key odorant in aromatic rice, with a very low detection threshold of 0.05 μg/L (Jost et al., 2019). In fact, analysis of 2AP content in several aromatic rice lines found the existence of substantial variation in the aromatic compound content (Xie et al., 2019). Nonaromatic rice was reported to contain 2AP concentration of less than 30 ppb (Buttery et al., 1983) with the highest 2AP concentration of nonaromatic rice 5-fold less than the lowest 2AP concentration of aromatic rice (Sansenya et al., 2018). Interestingly, some aromatic rice lines have been found to have non-detectable levels of 2AP, the implication being that several other compounds are involved in rice aroma (Xie et al., 2019). In addition to 2AP, five (decanal, 2-hexanone, 2-pentylfuran, 1-hexanol, and hexanal) additional volatile compounds have been found to substantially influence the categorization of rice as aromatic and nonaromatic (Hoffmann et al., 2019). Genetic factors are considered the primary contributor towards the aroma of rice grain (Bradbury et al., 2005). In fact, Shan et al. (2015) reported the creation of fragrant rice (with high 2AP content) from a nonaromatic variety by using gene editing technologies, sequence-specific nucleases and transcription activator-like effector nucleases. Despite, the significant influence of genetics on rice grain aroma, several other factors are known to contribute towards the aromatic profile of rice, and the intensity, for example soil salinity (Poonlaphdecha et al., 2012), plant nutrition (Lei et al., 2017), agronomic practices (Goufo et al., 2010), light intensity (Mo et al., 2017) and temperature (Prodhan et al., 2017). The concentration of other biological compounds such as 1-pyrroline has been directly implicated in the biosynthesis of 2AP (Prodhan et al., 2017).
Recently, in Uganda, rice comprising of landraces and introductions are being targeted for improvement of rice aroma using conventional breeding (MAAIF, 2012). Currently, 2AP is the only compound that rice breeders can select to adjust fragrance in rice (Okpala et al., 2018). However, the relationship between the concentrations of 2AP in the different rice lines, especially the landraces was not well understood. Chakraborty et al. (2016) observed variation in the intensity of rice aroma in 84 genotypes within identical genotypes and also among the genotypes from diverse groups. Therefore, the aim of this work was to determine the concentration of 2AP for the rice germplasm collection in Uganda.
Genetic materials used
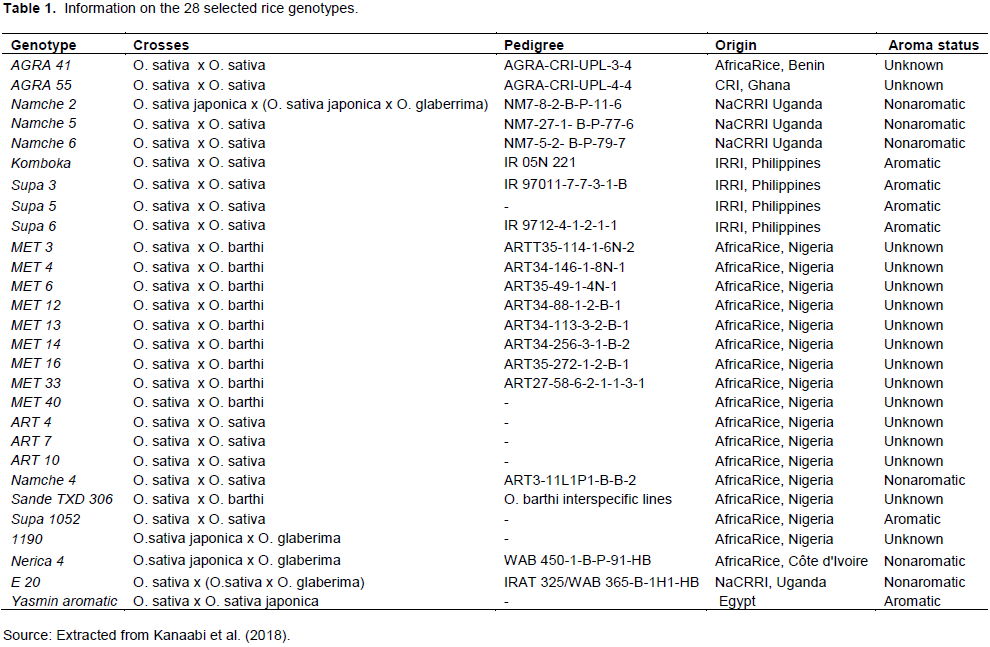
Rice grains (300 g) from each of twenty eight rice genotypes were taken from the East African Regional Rice Research and Training Centre at the Ugandan National Crops Resources Research Institute (NaCRRI), Uganda. The selected rice genotypes included introduced and local lines (Table 1).
Preparation of the polished rice grains
Rice paddy (300 g) was submerged in 1 L distilled water and the empty kernels that floated immediately removed. The clean samples were sun dried by spreading thinly (depth < 1 cm) and evenly on a clean concrete floor for approximately 48 h until approximately 12% average moisture content measured using moisture meter was achieved. The dried grains were milled using lab test mills (Satake, Tokyo, Japan) at Tilda Rice (Uganda) Limited. Fifty grams (50 g) of milled rice samples were vacuum-packed into polythene bags and sent to the University of Queensland, School of Agriculture and Food Sciences, Australia, where they were maintained at -80°C until analysis (Daygon et al., 2017).
Sensory evaluation of the brown rice grain
Seven panelists (7) from the Nutrition and Bioanalytical lab, National Crops Resources Research Institute, Uganda were trained in a 2 h session for 3 days prior to the grain aroma evaluation. Forty grains of each genotype were soaked in 10 ml of 1.7% KOH solution at room temperature in a covered glass Petri-dish for 30 min following the method of Golam et al. (2010). Thereafter, the grain samples were coded and randomized for aroma evaluation immediately after removing the Petri-dish cover by using short sniffs. Four-point category scales (1 = no aroma, 2 = slight aroma, 3 = moderate aroma and 4 = high aroma) were used to measure the intensity of grain aroma.
Assessment of rice grain 2-acetyl-1-pyrroline levels
Assessment of 2AP concentration was performed in the Plant and Food Metabolomics laboratory, School of Agriculture and Food Sciences, The University of Queensland, Australia. Polished rice samples were ground cryogenically using a TissueLyser (Qiagen, Hilden, Germany) and 1 g of flour was placed in autosampler tubes, sealed and frozen at -80°C until analysis. The samples were prepared in triplicate. Once ready for analysis, samples were left overnight at room temperature to equilibrate, and then volatile compounds in the headspace of each sample were analysed by GC×GC-TOF-MS. The sealed tubes were then randomised and analysed in batches of 50. Blank samples were run before analysis of the experimental samples to equilibrate the machine and a quality control (QC) sample was placed at every 10th position in the sample queue. The samples were analysed following previously published method (Daygon et al., 2017). Briefly, the samples were heated to 80°C with agitation for 10 min on a CombiPal Autosampler (Agilent, CA, USA) to volatilise compounds. The headspace (1.5 ml) was collected using a 2.5 ml headspace syringe at 80°C and injected in splitless mode (Pegasus 4D GC×GC-TOF-MS Leco; St. Joseph, MI, USA). The temperature of the GC inlet and transfer line was maintained at 250°C. Separation was performed first on a primary column (Agilent DB-624UI midpolar, 30m x250µ x1.4µ; Agilent, CA, USA) and then on a secondary column which was a Stabilwax (polar, 0.9m x250µ x0.50 µ; Restek, Bellefon, USA). The primary column was initially set to 45°C for 1 min and then ramped at a rate of 10°C/min to 235°C. The secondary column and the modulator were set at 15 and 25°C higher than the primary column, respectively for the entire run. The modulation period was set at 2.5s, with 0.4s hot pulse time and 0.85s cool time between stages. The carrier gas (Helium) was maintained at a constant flow rate of 1 ml/min. Data was acquired using a TOF-MS after a 200s delay with an acquisition rate of 200 spectra/s. The MS scanned analytes within the mass range of 35 to 500 m/z. The ion source was held at 240°C.
Data pre-processing, alignment and noise correction were done using ChromaTof v4.50. Signal to noise ratio was set at 25. The absence of instrument drift and batch effects was verified using the QC samples and technical replicates. Identification of 2AP was done by comparison of retention time and electron ionization (EI) fragmentation patterns of the samples to an in-house mass spectral library created by running authentic analytical standards (Daygon et al., 2017). The relative amounts of 2AP were calculated by measuring the area under the curve of the 2AP peak.
Statistical data analyses
Data were subjected to analysis of variance (ANOVA) using R- statistical software (R Core Team, 2017, Version 3.4.1). Fisher’s protected least significance difference (LSD) was used to separate means at 5% level of significance. Principal component analysis was performed using the grain chemical constituent data to plot and visualize the rice lines based on 2AP abundance and regression analysis conducted using MS Excel Software to determine the proportion of variation in sensory aroma accounted by the change in 2AP abundance. Multiple comparison of the mean concentration of 2AP in 26 rice lines against controls for nonaromatic (NERICA 4) and aromatic (Supa 5) was performed (Rafter et al., 2002). For pairwise comparisons, Dunnett’s t-test was conducted to determine significant (p<0.05) differences between the lines (Dunnett, 1955).
Concentration of 2-acetyl-1-pyrroline in the rice genotypes
Gas chromatography data revealed that the relative amount of 2AP varied from 0.000 to 0.3195 (Table 2).
In ascending order of 2AP, the rice genotypes MET 12, MET 13, Nerica 4, Supa 3, MET 14, E 20, Namche 6, Namche 5, Namche 2, ART 4, Namche 4, MET 40, 1190, ART 7, Supa 6, and MET 4 had significantly (p<0.05) lower relative percentage concentration of 2AP compared to other rice genotypes studied, with the exception of ART 10 and Sande. In this category, the lowest relative percentage amount of 2AP was 0.000 and the highest 0.0531 constituting the category of the lowest 2AP concentration and MET 12, MET 13, Nerica 4, and Supa 3 appeared not to contain any 2AP within their aroma profiles. The genotypes ART 10, Sande and Komboka had significantly (p<0.05) lower relative percentage concentration of 2AP compared to AGRA 41, MET 6, MET 33, AGRA 65 and MET 16. For this second category, the relative percentage concentration of 2AP varied from 0.0642 to 0.1333 with genotypes, Supa 1052 and Yasmin aromatic having significantly (p<0.05) higher relative percentage concentration of 2AP compared to MET 3, Supa 5 and all the other genotypes studied. The category of genotypes with highest 2AP concentration appeared to be distinct from the other genotypes. The GC data revealed substantial variations in the 2AP aroma constituent among different rice genotypes and within the broad categories of rice genotypes from similar geographical sources e.g. MET and Supa came from Nigeria and Philippines, respectively. Variations in the aromatic profile concentration of 2AP among cultivars were reported by Pachauri et al. (2010). Given that the studied 28 genotypes constitute the predominantly cultivated rice in the country, it is evident that the national breeding program has invested less in the development of rice aroma traits. Kanaabi et al., (2018)reported genotype 1190 to be aromatic based on individual grain assessment by chewing following the procedure of Dhulappanavar (1976). The results showed that genotypes 1190, Supa 6 and MET 4 were in moderate aromatic category. Similarly, among the rice genotypes within the moderate 2AP category, MET 16. AGRA 55, AGRA 41 and MET 6 have shown to be in elevated 2AP profile and aromatic category.
Considering the genotypes constituting the family category under AGRA, ART, MET, Namche, and Supa, the Namche family had in general genotypes with the lowest scores of relative percentage fraction of 2AP (Table 2). In contrast, generally, the Supa family of genotypes had the highest scores of the relative percentage fraction of 2AP. The other families of ART, MET and AGRA had scores in between the values for Namche and Supa families. Within the specific rice families, the largest degree of 2AP variation (minimum vs. maximum) was observed among the Supa genotypes and the narrowest degree of 2AP variation was observed among the AGRA and ART families. Considering variation within the Supa genotypes, Supa 1052 and Supa 5 contained high concentrations of 2AP, but Supa 3 genotype had non-detectable levels of 2AP. This finding is inconsistent with earlier reports from several workers who had advanced the idea that all Supa lines, including Supa 3 were aromatic (Kikuchi et al., 2015; Kanaabi et al., 2018. thus, the indiscriminate reliance on the Supa genotypes could offer less desirable outcomes in a conventional breeding programme. The result indicated that the concentration levels of 2AP present in several popular rice genotypes in Uganda suggested that they are nonaromatic, which explains the efforts aimed at improving aroma in the Uganda genotypes lines using newly introduced exotic germplasm (MAAIF, 2012). As GC estimation of the rice aroma intensity was primarily on the levels of 2AP concentration, an important constituent among several other aroma compounds, a more robust aroma profile investigation within the 28 lines was conducted using trained sensory panelists.
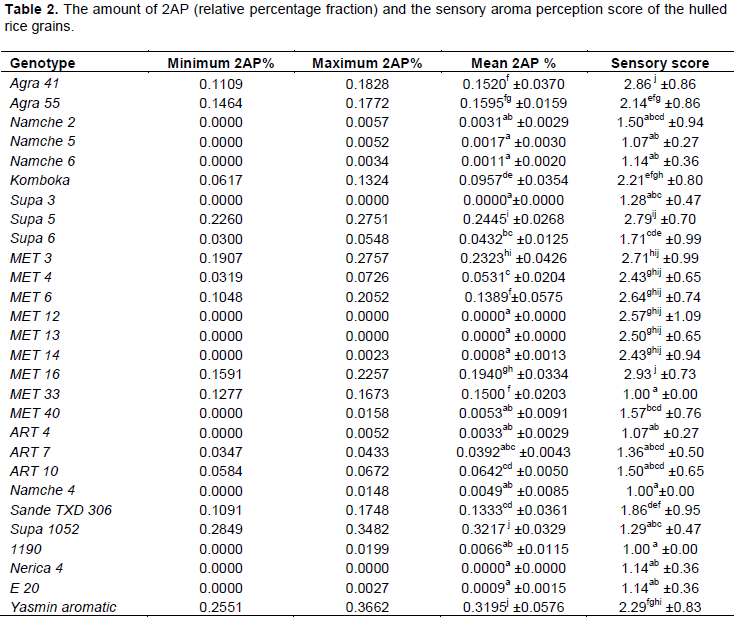
Sensory evaluation scores of the trained panelists revealed that 1190, ART 10, ART 4, ART 7, E 20, MET 33, MET 40, Namche 2, Namche 4, Namche 5, Namche 6, Nerica 4 and Supa 3 had significantly (p<0.05) lower rice aroma intensity compared to the other rice genotypes (Table 2). The category with scores ranging from 1.00 to 1.57 was ranked lowest in regards to rice aroma intensity. The AGRA 55, Komboka, and Yasmin aromatic with scores ranging from 2.14 to 2.29, was ranked second in regards to rice aroma intensity. The third category constituted by AGRA 41 and MET 16 was not clearly differentiated from MET 3, MET 4, MET 6, MET 12, MET 13, MET 14 and Supa 5 which were rated aromatic. In spite of the subjective nature of sensory evaluation, both GC and sensory evaluation determinations established three broad groupings of the genotypes studied in relationship to grain aroma intensity indicating that the trained panels employed in sensory evaluation studies could be more objective than subjective in awarding scores (Chakraborty et al., 2016). Previous aroma evaluation study based on 3 trained panelist with rank (0=non aroma, 1=moderate aroma and 2=high aroma) indicated aromatic rice to score at least 0.67 (Hien et al., 2006). By converting a scale of 1 for nonaromatic to 0 for nonaromatic, the limit for nonaromatic rice of 1.57 reported in this study and 0.67 according to Hien et al. (2006) seems to be comparable. However, the sensory evaluation approach was observed to suffer from a relatively lower discriminatory power in assigning the genotypes lines into the three different categories. This
was probably due to the highly complex nature by which the humans olfactory sense perceive aroma in comparison to simplified chemical assays (Chambers and Kadri, 2013).
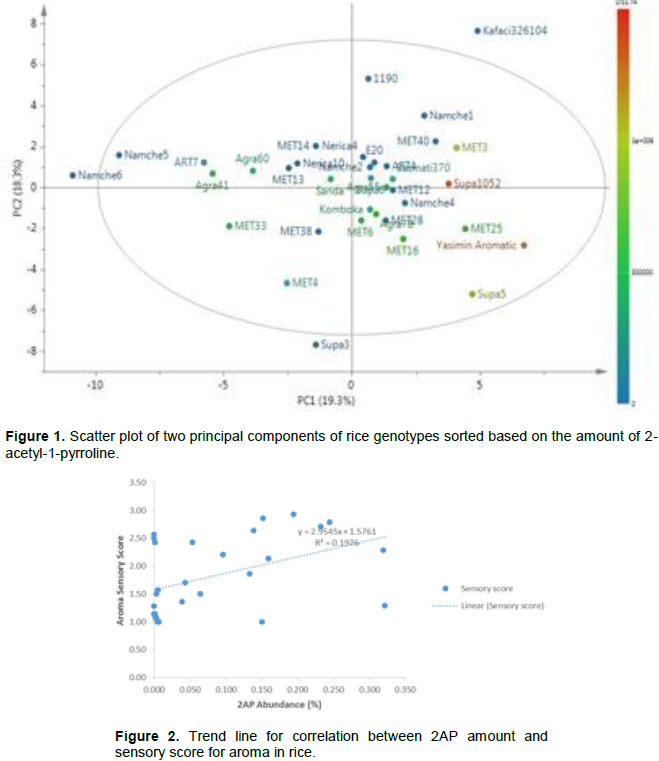
Among the genotypes in the AGRA, ART, MET, Namche, and Supa families, the Namche family had in general the lowest average score (1.18) of aroma intensity and the genotypes constituting AGRA family had the highest average score (2.5) of aroma intensity (Table 1). The genotypes constituting the family under ART, MET and Supa had intermediate average scores of aroma intensity ranked at 1.13, 2.31 and 1.77, respectively. Based on GC results, the largest variation in 2AP (minimum vs. maximum) was observed among the MET lines and the narrowest 2AP variation were exhibited among the genotypes in the Namche and ART families (Table 2). In principle, the result for ranking of genotypes with regard to aroma intensity within and between the families and categories using both techniques were in agreement. However, there were a few instances where the result from GC and sensory evaluation were not in agreement, for example Supa 1052 was rated highly aromatic (mean % = 0.3217) based on GC results and at the same time slightly aromatic (score=1.29) by sensory evaluation indicating the complex nature of aroma (Chamber et al., 2013) suggesting tendency of disagreement in assaying of the group with the widest variation in aroma between the GC and sensory evaluation methods (Chambers and Kadri, 2013). However, in regards to the family with the narrowest variation, fairly the two approaches were more in agreement implying that for genotypes with narrow 2AP scores, the sensory profile appeared to be more easily assayed compared to lines with wide concentration of 2AP. This could be due to the contribution of the other volatile organic compounds (VOC) causing complexity in aroma (Chambers and Kadri, 2013). This complexity account for the variability in 2AP based on two principal axes (Figure 1).
In general, both the GC and sensory evaluation methods tend to agree as indicated by the result from the simple regression analysis (Figure 2).
The results indicate that even when 2AP abundance is zero, the sensory score of up to 1.57 could be recorded by the panelist. This suggests the role of other compounds in rice aroma. The comparison of the two methods pointed out that percentage increase in 2AP of 2.95 would be required to cause a unit increase in aroma sensory score. Based on this study, the 2AP accounted for up to 19.8% of the total variation in sensory aroma perception in the rice grain. This further suggests the role of other compounds in determining the final grain rice aroma. This could be the reason as to why an aroma score of more than one (1) would be recorded in the absence of 2AP. However, the positive and significant (p<0.05) regression coefficient of 0.198 clearly show correlation between sensory aroma and the percentage 2AP abundance in the rice grains.
Aroma classification of the genotypes lines
The result of classification of the genotypes based on the 2AP peak area of the different rice aroma profiles are presented in Table 3.
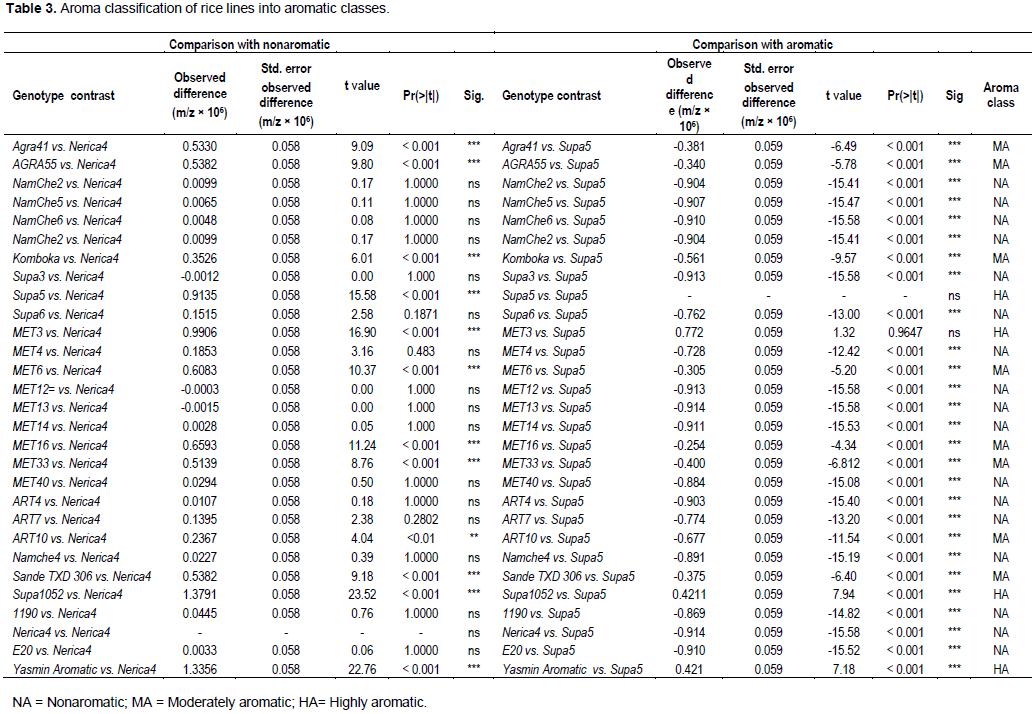
Nerica 4 (aromatic negative control), as compared to AGRA 41, AGRA 55, ART 10, Komboka, MET 3, MET 6, MET 16, MET 33, Sande, Supa 5, Supa 1052 and Yasmin aromatic which had significantly (p<0.05) higher 2AP mass ion abundance in their aroma profiles were classified as moderately aromatic, and MET 3, Supa 5, Supa 1052 and Yasmin aromatic were highly aromatic. Differentiation among the two aromatic sub-classifications was determined by the presence of a significant difference (p<0.05) against Nerica 4 with a simultaneous significant difference (p<0.05) against Supa 5 for moderately aromatic (Dunnet, 1955). For the highly aromatic sub-classification, a significant difference (p<0.05) against Nerica 4 with a simultaneous non-significant difference (p>0.05) against Supa 5 was the criteria used (Dunnet, 1955). With regards to comparisons against Supa 5 (aromatic positive control), all genotypes had significantly (p<0.05) lower 2AP mass ion abundance except MET 3, Supa 1052 and Yasmin aromatic. Thus, aroma based classification of Uganda genotypes using pairwise multiple means comparison also revealed the existence of three broad categories which were clearly defined suggesting that Nerica 4 is a reliable standard reference cultivar for denoting nonaromatic rice lines. Given that earlier workers classified Nerica 4 as aromatic (Kanaabi et al., 2018), the present study highlights the importance of simultaneous chemical assays (GC) with sensory evaluation in classification of genotypes. On the other hand, besides Supa 5 that was used for denoting aromatic genotypes in this study (Kanaabi et al., 2018), it is evident that MET 3, Supa 1052 and Yasmin aromatic can equally be used as aromatic positive controls. Within the genotypes in AGRA, ART, MET, Namche and Supa families, the AGRA and Namche families revealed the least degree of variation in the classification criteria using 2AP ion abundance (Table 3) and the MET family of rice lines had the highest degree of variation in the classification criteria using 2AP ion abundance.
Substantial variations in aroma intensity within and between the Uganda rice families were evident and the levels of aroma variation were strongly influenced by the type of rice family. The three categories of nonaromatic, moderately aromatic and highly aromatic were clearly differentiated. GC in tandem with complementary sensory evaluation indicated the highly complex nature of rice aroma as several rice lines were re-classified on the basis of a more comprehensive analysis. Thus, in developing a breeding strategy aimed at improving the aroma quantitative information about 2AP and sensory evaluation would be required in the future.
The authors declare no conflict of interest regarding the publication of this paper.
The authors are grateful to TILDA Uganda Limited for milling the rice samples prior to shipping for laboratory
analysis at the School of Agriculture and Food Science, University of Queensland, Australia. National Crops Resources Institute (NaCRRI), Uganda is acknowledged for providing the laboratory facilities used to conduct the grain sensory evaluation. Makerere-SIDA programme provided financial support for the research project.
REFERENCES
|
Asante MD (2017). Breeding rice for improved grain quality. Advances in International Rice Research, pp. 69-89.
Crossref
|
|
|
|
Buttery RG, Ling LC, Juliano BO, Jean GTJ (1983). Cooked rice aroma and 2-acetyl-1-pyrroline. Journal of Agricultural and Food Chemistry 31(4):821-826.
Crossref
|
|
|
|
|
Bradbury LMT, Fitzgerald, TL, Henry RJ, Jin Q, Waters DLE (2005). The gene for fragrance in rice. Plant Biotechnology Journal 3:363-370.
Crossref
|
|
|
|
|
Chakraborty D, Deb D, Ray A (2016). An analysis of variation of the aroma gene in rice (Oryza sativa L. subsp. indica Kato) landraces. Genetic Resources and Crop Evolution 63(6):953-959.
Crossref
|
|
|
|
|
Chambers E, Kadri K (2013). Associations of volatile compounds with sensory aroma and flavor: The complex nature of flavor. Molecules 18:4887-4905.
Crossref
|
|
|
|
|
Custodio MC, Demont M, Laborte A, Ynion J (2016). Improving food security in Asia through consumer-focused rice breeding. Global Food Security 9:19-28.
Crossref
|
|
|
|
|
Daygon VD, Calingacion M, Forster LC, De Voss JJ, Schwartz BD, Ovenden B, Alonso DE, McCouchs SR, Garson MJ, Fitzgerald MA (2017). Metabolomics and genomics combine to unravel the pathway for the presence of fragrance in rice. Scientific Reports 7(1):1-12.
Crossref
|
|
|
|
|
Dhulappanavar C (1976). Inheritance of scent in rice. Euphytica 25(1):659-662.
Crossref
|
|
|
|
|
Dunnett CW (1955). A multiple comparison procedure for comparing several treatments with a control. Journal of American Statistical Association 50(27):1096-1121.
Crossref
|
|
|
|
|
FAOSTAT (2017). View (downloaded May 10 2019)
|
|
|
|
|
Golam F, Norzulaani K, Jennifer AH, Subha B, Zulqarnain M, Osman M, Mohammad O (2010). Evaluation of kernel elongation ratio and aroma association in global popular aromatic rice cultivars in tropical environment. African Journal of Agricultural Research 5(12):1515-1522.
|
|
|
|
|
Goufo P, Duan M, Wongpornchai S, Tang X (2010). Some factors affecting concentration of the aroma compound 2-acetyl-1-pyrroline in two fragrant rice cultivars grown in South China. Frontiers of Agriculture in China 4(1):1-9.
Crossref
|
|
|
|
|
Hien N, Yoshihashi T, Sarhadi WA, Thanh VC, Oikawa Y, Hirata Y (2006). Evaluation of Aroma in Rice (Oryza sativa L.) using KOH Method, Molecular Markers and Measurement of 2-Acetyl-1-Pyrroline Concentration. Japan Journal of Tropical Agriculture 50(4):190-198.
|
|
|
|
|
Hoffmann JF, Bassinello PZ, Colombari FJM, Lindemann IDS, Elias MC, Takeoka GR, Vanier NL (2019). Volatile compounds profile of Brazilian aromatic brown rice genotypes and its cooking quality characteristics. Cereal Chemistry 96(2):292-301.
Crossref
|
|
|
|
|
Jost T, Heymann T, Glomb MA (2019). Efficient Analysis of 2-Acetyl-1-pyrroline in Foods Using a Novel Derivatization Strategy and LC-MS/MS. Journal of Agricultural and Food Chemistry 67(10):3046-3054.
Crossref
|
|
|
|
|
Kanaabi M, Tusiime G, Tukamuhabwa P, Andaku J, Ocan D, Jimmy L (2018). Evaluation of rice germplasm reveals sources of bacterial leaf streak disease resistance in Uganda. Journal of Food Security 6(4):163-169.
|
|
|
|
|
Kikuchi M, Haneishi Y, Tokida K, Maruyama A, Asea G, Tsuboi T (2015). The structure of rice retail markets in sub-saharan Africa: The case of Uganda. Tropical Agriculture and Development 59(3):127-139.
|
|
|
|
|
Laizer JS, Baharanyi NR, Tackie DNO, Zabawa R, Kadigi RMJ (2018). Determinants of consumer preference for and expenditure on rice in the Kilimanjaro region, Tanzania. Professional Agricultural Workers Journal 6(1):26-41.
|
|
|
|
|
Lei D, Wang CC, Ashraf U, Mo ZW, Nawaz M, Ashraf I, Muzaff W, Liu SJ, Tang XR (2017). Exogenous application of mixed micro-nutrients improves yield, quality and 2-acetyl-1-pyrroline contents in fragrant rice. Applied Ecology and Environmental Research 15(3):1097-1109.
Crossref
|
|
|
|
|
Ministry of Agriculture Animal Industries and Fisheries (MAAIF) (2012). Uganda National Rice Development Strategy. Entebbe, Uganda: Ministry of Agriculture Animal Industries and Fisheries (MAAIF).
|
|
|
|
|
Mo Z, Lei S, Ashraf U, Khan I, Li Y (2017). Silicon fertilization modulates 2-acetyl-1-pyrroline content, yield formation and grain quality of aromatic rice. Journal of Cereal Science 75:17-24.
Crossref
|
|
|
|
|
Okpala NE, Mo Z, Duan M, Tang X (2018). The genetics and biosynthesis of 2-acetyl-1-pyrroline in fragrant rice. Plant Physiology and Biochemistry 135:272-276
Crossref
|
|
|
|
|
Oort PAJV, Saito K, Tanaka A, Amovin-assagba E, Bussel LGJV (2015). Assessment of rice self-sufficiency in 2025 in eight African countries. Global Food Security 5:39-49.
Crossref
|
|
|
|
|
Pachauri V, Singh MK, Singh AK, Singh S, Shakee NA, Singh VP, Singh NK (2010). Origin and genetic diversity of aromatic rice varieties, molecular breeding and chemical and genetic basis of rice aroma, Journal of Plant Biochemistry and Biotechnology 19(2):127-143.
Crossref
|
|
|
|
|
Poonlaphdecha J, Maraval I, Roques S, Audebert S, Boulanger R, Bry X, Gunata Z (2012). Effect of timing and duration of salt treatment during growth of a fragrant rice variety on yield and 2-acetyl-1-pyrroline, proline, and GABA levels. Journal of Agricultural and Food Chemistry 60(15):3824-3830.
Crossref
|
|
|
|
|
Prodhan ZH, Faruq G, Taha RM, Rashid KA (2017). Agronomic, transcriptomic and metabolomic expression analysis of aroma gene (badh2) under different temperature regimes in rice. International Journal of Agriculture and Biology 19(3):569-576.
Crossref
|
|
|
|
|
Rafter A, John Abell LM, Braselton PJ (2002). Multiple comparison methods for means. Siam Review 44(2):259-278.
Crossref
|
|
|
|
|
R Core Team (2017). R: A language and environment for statistical computing. R foundation for statistical computing, Vienna, Austria.
|
|
|
|
|
Sansenya S, Hua Y, Chumanee S (2018). The Correlation between 2-Acetyl-1-pyrroline Content, Biological Compounds and Molecular Characterization to the Aroma Intensities of Thai Local Rice. Journal of Oleo Science 67(7):893-904.
Crossref
|
|
|
|
|
Shan QW, Zhang Y, Chen KL, Zhang K, Gao CX (2015). Creation of fragrant rice by targeted knockout of the OsBADH2 gene using TALEN technology. Plant Biotechnology Journal 13(6):791-800.
Crossref
|
|
|
|
|
Sharma AK, Singh T, Patel A, Yadav RA (2018). Influence of integrated nutrient management practices on scented rice (Oryza sativa L.) pertaining to eastern Uttar Pradesh. Journal of Pharmacognosy and Phytochemistry 7(5):1448-1453.
|
|
|
|
|
Xie LH, Tang SQ, Wei XJ, Jiao GA, Sheng ZH, Hu PS (2019). An optimized analysis of 2â€acetylâ€1â€pyrroline content diversity in the core collection of aromatic rice germplasm (Oryza sativa L.). Cereal Chemistry 96(4):698-707.
Crossref
|
|