Full Length Research Paper
ABSTRACT
The fruits of the prickly pear (raketa), like most fruits, are mainly made up of water, which limits their storage. The transformation of the fruits into jam or syrup allowed a longer preservation. As part of the valorization and conservation of food products in Madagascar, two products (jam and syrup) have been developed from raketa fruits. The present study focused on the nutritional characterization of raketa fruits and processed products, and the determination of some physicochemical parameters of processed products. The results of the analysis showed that the water content of raketa fruits was 87.76%, meaning a dry matter content of 12.24%. The carbohydrate content was 9.88% relative to the crude matter, the rate of reducing sugars was 25%. The other macronutrients were scarcely present, respectively 0.19% for lipids relative to crude matter and 1.31% for proteins. The energy value of fruits was 46.47 Kcal. These fruits had an almost neutral pH (6.35) and a titratable acidity of 1.0%. The processed products had a dry matter content of 65% for jam and 68% for syrup; the increase in these levels is due to the evaporation of water during cooking. For both products, carbohydrates were the most abundant macronutrients with levels around 65%, regarding reducing sugar contents, they were around 27.77%. Fat and proteins were almost negligible. The ash contents were 0.89% (jam) and 0.99% (syrup). The energy values were 256.51 Kcal for the jam and 266.41 Kcal for the syrup. The pH values were 3.86 (jam) and 4.36 (syrup).
Key words: Opuntia ficus-indica, prickly pear, syrup, jam, brix, Madagascar.
INTRODUCTION
Fruits are one of the most important crop productions (Nout et al., 2003). The production period of many tropical fruits lasts only a few months or a few weeks during which the producers do not always manage to sell their harvests. However, most fruits can only be kept for a few days after harvest, and about 22% of the production is lost (Bantayehu et al., 2019; Umar et al., 2015). Since fruits are easily perishable foodstuffs, effective means must be found to preserve them. The manufacture of drinks, syrup, jams, candied fruits or dried fruits helps to preserve fruit in order to enhance production surpluses and to avoid losses for producers (Rabemananjara, 2003).
According to Montagnac (1960), about fifteen fruits are endemic to Madagascar. According to its agro-climatic potential, Madagascar cultivated most fruit and vegetable species, both tropical and temperate, even if they are almost all introduced. According to Perrier de la Bathie (1921), the first Indonesian immigrants brought coconut, banana, jackfruit and large-fruited lemon; the Arabs (10th and 13th century) brought jujube, mango, lemon, lime, pomegranate, vines, and grapefruit in Madagascar; as for the prickly pear, Opuntia ficus-indica, known by the name "raketa », it was introduced in Madagascar by the first European navigators.
About raketa, the regions of the extreme south of Madagascar are the most productive, with an annual production of 1000 tons for the Androy region, but other regions also produce it such as Analamanga (Ramanampamonjy, 1998). The fruits, which are quite rich in sugars, can be preserved after processing and thus be consumed at a different period of their season. Raketa fruits are the staple food of the people of Androy during the lean season. Generally, the population harvested the fruit from December to May, which is why the study of this fruit and its preservation are of great interest in order to extend its availability throughout the year. From a nutritional point of view, the energy value for 100 g of fresh fruit is 50 Kcal, or 209 kJ (Cota-Sánchez, 2016). Raketa fruits are mainly composed of carbohydrates, in the form of sugars, such as glucose, galacturonic acid, glycosides and rhamnosides (Ginestra et al., 2009). The sugar content of fruits is influenced by environmental factors and cultural practices. Generally, fruits from dry areas are sweeter than those from wet or irrigated areas (Bourhia et al., 2020a). On the other hand, their protein and fat contents are very low, around 1% for both. In addition, the prickly pear is a source of fiber. They are also a source of micronutrients like vitamins especially vitamin C, provitamin A and vitamins of the group B; for minerals, there is a dominant quantity of magnesium (85 mg per 100 g), potassium, calcium and a non-negligible quantity of zinc, iron and copper. They also contained many interesting substances such as antioxidants, phenolic compounds and flavonoids (Cota-Sánchez, 2016).
Apart from their use as a food, these fruits are also used in the development of natural antioxidants, and for the manufacture of dyes (Rabemanantsoa, 2010; Bourhia et al., 2020b); in the preparation of alcoholic beverages from the sieved pulp (Espirad, 2002), in the pharmaceutical and cosmetic fields (Yahia and Saenz, 2011); they can also be stored in cans or frozen (Saenz, 2000; Yahia and Saenz, 2011). The fruits are very popular and give rise to several products, some of which are known and others are recently.
The fruits are rich in sugar with high acidity. They are characterized by their high water content, which allowed the rapid development of microorganisms, thus causing the deterioration of all the qualities, both organoleptic and nutritional. To solve this problem, two preservation techniques (jam and syrup) have been developed to further extend the shelf-life of the product. This solution also contributed to the development of the prickly pear processing sector and perfectly met the needs of the local population who needs it during difficult periods (in terms of nutrition). The objective of the present study was to perform a nutritional characterization of raketa fruits and processed products, and to determine some physicochemical parameters of processed products to assess their quality and their property to be preserved for a possible presentation to the consumer. The study joint the research framework of Laboratory of Biochemistry Applied to Food Sciences and Nutrition (LABASAN) (University of Antananarivo) which is interested in the preservation of fruits and vegetables.
MATERIALS AND METHODS
Sampling
The fruits were collected in the Analamanga region (Antananarivo, Madagascar) in March 2016. Sampling is an essential step, as the representativeness of the analysis results depended on it. The coefficient of variation or "CV" determines the homogeneity of the samples, which must not exceed 10% (AFNOR, 1987; Fermanian, 1991). Data processing was performed with XLSTAT 7.0. The fruits were subjected to the following processes before processing: sorting according to their weight, then washing and peeling.
Determination of nutritional compounds and physicochemical properties of fruits and processed products
Water and dry matter content
Moisture content was determined by oven drying method. This involved removing all of the free water from the sample by drying in an oven at 103°C until a constant weight was obtained (Bizot and Marti, 1991). Five grams of the sample were introduced into a capsule, previously tared, and dried at 103 ± 2°C for 24 h in an oven. Weighing preceded by cooling was carried out at regular time intervals (every hour) until the weight was constant, the amount of moisture was calculated from the resulting weight loss (AFNOR, 1993).
Lipid content
The fat content was determined by extracting the lipids using a solvent. For six hours, the crude fat contained in 5 g of pulp was extracted with hexane using a Soxhlet. The solvent was then removed in vacuo (AFNOR, 1993).
Protein content
The method used was the method of Kjeldahl which consists of assaying the nitrogen contained in the sample, making it possible to determine the total protein content using the conversion coefficient 6.25 (Godon and Loisel, 1991). The mineralization of the product led to the transformation of organic nitrogen into mineral nitrogen in the ammoniacal form (NH4) 2SO’4. This reaction took place due to the oxidative action of H2SO4 boiling on organic matter in the presence of a catalyst, and the reduction of organic nitrogen to ammoniacal nitrogen. The latter was retained in the acid digestate in the form of sulfate. A quantity of 0.3 g of the sample was introduced into each flask and was added to 10 ml of concentrated H2SO4 and a catalyst such as CuSO4, K2SO4, which is used to accelerate the mineralization process. The mineralisate, as well as the rinsing water from the flask, were transferred to the still tube for distillation. A 250 ml beaker containing 10ml of 4% boric acid and two drops of Tashiro (FLUKA, ref.36083-250ML) were placed below the distillate discharge pipe. The distillate collected in the mixture of boric acid and Tashiro's reagent was titrated with 0.1 N H2SO4 until the color changed into light purple. The volume of 0.1 N H2SO4 required for the assay was noted (AFNOR, 1993).
Ash content
In a muffle furnace of a known amount of sample, a quantity of 5 g of pulp was poured into a previously tared incineration pit and then incinerated at 550°C in a muffle furnace for five hours. After cooling, the crucible containing the ashes was weighed and the amount of ash was calculated (AFNOR, 1988).
Total carbohydrate content
The total carbohydrate content of the sample was deduced from the difference between the dry extract content and the sum of the protein, fat and crude ash contents (FAO, 1970; Adrian et al., 1995). The total carbohydrate content was obtained by subtracting from 100 g of dry matter the protein, fat and crude ash content.
GT% = 100% - (L% + P% + C%)
Where: GT% = total carbohydrate content, P% = protein content, L% = fat content, C% = crude ash content.
Reducing sugars content
The amount of reducing sugars needed to reduce an amount of copper dioxide in Fehling’s liquor was determined using a solution of the sample juice. This reduction in Fehling's liquor was made visible by the boiling color change of the blue solution which turned into yellow in the presence of potassium ferrocyanide. A defecation of the fruit must be made before the dosage to avoid a false dosage of sugars. 10 g of the fresh sample were crushed, mixed with 50 ml of distilled water, and then stirred for 15 min. The mixture was then filtered with filter paper and the juice obtained was used for the determination of the reducing sugars. A quantity of 0.6 ml of CARREZ I (Roth, Ref. 9944.1) solution was added to this juice. After stirring, 0.6 ml of the CARREZ II (Roth, Ref. 9950.1) solution was poured into it, and the whole was stirred again. To obtain the defecated solution, filtration was performed. The defecated solution was dosed with 10 ml of Fehling's liquor. As soon as the yellow color appeared, the volume of the defecated solution to reduce Fehling's liquor was noted (Andrianoely, 2013).
Determination of total calorific values
The overall energy value is the energy released by the combustion of fat, carbohydrates and proteins in food. It was calculated according to the method of Greenfield and Southgate (1992), using the ATWATER coefficients (1 g of protein provides 4 Kcal, 1 g of fat provides 9 Kcal, 1 g of carbohydrate (glucose) provides 4 Kcal.).
Degree Brix measurement
The degree Brix (°Brix) of the pulp was determined before its transformation into jam and syrup, and the degree Brix of the transformed products was measured at the end of the cooking process. The measurement was done for each production batch to guarantee consumer safety. The fact that the products have reached sufficient dry matter content ensures their good shelf life. The degree Brix of the pulp was measured using an OPL Refractometer (°Brix from zero to 30). A drop of liquid was deposited on the glass of the Refractometer. The degree Brix was read directly at the scale, at the intersection of the scale and the boundary between the light fringe and the dark fringe. For processed products, the appropriate sugar level was determined using a ZEISS brand Refractometer (°Brix 50 to 90).
Pectin content
Pectins are precipitated by 90% alcohol. A precipitate forms after the action of alcohol with the pectins, and its size allows a good estimate of the pectin content. 5 ml of fruit juice were mixed with 10 ml of 90% alcohol. The whole was then stirred and then left to stand for 2 min. The formation of a gel (for fruits rich in pectins) and the formation of flakes with sediment (for fruits poor in pectins) can be observed (Barbara, 2008).
Determination of titratable acidity
Acidic titration is the titration of all the free and attached H= in acids. Each fruit is characterized by a varying degree of acidity. This acidity is measured by titration with NaOH. It is expressed in milliequivalent (mEq) per 100 g of pulp (Praden, 1985). The principle is based on titration with a sodium hydroxide solution in the presence of phenolphthalein as an appropriate indicator. 20 g of samples were crushed, mixed with 60 ml of distilled water, and then stirred for 15 min. The mixture was then filtered through filter paper and the resulting juice was used for the determination of the titratable acidity. 5 ml of the test sample were taken and added into a beaker, and four drops of phenolphthalein were added to it while stirring. Using a burette, the 0.1 N sodium hydroxide solutions were poured in until a persistent pink color was obtained.
Process applied to jam manufacturing
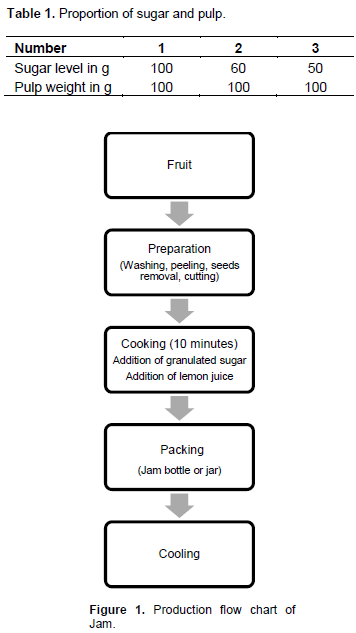
Table 1 shows the different ratios of pulp and sugar. After preparing the raketa fruits, the granulated sugar was added directly to the fruits in the pot and then put on the fire. The cooking time was approximately 10 min. Cooking was stopped after the jam has gelled in contact with a cold container. The sugar level was determined using a Refractometer. Acidification was necessary because the pH of 6.35 of the raketa fruit. For this, lemon juice with a pH between 2.2-2.4 was used (five drops) in order to reduce pH of the product at the level recommended by the standard (Codex Alimentarus, 2009) (pH between 2.8 and 3.9 for jam) for a better conservation. Moreover, the addition of acid at high temperature allowed the inversion of sucrose into fructose and glucose. The jam was put in hot jars; it was necessary to keep the heating under the cooking vessel during the filling in order to keep the jam always hot during packaging. Afterwards, the jam was quickly cooled. Indeed, the degradation of pectin continued if the temperature is maintained between 30 and 40°C which could alter the taste and color of the product (Figure 1)..
Process applied to syrup manufacturing
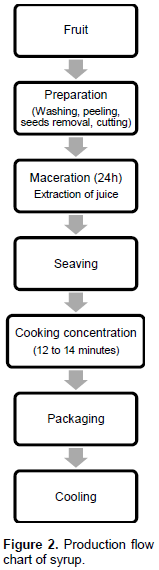
The amount of raketa pulp for making the syrup is 100 g, and the amount of sugar is 150 g. The fruits had undergone the various pretreatments, and then they had undergone an extraction by maceration which consists of letting the fruit cut into pieces rest in a solution of sugar for 24 hours. The difference in osmotic pressure caused the juice to exudate. The juice was then separated by sieving. The juice obtained passed through the process of cooking-concentration. This is the second manufacturing parameter to be taken into account, estimated from the amount of sugar used. The purpose was to remove as much water as possible from the juice so as to obtain concentrated syrup. Cooking was carried out immediately after sieving. The cooking time lasted about 12 to 15 min (2 to 5 min after boiling). For acidification, lemon juice (pH 2.2-2.4) has been added to decrease the pH of the product. Similar to the jam manufacturing, at the end of the cooking process, the amount of sugar and dry matter was determined using a Refractometer (Figure 2).
Microbial analysis
The microbiological quality reflects the safety and good hygiene practice during manufacture (AFNOR, 2002). The germs to be counted are the germs for fecal contamination test and the microorganisms that can spoil the products: Staphylococcus aureus Coagulase positive, Escherichia coli, Bacillus cereus, Yeasts, Salmonella sp. These analyzes were carried out in the microbiological laboratory of ACSQDA Madagascar. The sample analyzed was taken in accordance with aseptic precautions; all the sampling materials were sterilized before and during the manipulation. In a sterile bottle, 25 g of the samples (jam and syrup) were suspended in 225 g of buffered peptone water.
The dilution was done according to the methods described in NF V08-010. A cascade dilution was carried out from the stock suspension. 1 ml of the suspension stock was introduced into a sterile tube, then 9 ml of distilled water was added, this is the 10-1 dilution. 1 ml of this mixture was then poured into another tube containing 9 ml of diluent which corresponds to the 10-2 dilution and so on until the final dilution.
Determination of S. aureus: Coagulase positive
The principle consists of determining the units of colony per gram of sample (cfu/g) after 48 h of incubation at 37°C. S. aureus were determined according to the standardized methods ISO 6888-1 and ISO 6888-2. The inoculum of each of the 3 successive dilutions 10-1, 10-2 and 10-3 were inoculated on the surface in sterile Petri dishes containing beforehand approximately 15 ml of Baird Parker, in which 1 ml of Egg yolk with and 1 ml of Tellurite have been added. After 48 h, S. aureus were determined by the presence of Coagulase positive black colonies.
Enumeration of E. coli
The search for E. coli is very important from a health point of view. It is one of the germs indicative of fecal contamination in food. It is an enterobacterium isolated by ESCHERICH in 1881 which is a normal saprophyte from the intestinal tract of humans and animals. It can become pathogenic for humans under certain conditions. E. coli are among the causative agent of sepsis, diarrhea and also dysentery (Minor and Richard, 1998). The enumeration of all the characteristic colonies was made according to the ISO 16649-1 and ISO 16649-2. The TBX medium is selective for E. coli by the presence of dyes which inhibit the growth of all Gram-positive secondary flora. Among the Gram-negative bacteria, only E. coli produces blue colonies which are retained. Incubation was carried out at 37°C for 24 h.
Determination of B. cereus
The enumeration of B. cereus undertaken for this study was generally identical to the French standard XPV 08-058. The medium used was that proposed by Mossel et al. (1967). 1 ml of stock suspension 10-1 was inoculated on the surface of MOSSEL agar medium in which egg yolk had been previously added. Then the dishes were incubated at 37°C for 24 h.
Determination of yeast
The presence of yeast in food is commonly responsible of its deterioration. The methods described in NF V 08-059 were used in this study. The detection and enumeration of the yeasts were carried out on a SABOURAUD medium. 1ml of the inoculum corresponds to the 10-1 dilution of the stock suspension was inoculated into a Petri dish containing 15 ml of the medium. Seeding was done in depth and then incubated for 24 h at a temperature of 30°C. All the colonies formed were to be counted.
Determination of Salmonella sp
Enterobacteria isolated by Loeffler (1890), this bacterium is a dangerous pathogenic parasite of the intestines of humans and animals. The determination of Salmonella sp was carried out according to the methods NF EN ISO 6579. Rappaport-Vassiliadis selective medium for salmonella was used for enrichment before the culture. After enrichment, the suspension was plated using a selective medium for Salmonella. The genus Salmonella produces blue-green colonies after incubation at 37°C for 24 h.
Statistical analysis
All experimental treatments were done in triplicate. Data obtained from nutritional and physicochemical analysis were analyzed by Minitab 19.1 and differences between ranges of properties were determined using one way ANOVA at 95% confidence level (p<0.05).
RESULTS AND DISCUSSION
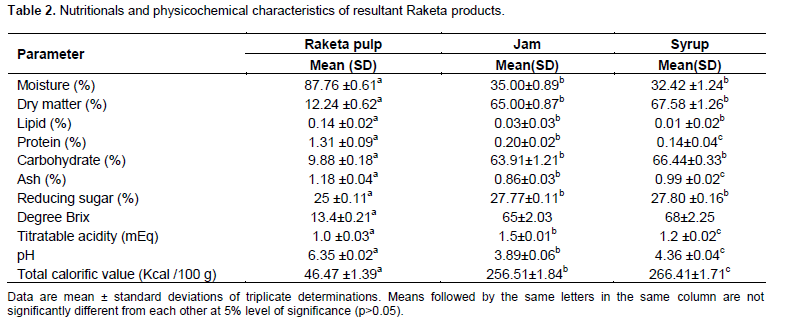
After getting the results of degree brix of all jam products, Treatment 2 (consisting of 60 g of sugar) was the one that was used for the different analyzes. This T2 has degree brix which complies with degree brix standard recommended by Codex Alimentarius (2009). The results of the nutritional and physicochemical analysis of fruits and processed raketa products are recorded in the Table 2.
Nutritional composition
The water content of raketa fruits was high, around 87.76±0.61%. This result is comparable to those of Cota-Sánchez (2016) who found 87.5%. Salim et al. (2009) found a lower value (84.14%); this showed that these fruits are very rich in water. This very high water content of prickly pear fruit is a parameter which reflected the high perishability of this type of fruit and limited its suitability for storage at room temperature (Bouzoubaa et al., 2014). As for the transformation products, the water content was quite low varying around 35%, which allowed better preservation of the products. For jam, this value was close to the water content of fruit jams in general (31.23 to 33.36%) (Mohd Naeem et al., 2015). Moisture content of raketa fruit was significantly higher than derived product (p?0.05).
Raketa fruits contained trace amounts of fat (0.19%). Other studies have found similar values ??(ranging from 0.09 to 0.7%) (Cota-Sánchez, 2016; Salim et al., 2009). They are classified in the category of fruits very low in lipids such as grapes. The exclusive consumption of raketa fruit in the Southeast is inappropriate, as lipids are essential macronutrients in the human diet. In processed products, the fat contents were even significantly lower (p?0.05), varying between 0.01 and 0.03 g per 100 g of raw material. This low lipid content of the jam in this study is confirmed by Food Standards Australia New Zealand (FSANZ) (2018), the jams are generally low in fat. The Raketa fruits were made up of 1.31±0.09% protein for this study. García et al. (2020) found a slightly higher protein (1.62%). The protein content of fruits is low. It decreased further after heat treatment. Most proteins break down during cooking. This explained the decrease in the protein content of jam and syrup. Mohd Naeem et al. (2015) also claimed the low protein content of fruit jams. This low amount of protein in the products is explained by the weakness of the protein potion of the ingredients used in the manufacture process.
The ash content of the pulp was 1.18±0.04%. This value is close to the result found by Cota-Sánchez (2016), Salim et al. (2009) and Garcia et al. (2020). The ash content of the syrup and the jam were respectively 0.99±0.02% and 0.86±0.03%. The value of the jam here is higher than that found by Mohd Naeem et al. (2015) for jams in general (0.12 to 0.2%). A significant decrease (p?0.05) of the amount of ash contents in all the finished products was noted after processing (approximately 0.25%).
Raketa fruits were rich in carbohydrates with a content of 9.88±0.18% of raw matter; they were the most abundant nutrient in these fruits. The total carbohydrate content in processed products was 7 times higher, around 65%. According to Mohd Naeem et al. (2015), jams generally contained a carbohydrate between 65.99 and 67.65%, which is similar to the results obtained in this study. The reducing sugar contents of the two processed products were very similar (around 27.80%), for the fruits it was around 25%. The amount increased significantly after transformation (p?0.05). The change of these levels is mainly due to the fact that during cooking, the water evaporated and the dry matter content increased.
The calorific value of the fruits of the prickly pear found in this study was 46.47 kcal per 100 g of fresh material. According to Santé Canada (2008), this value is average compared to other fruits such as avocado and strawberry, whose energy values are respectively 161 Kcal and 27 Kcal per 100 g of fresh material.
Jams are foods with a fairly high energy value, generally between 266 and 274 Kcal per 100 g of product (Mohd Naeem et al., 2015). The raketa jam produced for this work had a calorific value around 256.71 Kcal. Raketa syrup had a fairly high energy value of 266.41 Kcal (p?0.05). According to the French legislation of 1997, the calorific value of fruit syrup is between 220 and 350 Kcal. Caloric intake, whether for the fruit pulp of the prickly pear or its derived products, is largely provided by carbohydrates, as fats and proteins provide only a small amount of this energy.
Physicochemical properties
It is important to measure the degree Brix when processing fruit. The degree Brix level of the fruit should be adjusted, because the sugar concentration influenced the taste and texture of the products. The degree Brix designated the rate of soluble dry matter. Raketa Fruits had a Brix level of 13.4±0.21. Generally, the degree Brix of the fruits is between 4 and 15, it varied according to the maturity of the fruits and variety. The riper the fruit, the more the degree Brix increased (Monrose, 2009). Raketa fruits generally have a degree Brix ranging from 10 to 17 (Chougui et al., 2013; Cota-Sánchez, 2016; Garcia et al., 2020). The value found during this study was found within this range. The degrees Brix of the jam produced went from 65 and are consistent with the standard which must be greater than 65, according to Codex Alimentarius (2009). That of the syrup was 68; it complied with the standard established by CTA (1999) which must range between 65 and 70 °Brix. It emerged from these results that the soluble dry matter content of the processed products is 4 times higher than that of the pulp (13.4). Compared to the brix of raketa fruit, those of the two products were significantly different (p?0.005). This increase would be due, on the one hand, to the addition of sugar to the mixture and, on the other hand, to the evaporation of water during cooking, resulting in an increase in the sugar concentration in the mixture.
Raketa pulp was relatively low in acid, titratable acidity was 1.0 mEq. Indeed, the pH of prickly pear fruits was close to neutral and is relatively comparable with that of citrus fruits (Kelebek et al., 2008). After processing the fruit, the titrable acidity increased for each product, the addition of citric acid contained in the lemon therefore lowered the pH. Measuring the pH of processed products is essential to guarantee good gelation and consumer safety (Featherstone, 2016). The pH of the jam and syrup were 3.89±0.06 and 4.36 ±0.04 not exceeding 4.5 so the manufacture of jam and syrup made from raketa picked in Antananarivo can be exploited because of their pH which respected preservation standards (between 2.8 and 3.5 for jam; less than 4.5 for syrup) (Codex Alimentarius, 2009; Caetano et al., 2017; Dudez and Broutin, 2001; Martins et al., 2021). To develop a jam, certain basic rules must be respected, in particular the sugar level which must be between 63 and 70 °Brix, sufficient acidity corresponding to a pH not exceeding 4, a sufficient dry matter level at the beginning of the process, but especially the cooking time to avoid the degradation of pectin in order to ensure good gelation. Raketa jam had a sugar degree Brix around 65 which does not exceed the standard (Rahman et al., 2018; Anuar and Salleh, 2019; Kurniawati et al., 2019). Regarding the syrup, the sugar level was 68 °Brix. It is correct, in fact the standard indicated that the sugar level for the syrup must not be less than 65 °Brix and exceed 70 degree Brix (Martine, 1993).
Microbial analysis
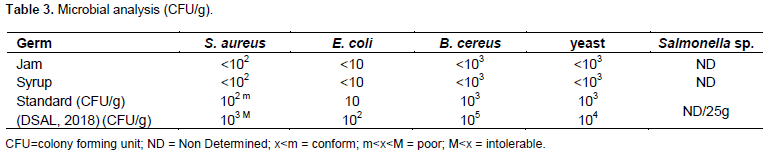
Table 3 shows the results of microbial analysis of the two samples (Jam and Syrup). According to the reference (DSAL, 2018), “m” represents satisfactory concentrations of micro-organisms in the samples, and “M” represents unacceptable or intolerable concentrations of micro-organisms with insalubrious or damage conditions. Between the two parameters, the quality is poor. For each germ tested, the value obtained was below the limit established (bellow “m”), and Salmonella sp. was not found in the selected samples. The results affirm that the conditions of good hygiene practice and safety have been respected during the manufacturing process and the manipulation before and during the analysis. In terms of microbiology, the quality is acceptable for both products (jam and syrup). The low microbial levels may be the consequence of intense heat application during the jam and syrup manufacturing together with low pH and high sugar content (Alokun-Adesanya, 2019).
CONCLUSION
Although introduced long ago in Madagascar, raketa (prickly pear) received little interest in the past apart from the consumption of its fruit and use as fodder. Recent research has since demonstrated the various advantages and potential of its now promising transformation with high added value. At the end of this study, we were able to observe that raketa constitutes an important nutritional resource, especially for arid and semi-arid regions. Although it is an incomplete food: poor in proteins and lipids, its richness in carbohydrates, vitamins and water makes it an interesting remedy food. The syrup and jam made from raketa fruits are products with interesting nutritional, organoleptic and physicochemical characteristics which comply with manufacturing standards.
CONFLICT OF INTERESTS
The authors have not declared any conflict of interests.
REFERENCES
|
Adrian J, Potus J, Franger (1995). La science alimentaire de A à Z. Tec. et Doc., Lavoisier, Paris 2:1-478. |
|
|
Association française de normalisation (AFNOR) (1987). Echantillonnage et contrôle en agroalimentaire. AFNOR Paris pp. 1-543. |
|
|
Association française de normalisation (AFNOR) (1988). Détermination de la teneur en cendres brutes par incinération. Recueil des normes françaises. |
|
|
Association française de normalisation (AFNOR) (1993). Corps gras, graines oléagineuses et produits dérivés. Recueil des normes françaises, Paris 4:1-663. |
|
|
Association française de normalisation (AFNOR) (2002). Microbiologie alimentaire, méthode de routine et évaluation d'une méthode alternative. 8ème edition. Tome 2. |
|
|
Alokun-Adesanya O (2019). Microbial and physicochemical properties of date jam with inclusion of apple and orange fruits. International Journal of Food Science and Nutrition 4(3):102-106. |
|
|
Andrianoely SN (2013). Etude des modalités de séchage de fruits et légumes au moyen du séchoir solaire Boara et qualité alimentaire des produits obtenus. DEA en Biochimie appliquée aux Sciences de l'Alimentation et à la Nutrition, Faculté des Sciences, Université d'Antananarivo pp. 1-73. |
|
|
Anuar N, Salleh RM (2019). Development of fruit jam from Averrhoa bilimbiL. Journal of Food Processing and Preservation 43:13904. |
|
|
Bantayehu M, Alemayehu M, Abera A (2019).Estimation of pre and postharvest losses of tropical fruits in Ethiopia. International Journal of Postharvest Technology and Innovation 6(1):46-56. |
|
|
Barbara I (2008). Making Jams, Jellies and fruit preserves. University of Wisconsin- Extension Cooperative, Wisconsin Safe Food Preservation series pp. 1-26. |
|
|
Bizot H, Marti G (1991). Mesure de l'eau adsorbée dans les aliments: Teneur en eau, activité de l'eau, sorption. In: Multon J. L., Techniques d'analyses et de contrôles dans les industries agroalimentaires: analyses des constituants alimentaires, Paris: Tec. et Doc. 4:1-19. |
|
|
Bourhia M, Elmahdaoui H, Samir, Moussa SI, Ullah R, Bari A (2020a). Potential natural dyes food from the powder of prickly pear fruit peels (Opuntia spp.) growing in the Mediterranean basin under climate stress. Hindawi BioMed Research International pp. 1-9. |
|
|
Bourhia M, Elmahdaoui H, Ullah R, Ibenmoussa S, Shahat AA (2020b). Physicochemical evaluation of the fruit pulp of Opuntiaspp growing in the Mediterranean area under hard climate conditions, Open Chemistry 18:565-575. |
|
|
Bouzoubaâ Z, Essoukrati Y, Tahrouch, S, Hatimi, A, Gharby, S, Harhar, H (2014). Etude physico-chimique de deux variétés de figuier de barbarie (Achefri et Amouslem) du Sud marocain. Les techniques de laboratoire 8(34):137-144. |
|
|
Dudez P, Broutin C (2001). Le sirop de bissap- Production artisanale en Afrique. Ed. Paris, Agridoc (GRET), Pp.1-159. |
|
|
Caetano PK, Farizzani-Machado FM, Nasser FA, Furlaneto KA, Vieites RL (2017). Storage stability of standard and diet figs canned in syrup. Food Sci. Technol, Campinas 37:154-159. |
|
|
Chougui N, Louaileche H, Mohedeb S, Mouloudj Y, Hammoui Y, Tamendjari A (2013). Physico-chemical characterization and antioxidant activity of some Opuntia ficus indica varieties grown in North Algeria. African Journal of Biotechnology 12(3):299-307. |
|
|
Codex Alimentarus (2009). "Codex Standard 296: Standard for Jams," Jellies and Marmalades. |
|
|
Cota-Sánchez JH (2016). Nutritional Composition of the Prickly Pear (Opuntia ficus-indica) fruit. In: Simmonds, M.S.J., Preedy, V.R. (Eds.) Nutritional Composition of Fruit Cultivars. Academic Press 691-712. |
|
|
CTA (1999). Le sirop de tamarin, aperçu de la filière fruits au Sénégal. Dossier d'information pour les PME d'Afrique qur la transformation agro-alimentaire pp. 1-222. |
|
|
Espirad E (2002). Introduction à la transformation des fruits. Lavoisier Tec et Doc: Sciences et techniques agroalimentaires pp. 1-360. |
|
|
FAO (1970). Pour mieux se nourrir (guide à l'usage de l'éducateur à Madagascar). FAO pp. 1-128. |
|
|
Featherstone S (2016). A Complete Course in Canning and Related Processes. Woodhead Publishing Series in Food Science, Technology and Nutrition 3:313-349. |
|
|
Fermanian J (1991). Méthodes statistiques. KAMOUN P. Appareils et méthodes en Biochimie. Paris: Flammarion pp. 319-323. |
|
|
FSANZ (2018). Nutrient Table for Use in Australia. Récupéré sur Food Standards Australia New Zeland: |
|
|
García FH, Coll LA, Cano-Lamadrid M, Lluch DL, Barrachina CÁ, Murcia PL (2020). Valorization of Prickly Pear [Opuntia ficus-indica (L.) Mill]: Nutritional Composition, Functional Properties and Economic Aspects. Intechopen pp. 1-16. |
|
|
Ginestra G, Parker ML, Benett RN, Robertson J, Mandalari G, Narbad A (2009). Anatomical, chemical, and biochemical characterization of cladodes from prickly pear [Opuntia ficus-indica (L.) Mill.]. Journal of Agricultural and Food Chemistry 57(21):10323-10330. |
|
|
Godon B, Loisel W (1991). Dosage des protéines. In: Multon J., Analyses des constituants alimentaires, Paris, Tec. et Doc. Lavoisier, 4:201-216. |
|
|
Greenfield H, Southgate DAT (1992). Food composition data. New York: Chapman and Hall pp. 1-236. |
|
|
Kelebek H, Kanbas A, Selli S (2008). Determination of phenolic composition and antioxidant capacity of blood orange juices obtained from cvs. Moro and Sanguinello (Citrus sinensis (L.) Osbeck) grown in Turkey. Food Chemistry 107(4):1710-1716. |
|
|
Kurniawati EC, Husamah, Latifa R, Zaenab S, Permana TI, Fauzi A (2019). Making Eucheuma cottonii Doty jam with various palm sugar concentrations. Internation Conference on Life Sciences and Technology 276 p. |
|
|
Martine F (1993). Transformer les fruits tropicaux, Guide technique « Le point sur les technologies». Edition du GRET, Ministère de la coopération, CTA, ACCT, Paris pp. 1-222. |
|
|
Martins MP, Geremias-Andrade IM, Ferreira LS, Brito-Oliveira, Pinho SC (2021). Technological and sensory feasibility of enrichment of low-sugar mango jams with curcumin encapsulated in lipid microparticles. Food Science and Technology Campinas 41(1):74-81. |
|
|
Minor L, Richard C (1998). Méthodes de laboratoire pour l'identification des entérobactéries. Paris: institut Pasteur 217 p. |
|
|
Mohd Naeem MN, Mohd Fairulnizal MN, Norhayat MK, Zaiton A, Norliza AH, Wan Syuriahti W (2015). The nutritional composition of fruit jams in the Malaysian market. Journal of the Saudi Society of Agricultural Sciences pp. 1-8. |
|
|
Monrose GS (2009). Standardisation d'une formulation de confiture de chadèque et évaluation des paramètres physico-chimique, microbiologique et sensoriels. Mémoire de fin d'études agronomiques, Université Université d'Etat d'Haiti pp. 1-156. |
|
|
Montagnac P (1960). Les cultures fruitières à Madagascar en 1960. Institutions des recherches agronomiques à Madagascar 1(9):1-146. |
|
|
Nout R, Hounhouigan JD, Bockel TV (2003). Les aliments: transformation, conservation et qualité. Backhyus Publishers, CTA, pp. 1-268. |
|
|
Perrier de la Bathie H (1921). La vegetation à Madagascar. Annales de géographie (174):465-484. |
|
|
Praden M (1985). Qualité gustative de l'abricot, Recherche de critère objectif. ENITAH-Angers 1-39. |
|
|
Rabemananjara (2003). Valorisation des fraises d'Ambatofotsy - Technologie et études comparatives des sirops de fraise. Mémoire Ingéniorat, Département Industries Agricoles et Alimentaires, ESSA, Université d'Antananarivo, pp. 1-71. |
|
|
Rabemanantsoa NA (2010). Actions pour une meilleure valorisation des Cactus Opuntia (Raketa). Mémoire pour l'obtention de diplôme d'ingénieur, Département Agriculture ESSA Université d'Antananarivo, 1-45. |
|
|
Rahman TU, Amanullah, Tahir N, Wahaab S, Tahir A, Rahman AU, Khan A (2018). Evaluation and preparation of guava jam stored at ambient temperature. Pure and Applied Biology 7:1064-1073. |
|
|
Ramanampamonjy FR (1998). Détermination de la valeur nutritionnelle de fruits de 3 espèces de Cactus Opuntia (raiketa notsika, raiketa kopaka, raiketa mena). Mémoire de fin d'étude pour l'obtention du diplôme d'études approfondies de sciences biologiques appliquées, Biochimie appliquée aux sciences de l'alimentation et à la nutrition pp. 1-73. |
|
|
Saenz C (2000). Processing technologies: an alternative for cactus pear (Opuntia spp.) fruits and cladodes. Journal of Arid Environments 46:209-225. |
|
|
Salim N, Abdelwaheb C, Rabah C, Ahcene B (2009). Chemical composition of Opuntia ficus-indica (L.) fruit. African Journal of Biotechnology 8(8):1623-1624. |
|
|
Santé Cananda (2008). Valeur nutritive de quelque aliments usuels Otawa. Santé Cananda pp. 1-19. |
|
|
Umar LA, Lui Y, Khalid M, Muhammed KB (2015). An econometric estimation of postharvest losses Kinnow in Pakistan. International Journal of Economics, Commerce and Management 3(5):773-783. |
|
|
Yahia EM, Saenz C (2011). Cactus pear (Opun tia species). Woodhead Publishing Limited pp. 291-329. |
|
Copyright © 2024 Author(s) retain the copyright of this article.
This article is published under the terms of the Creative Commons Attribution License 4.0


