Full Length Research Paper
ABSTRACT
Cashew apple bagasse (CAB) constitutes waste in cashew apple conversion in juice industries. This study focused on modelling an optimal condition of antioxidant activity of CAB, in view of valuing it. The response surface methodology through a Box-Behnken design was used to evaluate the effects of three factors influencing antioxidant component extraction. The factors are ethanol proportion of solvent (X1), sample/solvent ratio (X2) and time (X3). Non-toxic solvents (water and ethanol) were used for extraction. Results of the 15 runs show that polyphenol, flavonoid and tannin content varied from 3.12- 7.44 mg GAE/g CAB; 4.28- 14.99 mg QE/g CAB and 1.95- 9.25 TAE/g CAB respectively. The yield of ABTS radical scavenging varied from 22.9-75.9%. The DPPH 50% inhibiting concentration (IC50) varied from 2.28-26.97 mg/ml. Optimal polyphenol and tannin levels (7.44 mg GAE/g CAB and 9.25 mg TAE/g CAB respectively) were achieved using 50% ethanolic solvent. That of flavonoids was reached with the solvent 100% ethanol. Optimal antioxidant activity was reached using 50% ethanolic solvent for both ABTS and DPPH tests (75.9% and 2.28 mg/ml respectively). Statistical analysis showed that time has had no significant effect. Optimal condition of phenolic compounds extraction endowed with antioxidant property consists to macerate CAB powder in 46.1% ethanolic solvent at ratio of 9.5 g/100 ml for 6 h.
Key words: Cashew apple bagasse, non-toxic solvent, antioxidant activity, Box-Behnken design.
Abbreviation: CAB, cashew apple bagasse; GAE, gallic acid equivalent; QE, quercetin equivalent, TAE, tannic acid equivalent; EtOH, ethanol; ABTS, 2,2’-azinobis (3-ethyl-benzothiazoline-6-sulphonic acid; DPPH, 1,1-diphenyl-2-picryl-hydrazyl.INTRODUCTION
Much pathology such as cancer, diabetes or cardiovascular diseases is caused by oxidative stress resulting from free radicals (Phaniendra et al., 2015). These latter are produced at the end of uncontrolled metabolic processes of the body aerobic cells. These are among others superoxide (O2•-), hydroxyl (OH•), alkoxyl (RO•) or peroxyl (ROO•) radicals (Sarr et al., 2015). During last recent decades, the prevalence of above-mentioned pathologies has been steadily increasing. In response, research has shown that the antioxidant property imparted by phenolic compounds to certain fruits is able to protect against oxidative stress (Oroian and Escriche, 2015). Thus, due to the high cost of care, ingestion of functional foods has found an important place in the diet of populations (Wani et al., 2016).
In fact, it has been reported that antioxidant compounds are associated with some properties particularly anticancer, cardio protective and anti-allergenic. Also, they have beneficial effects against chronic degenerative diseases such as cataract, macular degenerative, neurodegenerative disease, diabetes mellitus as well as aging process (Phaniendra et al., 2015). For this, synthetic antioxidant compounds like butylated hydroxyanisole (BHA), butylated hydroxytoluene (BHT), propyl gallate (PG) or tert-butyl hydroquinone (TBHQ) have long been used in food industries. They are used as additives and/or preservatives for their stability and lower cost, in order to retard oxidation reactions (Blasi and Cossignani, 2020). However, as mentioned by Lourenço et al. (2019), animal studies showed that BHA and BHT would be responsible for carcinogenesis and would cause undesirable effects on the liver. Use of natural antioxidants is therefore the privileged alternative. For this, many natural source have been reported among those is cashew apple (Andrade et al., 2015; Kaprasob et al., 2017). Cashew apple is the pseudo-fruit of cashew tree, a tropical fruit tree of Brazilian origin belonging to the Anacardiaceous family (Oliveira et al., 2019). Long devalued for its astringency and high perishability, it currently enjoys particular interest both in research and in the agro-industry because of its excellent functional properties. Moreover, scientific studies have focused on optimizing the extraction of its phenolic compounds which can be affected by several factors. The most important of them include the sample to solvent ratio, the type of solvent used, temperature, speed of agitation or time. Most of these work used toxic solvents such as methanol or acetone which are not suitable for human consumption (Andrade et al., 2015; Felix et al., 2018). The objective of this study consists in modelling an optimal antioxidant activity of CAB obtained after pressing apples for juice extraction, using non-toxic and environmentally friendly solvents.
MATERIALS AND METHODS
Biological material is constituted of CAB obtained after pressing apples for juice extraction. Thus, 580 kg of cashew apple were harvested in March 2021 in an orchard of N’dakouassikro, a village located to twenties kilometer from the city center of Yamoussoukro, political capital of Ivory Coast.
Solvents and reagents
All solvent and reagents used are analytical grade except technical ethanol (EtOH) 96%. There are: Folin-Ciocalteu and vanillin from Carlo Erba (France), methanol 99.6% from Honeywell (Germany), sodium nitrite (NaNO2) from Merck (Germany), aluminum chloride (AlCl3) from VWR International (Belgium), ABTS from Alfa Aesar (Germany), DPPH and gallic acid from Sigma Aldrich (USA), sodium carbonate (Na2CO3) from AppliChem (Germany), sodium hydroxide (NaOH) from Fischer Scientific (United Kingdom) and distilled water.
Equipment
Equipment used is composed of hydraulic press V. Stossier (Austria), electric dryer (China), Forplex hammer mill equipped with a sieve of 250 µm diameter (France), magnetic stirrer RS Lab 1C (France), ventilated oven Memmert UF55 (Germany), UV/Vis spectrophotometer Jasco V-530 (Japan), Radwag PS 750/X (Poland) and Sartorius Practum 213-1S (Germany) scales and a Merit water still W4000 (United Kingdom).
Production of CAB powder
During the harvest, apples were separated from the nuts in situ, and then convoyed to the school-factory located to the Centre site of Institut National Polytechnique Houphouët-Boigny (INPHB) of Yamoussoukro. Apples were washed five times in a row, the third time in 100 mg/L bleach for 10 min about. Juice was extracted by pressing apples using hydraulic press. The derived bagasse was dried at 55°C for 24 h. Then, dried bagasse was milled. Powder was conditioned in a glass bottle and preserved for further analysis.
Extraction of phenolic compounds
Extraction was carried out by maceration following the method described by Bohui et al. (2018) with modification. Water and EtOH were used as extraction solvents. A mass M of CAB powder was mixed with 100 ml of solvent whose proportion of ethanol is C. The mixture was kept stirring at 500 rpm for a time T. After stirring, extract was filtered twice through a mousseline cloth, then oven dried at 50°C for 24 ± 4 h. The dry extracts were kept in glass bottles until related analysis.
Experiment designing
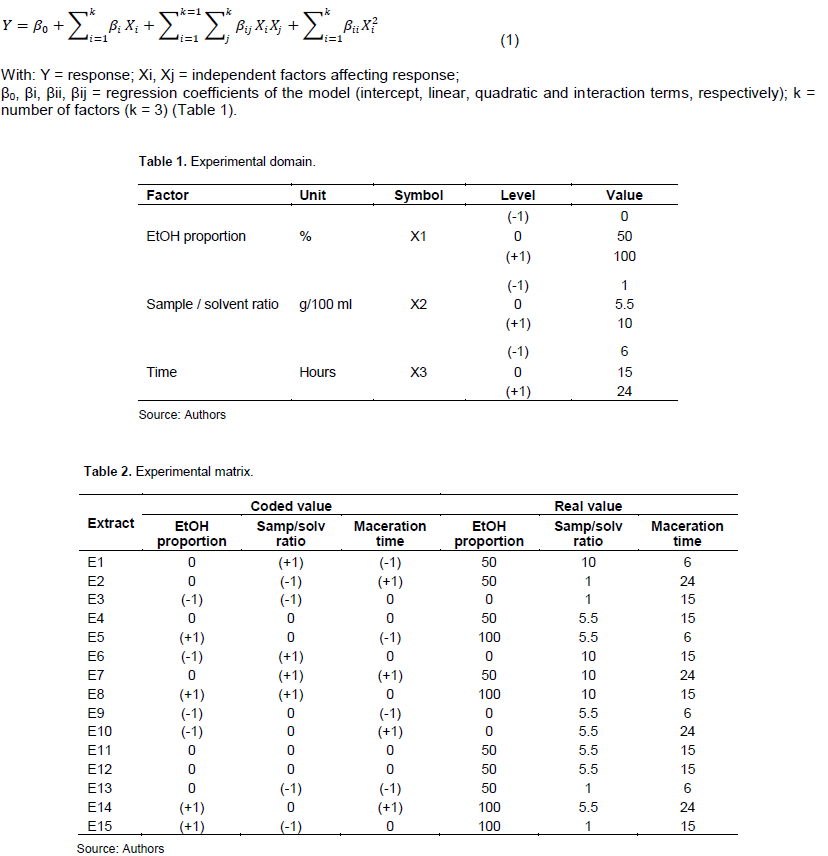
To study the effects of three independent factors, extraction was carried out using a Box-Behnken type experimental design. The factors are EtOH proportion (X1), sample/solvent ratio (X2) and maceration time (X3). Tables 1 and 2 show the experimental range and matrix. The responses were expressed in function of independent factors by the second degree polynomial Equation 1 as enunciated by Patra et al. (2021).
Determination of polyphenol content
The determination of polyphenol content was carried out following the colorimetric method using Folin-Ciocalteu’s reagent as described by Wood et al. (2002). In a test tube, 2.5 ml of 10% diluted Folin-Ciocalteu reagent was added to 30 µl of extract (2.5 mg/ml). The mixture was let to react for 2 min in the dark. Then, 2 ml of 7.5% Na2CO3 were added. The tube was incubated in water bath set at 50°C for 15 min. The tube was rapidly cooled under tap water. The absorbance was measured spectrophotometrically at 760 nm against distilled water as blank. The contents were expressed as milligram of gallic acid equivalent per gram of CAB (mg GAE/g CAB).
Determination of flavonoid content
The flavonoid content determination was carried out by the
colorimetric method using AlCl3 reagent as described by Marinova et al. (2005). In 25 ml volumetric flasks containing 2.5 ml of extract (2.5 mg/ml), 0.75 ml of 5% NaNO2 and 0.75 ml of 10% AlCl3 were successively added. The mixture was let to react in the dark at laboratory temperature (22 ± 2°C) for 6 min. Then, 5 ml of NaOH 1N were added. The volume was completed up to the mark with distilled water. The solution was well mixed and the absorbance was measured spectrophotometrically at 510 nm using distilled water as blank. The flavonoid contents were expressed as milligram of quercetin per gram of CAB (mg QE/g CAB).
Determination of total tannin content
The tannin contents were measured following the spectrometric method using Folin-Ciocalteu’s reagent as described by Ci and Indira (2016). 100 µl of extract were added to a test tube containing 7.5 mL of distilled water and 0.5 mL of Folin-Ciocalteu’s reagent.
Then, 1 mL of 35% Na2CO3 was added. The volume was completed to 10 ml by adding 900 µl of distilled water. The tube was mixed and let to react for 30 min at laboratory temperature (22 ± 2°C). The absorbance was measured spectrophotometrically at 700 nm using distilled water as blank. Tannin contents were expressed as milligram of tannic acid equivalent per gram of CAB (mg TAE/g CAB).
Assessment of antioxidant activity
ABTS•+ cationic radical scavenging test
The ABTS•+ cationic radical scavenging test was carried out following the method described by Teow et al. (2007) with slight modification. ABTS•+ was generated by mixing at equal volume 3 mM of potassium persulfate to 8 mM of ABTS. Mixture was let to react in the dark for 16 h at ambient temperature (25-30°C). Before use, ABTS•+ solution was diluted with methanol to get an absorbance of 0.7 ± 0.02 at 734 nm. Then, 3.9 ml of the methanolic ABTS•+ working solution were added to 100 µl of extract and mixed thoroughly. The reaction mixture was kept in the dark for 6 min at laboratory temperature. Absorbance of extracts was thus measured at 734 nm. The ABTS+ scavenging activity was calculated following Equation 2:
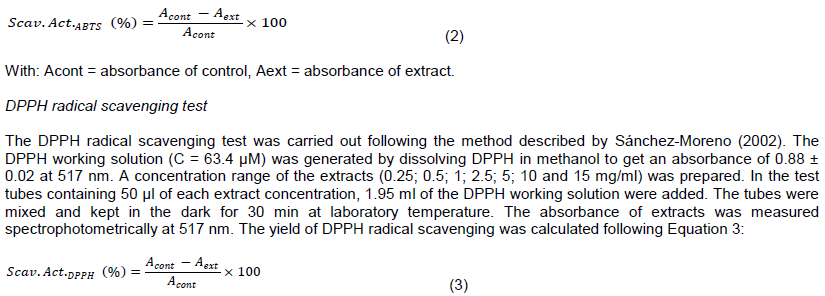
The 50% inhibitory concentration (IC50) of DPPH was determined graphically by logarithmic regression. The lower the IC50 of an extract is, the more its antioxidant power is strong.
Statistical analysis
All tests were performed in triplicate and results expressed as mean. Analysis was performed using Excel 2013 (Microsoft, USA), Statistica 7.1 (Tulsa, OK, USA) and Design-Expert 11 (Stat-Ease, Minneapolis, MN, USA) software’s. Excel software was used for tabulations. Design-Expert software was used to fit the model through analysis of variance (ANOVA) at 5% threshold (p<0.05). The determination coefficient or R squared (R2), adjusted R squared (adj. R2), predicted R squared (pred. R2) and plots were also obtained from Design-Expert. Statistica software was used to test homogeneity by one way ANOVA via Newmann-Keuls test at 5% threshold.
RESULTS AND DISCUSSION
Table 3 presents the polyphenol, flavonoid and tannin contents, as well as the yield of ABTS radical scavenging and IC50’s of DPPH. E2 got the highest polyphenol and tannin contents (7.44 mg GAE/g CAB and 9.25 mg TAE/g CAB respectively). The high flavonoid content (14.99 mg QE/g CAB) was observed with E15 extract. As for antioxidant activity, the high ABTS radical scavenging activity was observed with E11, while the high IC50 of DPPH was observed with E3; thus the less effective.
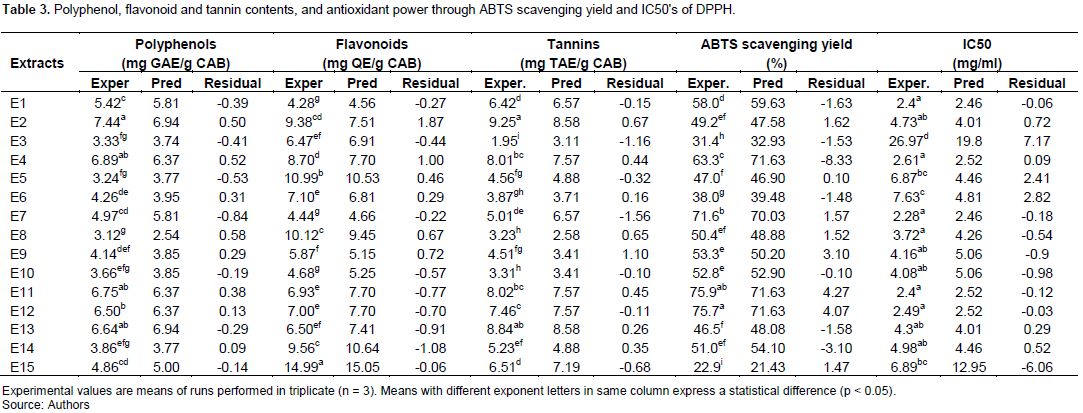
Inversely, the lower phenol and flavonoid contents (3.12 mg GAE/g CAB and 4.28 mg QE/g CAB) were observed with E8 and E1 respectively. E3 extract exhibited the lower tannin content. The lower ABTS scavenging yield comes to E15 extract, and the lower IC50 of DPPH was observed with E7 extract; thus the more effective.
Polyphenol
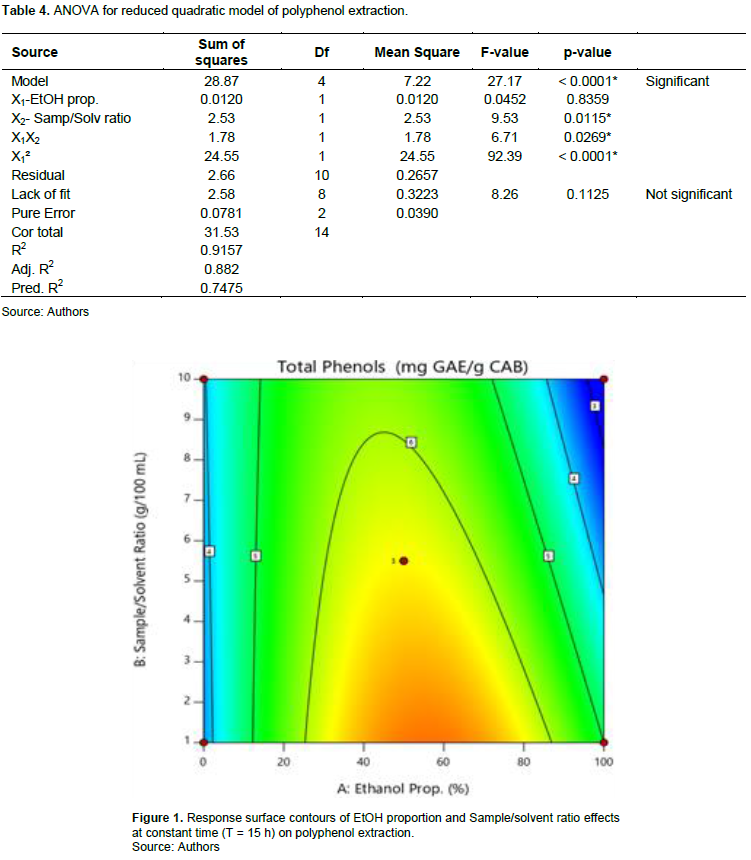
Polyphenol contents range from 3.12 (E8) to 7.44 mg GAE/g CAB (E2). Regression analysis showed that polyphenol extraction model is significant (p < 0.0001) with non-significant lack of fit (p = 0.1125). The R squared (R2 = 0.9157) shows that there is a good correlation between the response and factors. The predicted R squared is in reasonable agreement with the adjusted R squared (adj. R2 – pred. R2 < 0.2). The ANOVA shows that X1 and X2 factors significantly impacted extraction. Effects of the factors on the linear plan of X2, quadratic of X1 and interaction between X1 and X2 are significant (Table 4). So, the lower the sample/solvent ratio is (level -1) and when ethanol proportion is around 50% (level 0), the more extraction is optimal; the effect of time being negligible (Figure 1). Predicted model is as given by Equation 4:

The polyphenol contents of our extracts are much higher than those obtained (0.1215 to 0.3685 mg GAE/g CAB) by Barretto et al. (2015) from the hydroethanolic extraction (30 to 70%) of CAB. This difference could be explained by the different treatments undergone by apples or the extraction technic used (Dirar et al., 2019). It could also be due to genetic variety, environmental parameters, ripening stage and/or harvesting condition as supported by Khorsand et al. (2022)(Figure 1).
Nevertheless, polyphenol contents of our extracts are lower compared to those of Andrade et al. (2015) (19.75 mg GAE/g CAB). These authors used a sequenced extraction process using 55% acetone followed by 50% methanol. The different results in these two studies could be explained by the solvents of different polarities used. On the one hand, our results show that the optimal extraction of polyphenol was reached with 50% ethanolic solvent (4.97- 7.44 mg GAE/g CAB) compared to 100% ethanolic (3.12- 4.86 mg GAE/g CAB) and aqueous (3.33- 4.26 mg GAE/g CAB). This result could be explained by the fact that the use of mixture of water and organic solvents would be more effective than mono-solvents to extract phenolic due to polarity.
According to Jovanovic et al. (2017) and Lezoul et al. (2020), water adding increases the polarity index of solvent, thus increasing solubility of polyphenol, which helps to break hydrogen bonding facilitating their maximum extraction. In fact, 50 and 100% ethanolic solvents have respective polarity of 0.827 and 0.654. Therefore, polyphenols are more soluble in solvents of polarity in range of 0.8; that could explain the optimal content obtained by Andrade et al. (2015) when using a 50% methanolic solvent which has 0.88 polarity. Similar result was reported by El-Salam and Morsy (2019) who stated that optimal yields of polyphenols were reached using 40 and 50% EtOH solvents whose polarities are 0.862 and 0.827 respectively. Similarly, work of Dirar et al. (2019) conducted on Sudanese medicinal plants (Cyperus rotundus and Guiera senegalensis) revealed that polyphenol contents of 50 and 70% ethanolic solvents were maximized than those of mono-solvents (dichloromethane, acetone, 95% ethanol and water).
On the other hand, our result show that maceration time (X3) has had a negligible effect on polyphenol extraction. In fact, extract E13 and E2 were conducted in the same condition except for maceration time: 6 h and 24 h respectively. However, their phenolic contents were not statistically different (p<0.05). This result means that extension of the maceration time of extract E2 to 24 h has not help to maximize its polyphenol content. The same is true for extracts E5 and E14.
This result can be explain by the fact that longer extraction time could induce the polyphenol degradation by hydrolysis resulting sometimes in the decrease of the yield. This result is comforted by those of El-Salam and Morsy (2019) who report that phenolic content of Malva parviflora L. leaves had not significantly increased at over10 min; the extraction being extended till 45 min. Likewise, Wani et al. (2017) showed that extraction time had negligible effect when extracting polyphenols from dried apricot fruit extracts (Prunus armeniaca L.).
Flavonoid
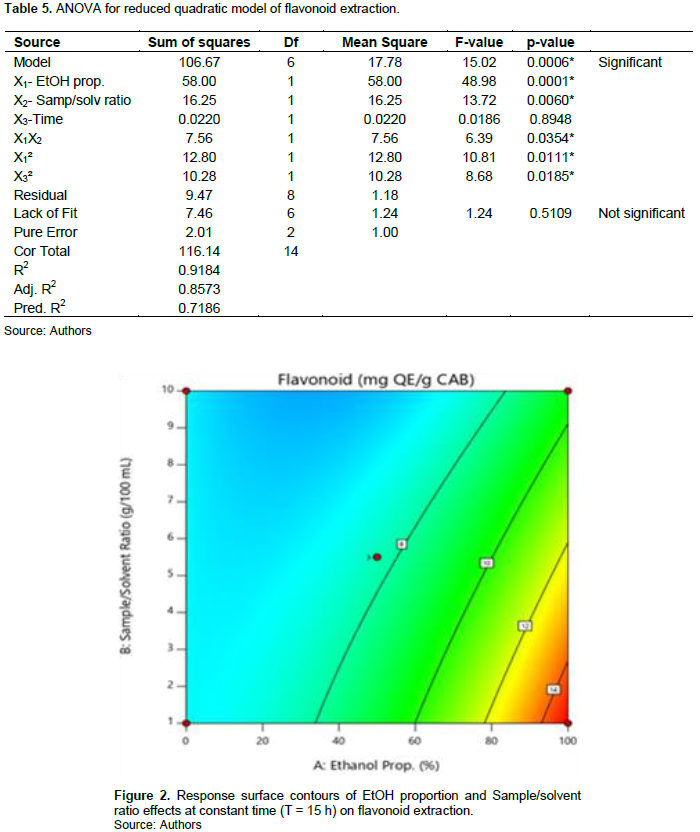
Flavonoid contents range from 4.28 (E1) to 14.99 mg QE/g CAB (E15). The model is significant (p = 0.0006) and present no significant lack of fit (p = 0.5109). The R squared (R2 = 0.9184) show that it exists good correlation between response and factors. The predicted R2 is in reasonable agreement with adjusted R2. The ANOVA shows that all the factors significantly impacted flavonoid extraction. Effects of the factors on the linear plan of X1 and X2, quadratic of X1 and X3, and interaction between X1 and X2 are significant (Table 5). Thus, the higher the EtOH proportion is (level +1) and low is the sample/solvent ratio (level -1), the more flavonoid contents are optimal (Figure 2). The model is written as shown by Equation 5:

The flavonoid contents of our extracts are higher (9.56 to 14.99 mg QE/g dw) compared to those obtained by Krasnova and Seglina (2019) (1.45 to 5.59 mg CAE/g dw) in ultrasound assisted extraction of flavonoids from 11 cultivars of apple (Malus domestica) using 70% EtOH (Table 5 and Figure 2).
According to the results, it can be state that the use of a solvent with high EtOH concentration and a low sample/solvent ratio induces the extraction of high content of flavonoid. In fact, the E14 and E15 extracts were performed using 100% EtOH with sample/solvent ratio of 5.5 g/100 ml and 1 g/100 ml respectively. It was observed that E15 got the highest flavonoid content. This result can be explain on the one hand, by the fact that the use of lower sample/solvent ratio has been able to avoid solvent saturation, allowing well molecular movement; thus increasing the extraction of flavonoids (?uji? et al., 2016). The same is true for E5 and E8 extracts. Our results are comforted by those of Pandey et al. (2021) who found high flavonoid contents when combining the high level of EtOH (90% EtOH) and low sample/solvent ratio (1:40 and 1:30, w:v). On the other hand, this result can be due to the predominant presence of some flavonoid compounds more soluble in ethanol such as quercetin, kaempferol or kaempferitrin (Cid-Ortega and Monroy-Rivera, 2018; ?or?evi? et al., 2018). Likewise, work of Dirar et al. (2019) show that use of high EtOH concentration solvent allowed to extract strong flavonoid contents from 4 Sudanese medicinal plants (B. linariifolia, C. rotundus, M. pseudopetalosa and T. bakis).
The ANOVA showed that time (X3) has had a significant effect on flavonoid extraction. In fact, E2 and E13 extracts were performed in the same conditions excepted for the time: 24 h and 6 h for E2 and E13 respectively. Results showed that E2 got the highest flavonoid content, indicating that extension of the maceration time of E2 extract allowed to increase its flavonoid content. Our findings are in convenience with those of Tranquilino-Rodríguez et al. (2020). These authors reported that flavonoid contents of 70, 83 and 96% ethanolic extracts of young cladodes of Opuntia ficus-indica were ranged from 3.095 to 10.392 mg QE/g dw proportionally with the increase of EtOH concentration and extraction time from 30 to 120 min.
Total tannin
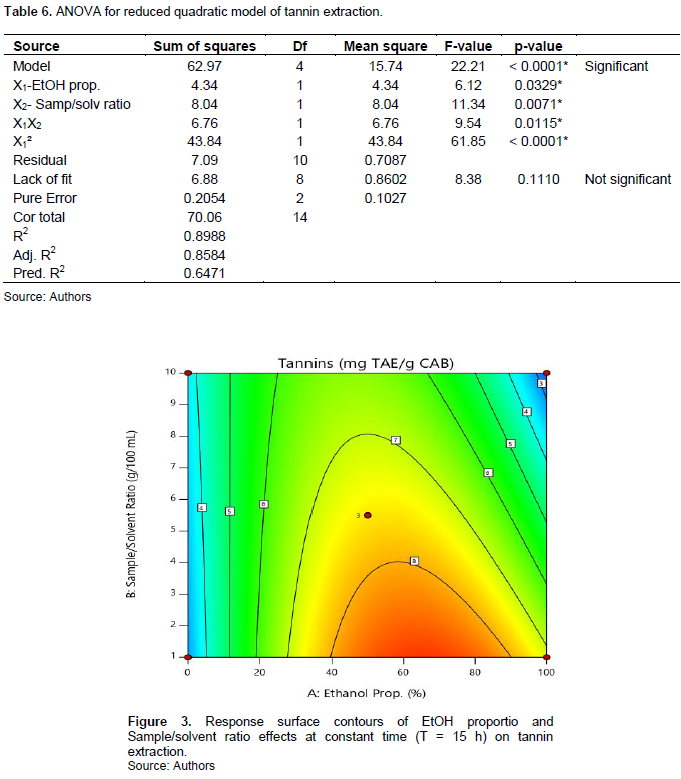
Tannin contents range from 1.95 (E3) to 9.25 mg TAE/g CAB (E2). The model is significant (p<0.0001) and present no significant lack of fit (p = 0.111). The R squared (R2 = 0.8988) show existence of a good correlation between the response and factors. ANOVA shows that X1 and X2 factors have significantly impacted tannin extraction. The linear effects of X1 and X2, interaction between X1 and X2 and quadratic of X1 are statistically significant (Table 6). The lower the sample/solvent ratio is (level -1) and the EtOH proportion turn around 60%, the more tannin extraction is optimal(Figure 3); the influence of time being negligible. Mathematic model is written following Equation 6:

The 50% ethanolic solvent induced the extraction of high tannin contents (5.01 to 9.25 mg TAE/g CAB) compared to those obtained using 100% EtOH (3.23 to 6.51 mg TAE/g CAB) and water (1.95 to 4.51 mg TAE/g CAB). The factors’ effects in tannin extraction show similarities as in the case of polyphenol extraction. Same observation was reported by Detti et al. (2020) in their work on optimization of ultrasound assisted green extraction of polyphenols from Pistacia lentiscus leaves. This observation could be explained by the fact that tannins could be the most abundant components in the CAB, given that flavonoid and tannin are included into polyphenols.
Antioxidant activity
ABTS+ radical scavenging test
ABTS+ radical scavenging yields range from 22.9% (E15) to 75.9% (E11). Model is significant (p = 0.0069) and present no significant lack of fit (p = 0.8599). The R squared (R2 = 0.9556) show that it exists a good correlation between response and factors. Predicted R2 is in reasonable agreement with adjusted R2. ANOVA shows that X1 and X2 factors have impacted response. The effect on the linear plan of X1 and quadratic of X1 and X2 are significant (Table 7). ABTS+ scavenging yield is optimal when EtOH proportion is around 50% with sample/solvent ratio situated around 7 g/100 ml (Figure 4); time’s effect being negligible. Mathematic model is as described in Equation 7:
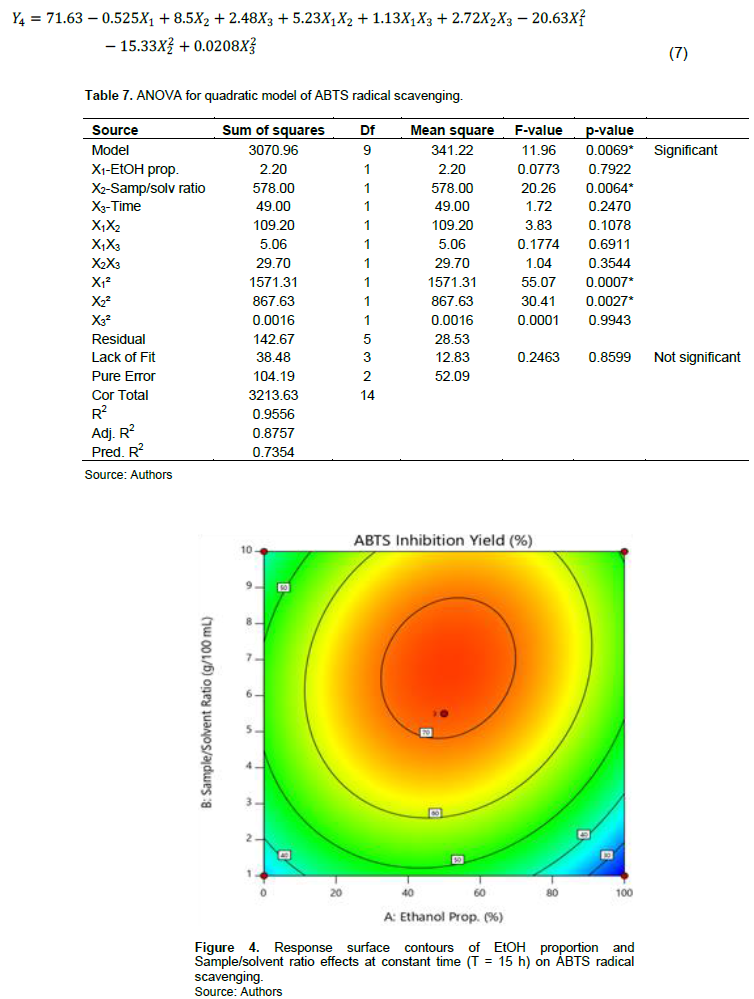
On the one hand, our results show that extraction solvent impacted antioxidant power. 50% ethanolic extracts exhibited the strong ABTS+ scavenging power (46.5 to75.9%) compared to those of aqueous (31.4 to 53.3%) and 100% ethanolic extracts (22.9 to 51%). Optimal ABTS radical scavenging yield was reached when EtOH proportion range from 40 to 60%. Under or above this interval, a drop of the ABTS scavenging power is observed. This result could be due to components extracted in solvent of EtOH proportion ranged in this interval, relative to its polarity. Work of Li et al. (2019) carried out on Gordonia axillaris fruit comfort this result.
Similarly, Tranquilino-Rodríguez et al. (2020) reported that a decrease in the ethanol concentration from 96 to 70% was inversely correlated to ABTS radical scavenging power. On the other hand, our results show that sample/solvent ratio is an important factor which influences ABTS scavenging power. In fact, ABTS scavenging yield was optimal at ratio ranging from 5 g/100 ml (that is, 1:20) to 8 g/100 ml (that is, 1:12.5). This result means that in this interval, the solvent saturation is avoided and compounds endowed with good ABTS scavenging are extracted (Figure 4). This statement is in convenience with that mentioned by Barretto et al. (2015) and Pandey et al. (2021) who state that sample to solvent ratio is the most important factor which influence ABTS radical scavenging.
DPPH radical scavenging test
The extract IC50’s varied from 2.28 (E7) to 26.97 mg/ml (E3). The model is significant (p = 0.0001) and present no significant lack of fit (p = 0.0835). The R squared (R2 = 0.879) reveals that a good correlation is established between response and factors. Predicted R2 is in reasonable agreement with the adjusted R2. The ANOVA shows that X2 and X1 factors impacted significantly the response. Linear effects of X2 and quadratic ones of X1 and X2 were statistically significant (Table 8). Figure 5 shows that the lower the sample/solvent ratio (level -1) for a proportion of EtOH oscillating around 50% (level 0), the lower the IC50. Maceration time showed no significant effect. The mathematic model is as expressed in Equation 8:

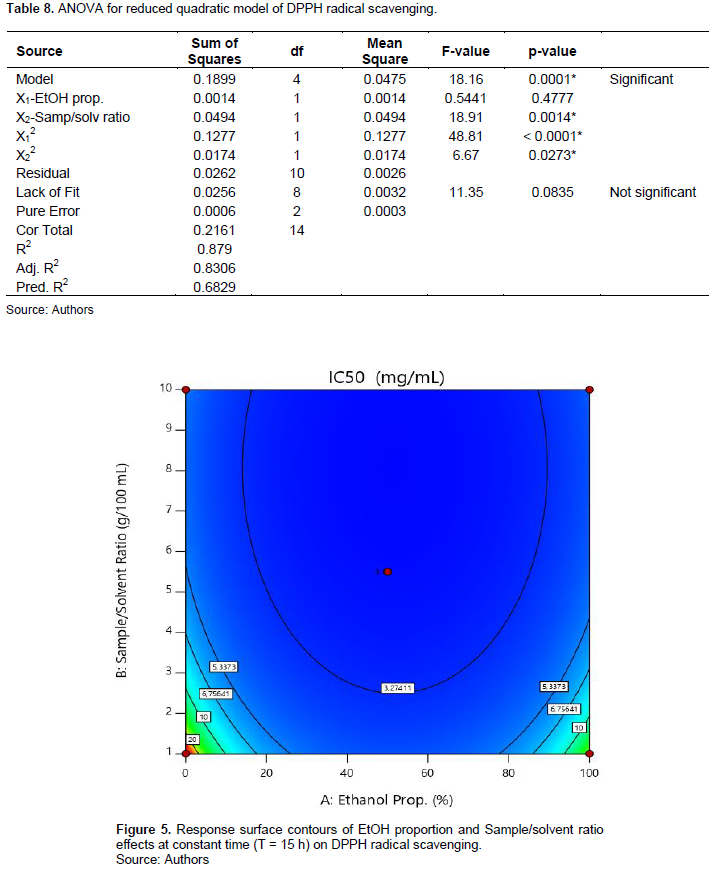
Similarly to the ABTS+ scavenging test, our results show that the 50% ethanolic extracts were more effective in scavenging DPPH radical. Their IC50s ranged from 2.28 to 4.73 mg/mL, exhibiting stronger DPPH radical scavenging power than the 100% ethanolic (3.72 to 6.89 mg/ml) and aqueous extracts (4.08 to 26.97 mg/ml). This result is confirmed by that of Dirar et al. (2019) which shows that the 50% ethanolic extract of Guiera senegalensis leaves presented the strongest DPPH scavenging trapping power compared to those of mono-solvents (water, acetone, 95% EtOH and acetonitrile).
Optimization of antioxidant activity
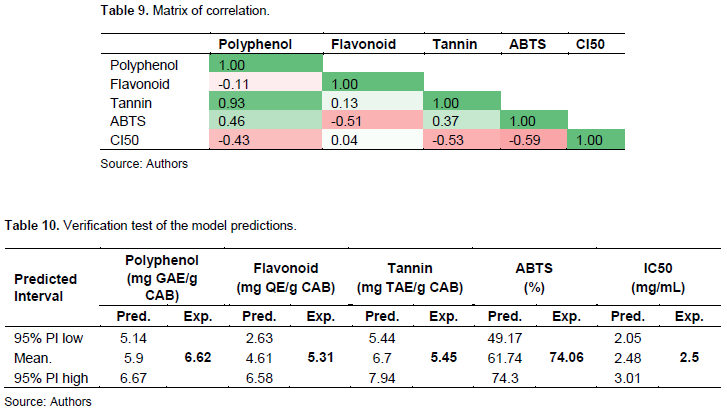
The study of Pearson correlation (Table 9) shows that antioxidant activity via the ABTS scavenging test is positively correlated to polyphenol (r = 0.46; p < 0.05) and tannins (r = 0.37; p < 0.05). However, it is negatively correlated to flavonoids (r = -0.51; p < 0.05). Similarly, antioxidant activity via DPPH scavenging test is correlated to polyphenol (r = -0.43; p < 0.05) as well as tannin (r = -0.53; p < 0.05). The negative correlation coefficient (r < 0) indicates that the more polyphenol and tannin contents are optimal, the lower IC50s are; thus more effective. Flavonoids establish no correlation with DPPH scavenging. Nevertheless, ABTS and DPPH scavenging are correlated one to other (r = -0.59; p < 0.05).
Optimization of antioxidant activity with a desirability of 0.79 consists to macerate CAB powder at 9.5 g/100 ml ratio in a 46.1% ethanolic solvent for 6 h. A run replicated five times was carried out to verify this optimal condition. All values of the verification tests ranged in the predicted interval (PI) by the model (Table 10), meaning that the model fits well with the optimization of antioxidant power of CAB powder.
CONCLUSION
This study allows us to model optimal extraction condition of antioxidant phenolic compounds from CAB using non-toxic solvents. Evaluation of the effects of three factors showed that effects of EtOH proportion of solvent (X1) and sample to solvent ratio (X2) are significant. The determination coefficient (R2 > 0.8) indicates that model adequately explain experimental data. Correlation study shows that flavonoids establish no correlation with ABTS and DPPH antioxidant tests. For a desirability of 0.79, the model to reach an optimal antioxidant power is as: EtOH proportion (46.1%), sample/solvent ratio (9.5 g/100 ml) and maceration time (6 h). To this condition, ABTS scavenging yield reaches 74% and the IC50 of DPPH is 2.5 mg/ml, conceding with model predictions. Using non-toxic solvents to reach optimal antioxidant bioactive compound extraction allows envisaging its use in food industry due to their benefits for health.
ABBREVIATIONS
CAB, cashew apple bagasse; GAE, gallic acid equivalent; QE, quercetin equivalent, TAE, tannic acid equivalent; EtOH, ethanol; ABTS, 2,2’-azinobis (3-ethyl-benzothiazoline-6-sulphonic acid; DPPH, 1,1-diphenyl-2-picryl-hydrazyl.
CONFLICT OF INTERESTS
The authors have not declared any conflict of interests
ACKNOWLEDGEMENTS
The authors appreciate Projet de Promotion de la Compétitivité de la chaine de valeur de l’Anacarde (PPCA) Côte d’Ivoire for full funding of this research (contract number 82/FIRCA/INPHB/PPCA-PNRA/2019). Thanks to the Université Félix Houphouët-Boigny of Abidjan and Institut National Polytechnique Houphouët-Boigny of Yamoussoukro for having supported practice realization of the study. They also thank planters who gracefully accepted cashew apple harvest from their orchards, and Oblé Oblé Jean for technical assistance.
REFERENCES
|
Andrade RAMS, Maciel MIS, Santos AMP, Melo EA (2015). Optimization of the extraction process of polyphenols from cashew apple agro-industrial residues. Food Science and Technology (Campinas) 35(2):354?360. |
|
|
Barretto LCO, de Andrade TA, Leão KMM, Moreira JJS, Freitas SP (2015). Antioxidant capacity improvement of cashew apple bagasse. Chemical Engineering Transactions 44:1?6. |
|
|
Blasi F, Cossignani L (2020). An overview of natural extracts with antioxidant activity for the improvement of the oxidative stability and shelf life of edible oils. Processes 8(8):956. |
|
|
Bohui PSG, Adima AA, Niamké FB, N'Guessan JD (2018). Etude comparative de trois méthodes d'extraction des flavonoïdes totaux à partir des feuilles de plantes médicinales: Azadirachta indica et Psidium guajava. Journal de la Société Ouest-Africaine de Chimie 46:50?58. |
|
|
Ci KC, Indira G (2016). Quantitative estimation of total phenolic, flavonoids, tannin and chlorophyll content of leaves of Strobilanthes Kunthiana (Neelakurinji). Journal of Medicinal Plants Studies 4(4):282?286. |
|
|
Cid-Ortega S, Monroy-Rivera JA (2018). Extraction of kaempferol and its glycosides using supercritical fluids from plant sources?: A review. Food Technology and Biotechnology 56(4):480?493. |
|
|
?uji? N, Šavikin K, Jankovi? T, Pljevljakuši? D, Zduni? G, Ibri? S (2016). Optimization of polyphenols extraction from dried chokeberry using maceration as traditional technique. Food Chemistry 194:135?142. |
|
|
Detti C, dos Santos NLB, Brunetti C, Ferrini F, Gori A (2020). Optimization of a green ultrasound-assisted extraction of different polyphenols from Pistacia lentiscus L. leaves using a Response Surface Methodology. Plants 9(11):1482?1498. |
|
|
Dirar AI, Alsaadi DHM, Wada M, Mohamed MA, Watanabe T, Devkota HP (2019). Effects of extraction solvents on total phenolic and flavonoid contents and biological activities of extracts from Sudanese medicinal plants. South African Journal of Botany 120:261?267. |
|
|
?or?evi? BS, Todorovi? ZB, Troter DZ, Stanojevi? LP, Veljkovi? VB (2018). The extraction of quercetin from waste onion (Allium cepa L.) tunic by the aqueous solutions of different deep eutectic solvents. Advanced Technologies 7(2):5?10. |
|
|
El-Salam EAA, Morsy NFS (2019). Optimization of the extraction of polyphenols and antioxidant activity from Malva parviflora L. leaves using Box-Behnken design. Preparative Biochemistry and Biotechnology 49(9):876-883. |
|
|
Felix ACS, Novaes C, Rocha M, Barreto G, Franco M, do Nascimento B, Alvarez L (2018). An optimized alternative for phenolic compound-extraction of strawberry bagasse agro-industrial residues. Journal of Microbiology, Biotechnology and Food Sciences 8(2):815?820. |
|
|
Jovanovic AA, Dordevic VB, Zdunic GM, Pljevljakusic DS, Savikin KP, Godevac DM, Bugarski BM (2017). Optimization of the extraction process of polyphenols from Thymus serpyllum L. herb using maceration, heat- and ultrasound-assisted techniques. Separation and Purification Technology 179:369?380. |
|
|
Kaprasob R, Kerdchoechuen O, Laohakunjit N, Sarkar D, Shetty K (2017). Fermentation-based biotransformation of bioactive phenolics and volatile compounds from cashew apple juice by select lactic acid bacteria. Process Biochemistry 59:141?149. |
|
|
Khorsand JG, Morshedloo MR, Mumivand H, Emami-Bistgani Z, Maggi F, Khademi A (2022). Natural diversity in phenolic components and antioxidant properties of oregano (Origanum vulgare L.) accessions, grown under the same conditions. Scientific Reports 12(1):5813?5821. |
|
|
Krasnova I, Seglina D (2019). Content of phenolic compounds and antioxidant activity in fresh apple, pomace and pomace water extract-Effect of cultivar. Proceedings of the Latvian Academy of Sciences. Section B 73(6):513?518. |
|
|
Lezoul NEH, Belkadi M, Habibi F, Guillén F. (2020). Extraction processes with several solvents on total bioactive compounds in different organs of three medicinal plants. Molecules 25:4672?4686. |
|
|
Li Y, Cao S-Y, Lin S-J, Zhang J-R, Gan R-Y, Li H-B (2019). Polyphenolic profile and antioxidant capacity of extracts from Gordonia axillaris fruits. Antioxidants 8(6):150?163. |
|
|
Lourenço SC, Moldão-Martins M, Alves VD (2019). Antioxidants of natural plant origins?: From sources to food industry applications. Molecules 24(22):4132?4156. |
|
|
Marinova D, Ribarova F, Atanassova M (2005). Total phenolics and flavonoids in Bulgarian fruits and vegetables. Journal of the University of Chemical Technology and Metallurgy 40:255?260. |
|
|
Oliveira NN, Mothé CG, Mothé MG, de Oliveira LG (2019). Cashew nut and cashew apple?: A scientific and technological monitoring worldwide review. Journal of Food Science and Technology 57(1):12-21. |
|
|
Oroian M-A, Escriche I (2015). Antioxidants: Characterization, natural sources, extraction and analysis. Food Research International 74:10-36. |
|
|
Pandey A, Belwal T, Tamta S, Rawal RS (2021). Optimized extraction of polyphenolic antioxidants from the leaves of Himalayan Oak species. PLos ONE 16(11):e0259350. |
|
|
Patra A, Abdullah S, Pradhan RC (2021). Application of artificial neural network-genetic algorithm and response surface methodology for optimization of ultrasound-assisted extraction of phenolic compounds from cashew apple bagasse. Journal of Food Process Engineering 44(10):e13828. |
|
|
Phaniendra A, Jestadi DB, Periyasamy L (2015). Free radicals?: Properties, sources, targets, and their implication in various diseases. Indian Journal of Clinical Biochemistry 30(1):11-26. |
|
|
Sánchez-Moreno C. (2002). Review: Methods used to evaluate the free radical scavenging activity in foods and biological systems. Food Science and Technology International 8(3):121?137. |
|
|
Sarr OS, Fall DA, Gueye R, Diop A, Diatta K, Diop N, Ndiaye B, Diop MY (2015). Etude de l'activité antioxydante des extraits des feuilles de Vitex doniana (Verbenacea). International Journal of Biological and Chemical Sciences 9(3):1263?1269. |
|
|
Teow CC, Truong VD, McFeeters RF, Thompson RL, Pecota KV, Yencho C (2007). Antioxidant activities, phenolic and ß-carotene contents of sweet potato genotypes with varying flesh colours. Food Chemistry 103(3):829?838. |
|
|
Tranquilino-Rodríguez E, Martínez-Flores HE, Rodiles-López JO, Figueroa-Cárdenas JDD, Pérez-Sánchez RE (2020). Optimization in the extraction of polyphenolic compounds and antioxidant activity from Opuntia ficus-indica using response surface methodology. Journal of Food Processing and Preservation 44(6):e14485. |
|
|
Wani SM, Jan N, Wani TA, Ahmad M, Masoodi FA, Gani A (2017). Optimization of antioxidant activity and total polyphenols of dried apricot fruit extracts (Prunus armeniaca L.) using response surface methodology. Journal of the Saudi Society of Agricultural Sciences 16(2):119?126. |
|
|
Wani TA, Gani A, Wani SM, Wani IA, Masoodi FA, Nissar N, Shagoo MA (2016). Suitability of different food grade materials for the encapsulation of some functional foods well reported for their advantages and susceptibility. Critical Reviews in Food Science and Nutrition 56(15):2431-2454. |
|
|
Wood JE, Senthilmohan ST, Peskin AV (2002). Antioxidant activity of procyanidin-containing plant extracts at different pHs. Food Chemistry 77(2):155?161. |
|
Copyright © 2024 Author(s) retain the copyright of this article.
This article is published under the terms of the Creative Commons Attribution License 4.0


