ABSTRACT
This study extends Technology Acceptance Model (TAM) to study inhibitors and enablers of the use of mobile broadband in Africa. The conceptual model tested incorporates two key constructs into TAM: Perceived price and energy —are also analyzed. Results from online survey, of 114 mobile internet consumers supported the model. The study identified the factors that can influence their decision-making and the various obstacles they face in the use of mobile-broadband. The theoretical and managerial implications of these results are discussed.
Key words: Mobile-broadband usage, TAM, Sub-Saharan Africa, structural equation.
According to the International Telecommunication Union (ITU), there were more than seven billion four mobile subscribers globally in 2016. This figure is expected to reach one billion additional mobile subscribers in 2020 which 90% of them will come from developing markets. The resounding success of mobile telephony could be explained on one hand, due to the advance-ment in technology coupled with economic changes and on the other, the liberalization of the telecommunications sector and the growing need to connect to the Internet.
Presently, the rate of penetration is 94.1% for the developing countries. However, by the end of 2017 this penetration rate would have reached 100% and for the developed countries, it would reach more than 127%. Thus, by the end of 2014, the penetration rate of mobile 9broadband will reach 32%; in developed countries, it will be 84%, four times what it is in developing countries (21%).
Moreover, with the growing need to connect to the Internet, the mobile phone will become the primary means for connectivity (Cheneau-Loquay, 2010) and would represent 80% of all connections in 2015. While the upheaval in the world of telecommunications and the use of the internet started some fifteen years ago throughout Africa (Cheneau-Loquay, 2011), it has been found out that there is a rapid increase in the use of the internet via the mobile phone.
According to the Agency Ecofin, the growth of mobile internet services in Africa is at an exponential rate. More than 500 million people, today, have access to broadband (3G and 4G). This figure estimated by ITU,will increase, according to the same source, to 3.4 billion by 2016.
In sub-Saharan Africa, broadband technology was launched in 2004 and there are now 21% Active mobile-broadband subscriptions. This is due to the increased speed for the exit traffic internationally, following the interconnection to the submarine cable.
Given the huge potential of the mobile-broadband on the sub-Saharan Africa market despite the low coverage of the 3G and 4G networks, socio-economic difficulties, the repetitive power failures, and faced with the absence of studies in this area, in Africa and particularly in sub-Saharan Africa this paper could be a contribution to stimulate the growth in mobile-broadband in sub-Saharan Africa, and act as a bench-mark for other researchers and enable practitioners to build their strategies for deployment of broadband in these countries.What are the factors affecting or influencing the use of mobile-broadband services in the sub-Saharan Africa?
To answer this question, we must recall at first the background literatures justifying consumer behavior and theories relating to the appropriation of information technology and communication (ICT). This literature review will lead to the study research model that will be tested with a hypothetical-deductive approach. In a second step, we will present the methodology used for this research, which takes into account the context of the research, sampling, and measurement instrument for the implementation of the constructs. Finally, we will present the results which will then be discussed before conclusion.
Overview of the evolution of mobile-broadband (3G, 4G)
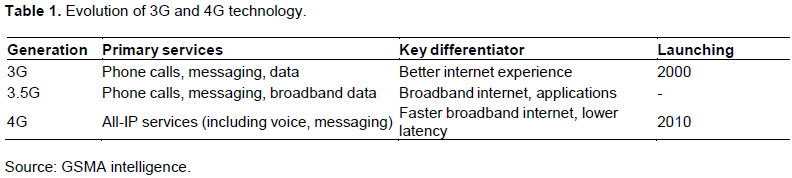
According to Chong et al. (2010), 3G is known as mobile communications of third generation. The 3G technology is defined as "the new generation of telephone communication system allowing the fusion of terrestrial and satellite components. It supports up to 2 Mbps transmission speed ".
Globally speaking, 3G is a technology that has reached its maturity as it is deployed in virtually every country in the world. As a technology, 4G continues to develop. Operators are already making considerable amount of progress in increasing the data speeds of their existing networks by adopting 4G, which can theoretical achieve downlink speeds of up to 300 Mbps.
The development of smartphones "low Cost that is, with a value of less than USD 50, as Orange Kliff or Elikia (first African smartphone VMK created by the Congolese manufacturer) boosted the use of mobile broadband in countries where 3G / 4G networks are installed (Table 1).
Factors of adoption of mobile-broadband
Three main models are the basis of most studies on the diffusion and adoption of innovations: the Bass model (1969), the Rogers model (1962, 1971, 1986, 2003) and TAM model (Davis, 1989).
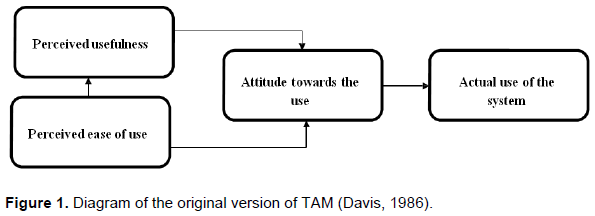
This study will focus on the Technology Acceptance Model (TAM) based on the adaptation of the Theory of Reasoned Action (TRA) (Fishbein and Ajzen, 1975). Introduced by Davis (1986), TAM is used to model the user acceptance of information systems. Its aim is to provide an explanation of the determinants of acceptance and use of technologies.
The literature shows that the TAM was made to trace the impact of external factors on the beliefs, attitudes and intentions by identifying a limited number of variables suggested by previous researches. The TAM is based on two beliefs, in particular, "perceived usefulness" and “perceived ease of use” to explain the attitude of the user; its intentions and behavior adoption of a technology based on computer. In a precise way, Davis defined perceived usefulness as "the degree to which a person believes that using a particular system enhances work performance. "As for the perceived ease of use, Davis shows that it is" the degree to which a person believes that using a system requires no effort".
TAM may explain the success or failure in the adoption of new technologies (Straub et al., 1997). According to Taylor and Todd (1995), the TAM can predict the determinants of acceptance of a system and guide changes required before users can develop experience in the use of the system studied (Figure 1). Like with any human representation, perception is more or less part of subjectivity. In fact, in his model, Davis (1989) connects the perceived usefulness and perceived ease of use with the attitudes of usage which in turn produces the actual usage of technologies.
Thus, the TAM's objective is to explain and predict based on a diagnostic, the eventual inhibitors of usage that can possibly influence the behavior of the user based on his initial experience with the technology (Deng et al., 2005).
Research model and hypotheses development
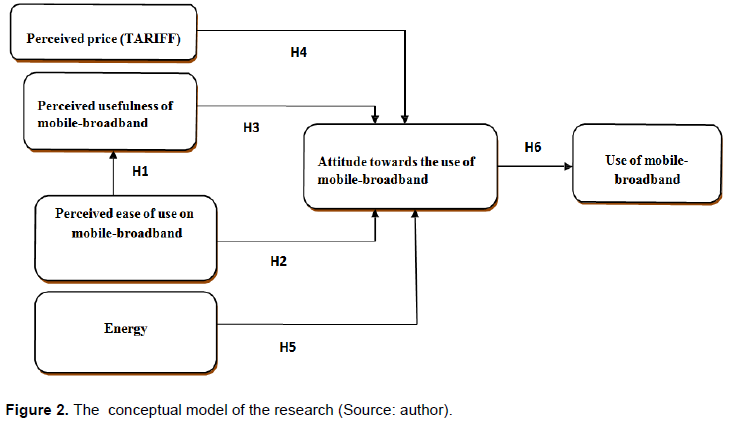
The study research model will rely especially on the TAM (Davis, 1986). The choice of this model focuses on the possibility and the ability to contain the more constructs as possible that preoccupy us in order to explain the individual decision of use of mobile-broadband in the Sub- Saharan Africa.
The TAM uses two determinants of attitude toward use: perceived usefulness and perceived ease of use. Figure2 presents our conceptual model that derives from the TAM which adapts to the realities of the Sub-Saharan Africa. We included into the TAM other variables such as cost and energy. The constructs of the conceptual model as well as the assumptions of the research will be explained in the remainder of this section.
Perceived ease of use
Perceived ease of use refers to the degree of belief that technology will be used effortlessly by the user. Davis (1989) defines it as the degree to which the user finds that the use of the system does not require a large effort. This model refers to the one of Rogers (1995), which expresses the degree to which the innovation is perceived difficult to be used.
In the study research, the ease of use is reflected in the degree of non-complexity. It shows how the use of mobile-broadband is seen free of effort. We connect in the study constructs, the perceived ease of use to perceived usefulness and attitude towards the use of mobile-broadband. The relationship between perceived ease of use and perceived usefulness has been studied in several researches on information systems.
Most of these researches have shown that perceived ease of use is an antecedent of perceived usefulness (Davis, 1989; Mathieson, 1991; Taylor and Todd, 1995; Szajna, 1996). In this research, we assume, based on his theoretical contributions that even for mobile-broadband technology, perceived usefulness is influenced by perceived ease of use.
We then enunciate the hypothesis
H1: The perceived ease of use positively influences perceived usefulness of mobile-broadband technology.
In the literature, the feeling of being for or against the use depends on the attitude towards use. Katz (1997) shows that the barriers to the adoption of the internet are represented by the inability to use the internet, the difficulty of access, the complexity of the technology and discomfort with the use of computer. Childers et al. (2001) showed that the perceived ease of use is a determinant of attitudes toward interactive storage.
Some research in information systems, have empirically verified that the user is a direct determinant of attitude (Mathieson, 1991; Taylor and Todd, 1995; Agarwal and Prasad, 1997). We rely on the existing literature to suggest a relationship between the perceived ease of use of mobile-broadband and attitude towards its use. We think that users, who find mobile-broadband technology easy to use, will have a favorable attitude toward its usage. Thus, we state:
H2: The perceived ease of use of mobile-broadband positively influences the attitude towards using mobile-broadband.
Perceived usefulness
The perceived usefulness is defined by Davis (1989) as; the extent to which a person believes that using a particular system would enhance his job performances. It reflects the perceptions of performance gains to be achieved by the use of technology.
Thus, the perceived usefulness depends on the degree of belief that technology will help increase the performance of the user in his work. This joins the definition of "useful" that means according to Davis (1989) "capable" of being used advantageously and profitably.
In the study research, perceived usefulness shows the advantages that he/she can derive from the use of mobile-broadband, such as saving time, money and convenience. We propose, in this research, to link the perceived usefulness with the attitude.
Relationship between perceived usefulness and attitude towards the use of mobile-broadband
The notion of utility refers to the perceived benefit (Au and Enderwick, 2000) and positive consequences of behavior (Davis et al., 1989). We then propose the following hypothesis:
H3: Perceived usefulness of mobile-broadband positively influences the attitude towards the use of mobile-broadband.
The price is generally defined as an internal standard that allows consumers to evaluate a product or service offering (Shirai, 2003). In fact, the price involves in all purchasing decisions and the consumer is always looking for the "best price" (Urbany, 1986). The effect of price on the act of purchasing has been highlighted by several authors (Kopalle et al., 1999; Paap and Franses, 2000; Pauwels et al., 2002; Van Heerde et al., 2000). Other researchers suggest that consumers perceive the price as an indicator of the quality of a product, also perceive the price as a positive indication of the level of prestige of a brand (Lichtenstein et al., 1993).
Following this logic, Vigneron and Johnson (1999) suggest that consumers seeking prestige by ostentation attach particular attraction to price as an indicator of prestige, since their main purpose is to impress others. The Veblen effect "higher the price of a good, the greater the good is claimed to the extent where it becomes a socially distinctive sign" illustrates this phenomenon. Lambrecht and Skiera (2006) are interested in the choices made by customers of an Internet Service Provider (ISP). Their conclusion states that the choice of a tariff depends on the degree of uncertainty in terms of future consumption.
Zollinger (1995) argues that buyers consider or evaluate prices comparatively, that is to say, they perceive price differences and use them in decision making. In this context, according to this author, the price can have both a driving force and / or brake.
Relationship between perceived price and users' attitudes towards the use of mobile-broadband
Financial resources (Mathieson et al., 2001) that must engage the consumer to access the internet and then to the navigation can be seen as more or less severe. This could lead to a negative attitude and a barrier to the adoption of mobile-broadband. Also, previous studies of Ong et al. (2008), Xin (2004) and Agarwal et al. (2007) showed that price is one of the main obstacles for users to adopt mobile-broadband.
According to Xin (2004), one of the factors explaining the acceptance of SMS by users is its low cost that allows users to communicate. However, recent studies led by Chong et al. (2010) showed results that contradict with those of Ong et al. (2008), Xin and Pagani (2004) and Agawal et al. (2007).
The results of the studies show that the cost is not a determining factor in users' intentions to adopt mobile-broadband. Indeed, it would then be interesting to study whether the Sub-Saharan Africa consumers are willing to spend on mobile-broadband services, given the tariff plan in force. Hence the following hypothesis:
H4: The perceived price has a positive influence on the attitude of users towards the use of 3 G.
Energy
It occupies a privileged position as a key sector to reviving the economy. This is a factor of wealth production and a driving force for socio-economic development of the country. Energy has played a major role in human and economic development as well as in the well-being of society (Diandy, 2007).
Of work in 17 sub-Saharan African countries, it is shown that electricity is an access factor without which ICT adoption will not be possible (Diagne and Ly, 2009). According to the same authors, households with electricity are more likely to adopt technologies such as fixed and mobile phones and the Internet than households that do not have it.
While energy is essential for the deployment of a telecommunications network, the deficiencies of the electricity supply in Africa hinder the growth of the African telecommunications industry (Kibora, 2009). The report on ICT and sustainable development carried out in France in 2008, showed that "for a fleet of more than 60 million mobile devices for electronic communications assets (2G, 3G and similar ...) corresponding to a rate of equipment of 85%, EDF provides a consumption of 130 GWh".
According to another report on ICT in rural areas, modern technologies are subject to a sine qua non condition, the need for energy. The use of ICT is dependent on the availability of electricity. As evidenced by Diagne and Ly (2009), electricity is an essential ICT appropriation access factor. According to Cheneau- Loquay (2010), the problems of access to electricity explain the "mobile fracture" in Africa.
Thus, access to electricity decreases the probability of being digitally excluded and pushed into extreme digital poverty and increases the likelihood of use of mobile phones and landline phones and the use of the Internet.
Relationship between energy and attitude towards the use of mobile-broadband
Access to energy is distributed very unevenly across the globe: ¼ of the population consumes three quarters of the energy and over a third of the world population has no access to electricity. Yet technology especially in the field of ICT that requires energy for development continues to grow.
Today more than ever, with the increasing development of mobile telephony and the continued need for the individual to communicate, energy has become a major concern. The lack of access to energy, affordable and reliable, hinders Africa’s social and economic Development Goals.
We connect in the study construct energy to the attitude towards the use of mobile-broadband. Hence the following hypothesis:
H5: Energy failure has a negative influence on the attitude of the user towards the use of mobile-broadband due to its unavailability.
Attitude towards the use of mobile-broadband
According to Ajzen and Fishbein (1980) and Davis (1989), the attitude is defined by the positive or negative evaluation to emit a behavior. It refers to the feeling of joy, pleasure, disgust, discontent or hatred that associates the individual at a given behavior (Triandis, 1979). The existing behavioral theories such as the theory of reasoned action (1975), the theory of planned behavior (Ajzen, 1985) or the model of Triandis (1979) have proposed the attitude as a determinant of use. Fishbein and Ajzen (1975) model is based on the assumption that beliefs influence behavior through attitude (Triandis, 1979) and believes that attitudes and beliefs are co- determinants of use.
Relationship between attitude and usage of mobile-broadband
In this research, we assume a positive attitude positively influences the use of mobile-broadband. Thus, we state the following hypothesis:
H6: Attitude positively influences the use of mobile-broadband.
Using a convenience sample may be allowed (Calder et al.,1981, 1982) for exploratory studies such as the one of this study. Convenience samples and purposive samples were used. The data were obtained using a questionnaire administered online among a sample of 114 mobile broadband users living in the Sub-Saharan Africa distributed as follows; Western (25%), Central (25%), Eastern (25%) and Southern African (25%) countries.
Sample size
The formula below calculates the sample size:
N = t² x p * (1-p)
m²
N = required sampling size
T = confidence level at 1.96 for a confidence level of 95%
P = estimated proportion of the population with the characteristic studied
M = margin of error at 5% (standard value of 0.005)
Our p proportion is 93% because we admit that the population has a 3G mobile phone.
N = (1.96) 2x 0.93 * (1-0.93)
0.05²
N = 100 people.
All the time, since the survey was administered online, we had 114 individuals, 14 more respondents than expected.
Data analysis and results of the study
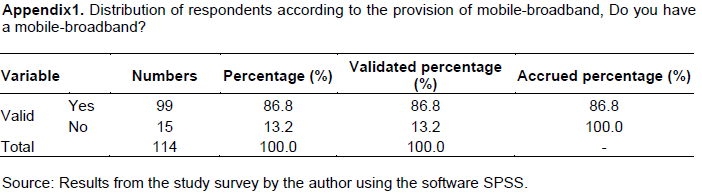
Data analysis was carried out in several stages. After a statistical analysis of sample data (Appendix 1), we checked the reliability and convergent validity of the variables and validate the conceptual model and hypotheses of the study. Data analysis was performed using statistical package for social sciences (SPSS) 20.0 software for descriptive statistics and supplemented by SmartPLS M3 2.0 software for the validation of the measurement instrument and hypothesis testing.
Description of the sample
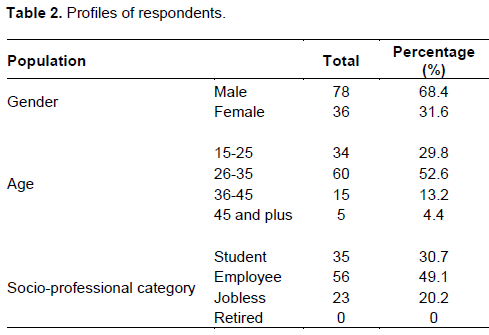
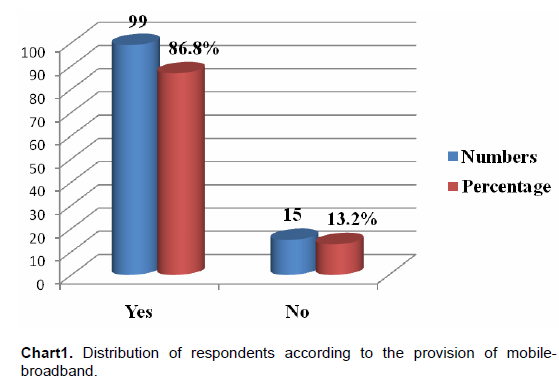
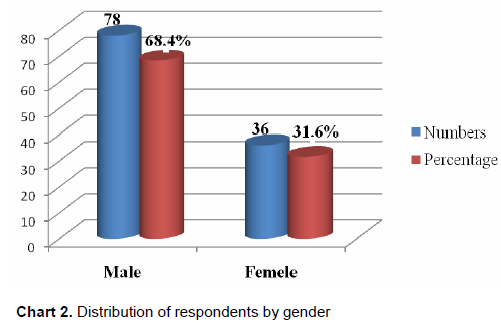
The sample consists of 31.6% women and 68.4% men from west, central, east and south African countries. The age of respondents ranged from under 25 to over 45 years. The class of young people between 15 and 25 years is shown on the threshold of 29.8%. Those with 26-35 years represent 52.6%. Moreover, the class of employees is represented on the threshold of 49.1%, while that of the students 30.7%. We also note that 86.8% of respondents have a mobile-broadband and live in Sub-Saharan Africa. Indeed, the composition of the study convenience sample in terms of gender, age and socio-professional category are presented in Table 2. Gender, age and socio-professional category are variables that are analyzed using SPSS software. Latent variables are measured on a Likert scale of five items ranging from 1 (disagree) to 5 (strongly agree).
The results of the measurement models of the reliability and validity analysis
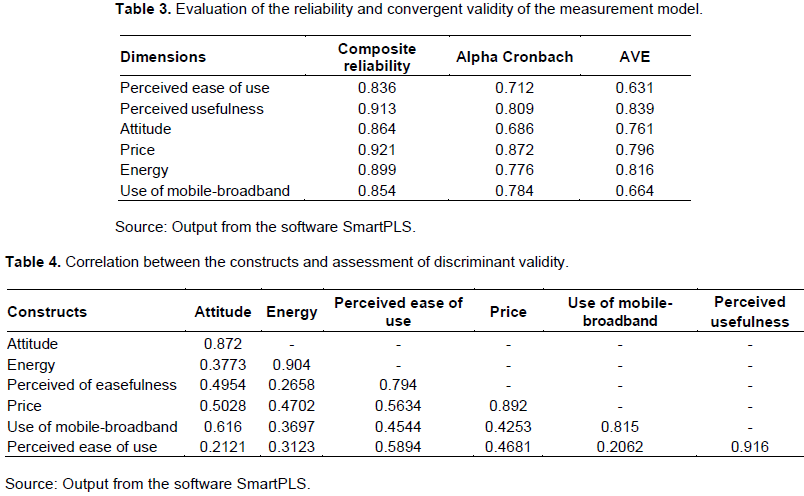
The results from the analysis are presented in Tables 3, 4 and 5. The reliability of Items shall be considered by the value of Cronbach's alpha, all above 0.7 (Nunnally, 1978). Convergent validity was analyzed by two criteria: the AVE greater than 0.5 (Bagozzi, 1998) for all dimensions and T-value greater than 1.96 (Table 3).
All items have good reliability, the Cronbach's alpha coefficients ranging from 0.7 to 0.9. The results from Table 3 confirm a good convergent validity since not only the AVE is greater than 0.5 for all dimensions but also the T-value is greater than 1.96 for all items. Convergent validity is checked (Table 4).
The results in Table 4 show a correlation for each of the variables in the model. Correlations must be less than or equal to the values of square roots of AVE worn diagonally (Gefen et al., 2000). Indeed, the discriminant validity well within the threshold selected by the authors: square root of the AVE is greater than the correlations between variables.
The results from the smartPLS allow us to conclude that the criteria for validation of the measurement model are checked. For the composite reliability coefficients to assess the internal consistency of the scales are all above 0.80. Convergent validity and discriminant honor the thresholds used by researchers (AVE> 0.5).
In essence, the analysis of the psychometric properties (reliability, convergent validity, discriminant validity) shows that we have in this study measures acceptable to proceed to test the structural model.
Evaluation of the structural model
The evaluation of the structural model is based on the predictive relevance of latent variables (Wold, 1975; Jöreskog and Wold, 1982; Wold, 1985), that is to say their nomological validity. We will analyze the coefficient of determination R2, the coefficient Q2 of Stone Geisserand the adjustment index GOF (Goodness-of-fit).
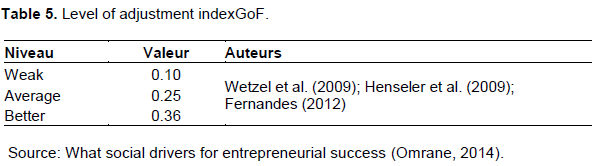
According to Fernandes (2012) "if Q2 is positive, then the model has predictive validity. If it is negative, the constant lack of predictive validity. "Croutshe (2009) also states that the coefficient Q2 is acceptable if it is greater than 0. The level of adjustment index GoF boils is presented in Table 5.
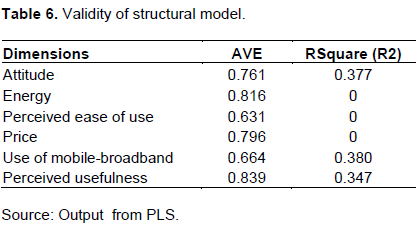
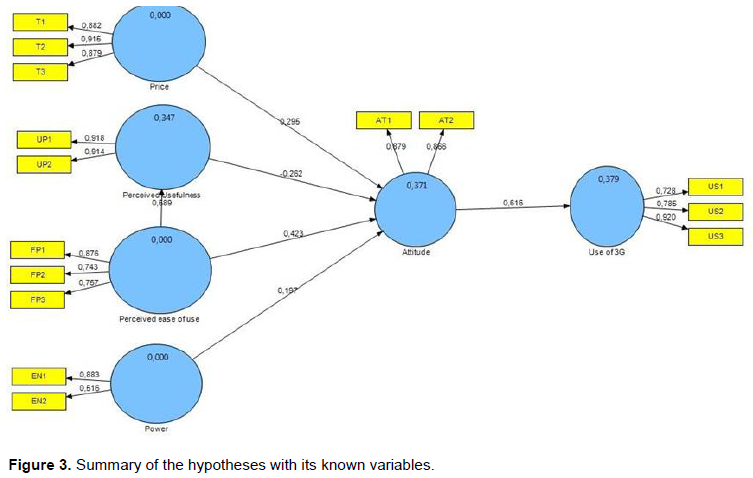
Table 6 shows the validity of the structural model. It shows the values of coefficients of determination (R2) and the AVE for each variable in the model. The mean value of R2 (0.38) is greater than 0.1. The results therefore indicate a good model fit. Similarly, the average value AVE is positive. The model has indeed predictive validity. GoF index is calculated based on the geometric mean of the average R2 and AVE:
GoF = √ (0.751) x (0.368) = 0.53. This index is very satisfactory and confirms the quality of our model. Figure 3 shows the structural model derived from SmartPLS (Figure 3). Following the results from the SmartPLS software, we can conclude that the validation criteria of the measurement model are checked.
Checking of the Hypothesis of the study
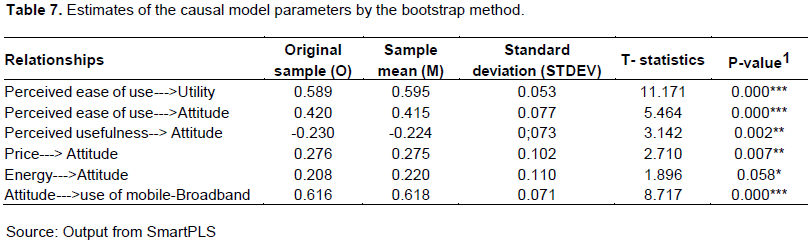
We will present the results of this study in terms of structural relationship between the latent variables using the technique Bootsrap. Critical reports of structural coefficients corresponding to test T and must be greater than 1.96. The value of T and the level of significance for each link are calculated by a method of resampling called Bootstrap. To be meaningful:
(1) 5% risk of error is 0.05, T must have a value greater than or equal to 1.96.
(2) 1% or 0.01 to greater than or equal to 2.75.
(3) 10 or 0.1% greater than or equal to 1.64.
(4) 0.1% or 0.001 a value greater than 3.29 (Table 7).
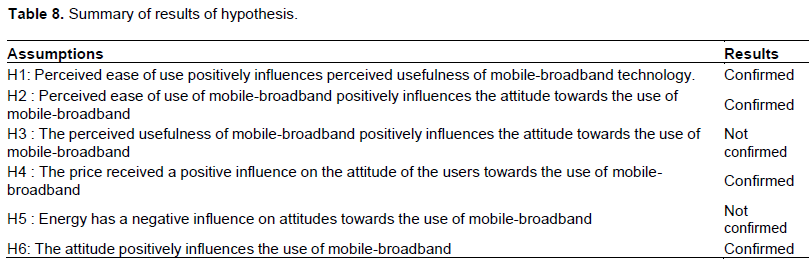
The model assumptions H1, H2, H4 and H6 are checked except the third hypothesis (H3: The perceived usefulness of mobile-broadband positively influences the attitude towards the use of mobile-broadband). Perceived ease of use to perceived usefulness of mobile-broadband technology (H1) has a similar effect (p <0.001) with the perceived ease of attitude towards the (H2) usage and attitude towards the use of mobile-broadband (H6).
We also note that the perceived ease greatly influences the value (0.589; t = 11.171) with respect to the perceived ease of use to attitude (0.420; t = 5.464). This leads us to conclude that some features of mobile-broadband services are easy to use and the user proves the usefulness of mobile-broadband. This result confirms that the one obtained by Pagani (2004) and Oueslati (2007), which reveals that the variable value is the most significant factor of adoption.
As for the attitude, positive influence on the variable use of mobile-broadband is much stronger with a coefficient of 0.616. In addition, the attitude has a significant effect (p value of 0.000) on the level of use. This can be explained not only by a favorable attitude of Sub-Saharan Africa consumer on mobile- broadband but also by the level of acceptance of service.
We note at the end, on the assumption (H4) that the price received has a positive influence on the attitude of users towards the use of mobile-broadband (p<0.01). This justifies the study by Chong et al. (2010) and Sawadogo (2013) showing that the cost is not a factor limiting users' intentions to adopt mobile-broadband. Hypotheses H1, H2, H4 and H6 are confirmed.
In the case of hypothesis (H3), "the perceived usefulness of mobile-broadband positively influences the attitude towards the use of mobile-broadband", we find that the latent variable, perceived usefulness negatively affect the attitude of use (-0.230, p <0.05). The perceived usefulness in the case of our sample does not appear to be significant. This may show that perceived usefulness has no impact to the attitude of Sub- Saharan Africa users of mobile-broadband services.
1*P<0.1; **p<0.05; ***p<0.01; ****p<0.001
Some authors, argue that personal factors, physical factors, psychosocial factors and socio-cultural factors are the four main factors that influence consumer behavior. What characterizes the denial of the hypothesis H3? The hypothesis H5 "energy has a negative influence on the attitude towards the use of mobile-broadband" is not accepted. Indeed, energy (load shedding) has no impact on attitude. These results can be explained by the nature of the study sample of people who all have relatively easy access to energy (Table 8).
DISCUSSION AND CONCLUSION
The study focused on the factors that motivate or inhibit the use of mobile-broadband in the Sub-Saharan Africa. Based on the TAM (Davis, 1986), the study conceptual model includes variable cost energy and considering the socio-economic situation at the moment in the Sub-Saharan Africa relatively high unemployment rate and shedding of electricity became commonplace. TAM model is one of many models used to understand users' decisions to adopt ICT. This research mainly focuses on the determinants of consumer attitudes towards the use of mobile- broadband.
In sum, the model from empirical tests rejects the Hypothesis "The perceived usefulness of mobile- broadband positively influences the attitude towards the use of mobile-broadband." This hypothesis has prevailed since the work of Davis (1989) could not be verified in the context of Sub-Saharan Africa. The hypothesis "energy has a negative influence on the attitude towards the use of mobile-broadband" is also rejected.
The results could be explained by the nature itself of the sample which comprises people who have relatively easy access to energy eg solar, electricity wind, etc. Indeed, the outages of electricity do not discourage consumers in the use of mobile broadband services. This is especially true as a result of shortcomings in the supply of electricity, some Sub-Saharan Africa countries (Nigeria, Ghana and Kenya) have developed alternatives such as generators, battery backup, etc.
The empirical validation of the model on this study with a sample of 114 individuals responding to the questionnaire, we identified the factors that can influence their decision-making and the various obstacles they face in the use of mobile-broadband. These barriers could be inherent in the tariff plan that is elevated and the untimely cuts or almost total absence of electricity.
Thereby resulting in this study analysis, it appears that the attitude towards the use of mobile-broadband Sub-Saharan Africa is influenced by the perceived ease of use and perceived price. It is also clear that the perceived ease of use has a positive influence on perceived usefulness. Also, the rate plan and energy have no direct negative impact on the attitude towards the use of mobile-broadband. This is possible because high tariffs and power cuts do not deter consumers in the use of this service.
The author has not declared any conflict of interests.
The study sample consists of 114 respondents in four (04) age groups:
(1) 34 respondents, 29.8% were aged between 15 to 25 years
(2) 60 respondents, 52.6% were between 2 to 35 years
(3) 15 respondents, 13.2% were aged between 36 to 45 years
(4) 5 respondents, 4.4% were aged between 45 years and older Chart 2: Distribution by age
REFERENCES
|
Agarwal NK, Wang Z, Xu Y, Poo DCC (2007). Factors affecting 3G adoption: An empirical study, proceedings of the 11th Pacific-Asia conference on information system.
|
|
|
|
Agarwal R, Prasad J (1997). The role of innovation characteristics and perceived voluntariness in the acceptance of information technologies. Decis. Sci. 28(3):557-582.
Crossref
|
|
|
|
|
Ajzen I (1985). From intentions to actions: A theory of planned behavior. J. Kuhl, & J. Beckman (Eds.), Action-control: From cognition to behavior. Heidelberg: Springer. pp.11-39.
|
|
|
|
|
Ajzen I, Fishbein M (1980). Understanding attitudes and predicting social behaviour. Englewood Cliffs, N.J. : Prentice-Hall.
|
|
|
|
|
Au AK, Enderwick P (2000). A cognitive Model attitude toward Technology adoption. J. Manag. Psychol. 15(4):266-282.
Crossref
|
|
|
|
|
Bagozzi RP (1998). On the evaluation of structural equation models. J. Acad. Market. Sci. 16:741-94.
|
|
|
|
|
Bass F (1969). A new product growth model for consumer durables. Manage. Sci. 15(5):215-227.
Crossref
|
|
|
|
|
Cheneau-Loquay A (2010). Modes d'appropriation innovants du téléphone mobile en Afrique. Centre d'études d'Afrique Noire. Politique, sociétés, relations internationales au SUD (CEAN).
|
|
|
|
|
Cheneau-Loquay A (2011). La révolution des TIC: du téléphone à Internet.
|
|
|
|
|
Childers TL, Carr CL, Peck J, Carson S (2001). Hedonic and utilisation motivation for online retail shopping behaviour, J. Retail. 77:511-535.
Crossref
|
|
|
|
|
Chong AYL, Darmawan N, Ooi KB, Lin B (2010). Adoption of 3G services among Malaysia consumers: An empirical analysis. Int. J. Mobile Commun. 8:129-149.
Crossref
|
|
|
|
|
Croutshe JJ (2009). Analyse de données en Marketing, Management et en Sciences Sociales: Conceptualisation et Applications. Paris : Editions ESKA.
|
|
|
|
|
Davis FD (1986). A Technology Acceptance Model for empirically testing new end-user information systems: Theory and results. PhD Thesis, Massachusetts Institute of Technology, Sloan school of management, pp.233-250.
|
|
|
|
|
Davis FD (1989). Perceived usefulness, perceived ease of use, and user acceptance of Information technology. MIS Quarterly. 13(3):319-340.
Crossref
|
|
|
|
|
Deng X, Doll WJ, Hendrickson AR, Scazzero JA (2005). A multi-group analysis of structural invariante: an illustration using the technology acceptance model. Information Manage. 42:745-759.
Crossref
|
|
|
|
|
Diandy IY (2007). Consommation d'électricité et croissance dans l'Umoa: une analyse en termes de causalité.
|
|
|
|
|
Diagne A, Ly MA (2009). L'adoption des technologies de l'information et de la communication (TIC) par les ménages africains au sud du Sahara: analyse comparative à partir des micros données. Globelics 2009, 7th International Conférence, Dakar, Sénégal, pp. 1-33.
|
|
|
|
|
Fernandes V (2012). En quoi l'approche PLS est-elle une méthode à (Ré)-découvrir pour les chercheurs en Management?, Management. 15(1):101-123.
Crossref
|
|
|
|
|
Fishbein M, Ajzen I (1975). Belief, attitude, intension and behaviour: an introduction to theory research. Reading, MA: Addison-Wesley.
|
|
|
|
|
Gefen D, Straub DW, Boudreau MC (2000). Structural equation modeling and regression: Guidelines for research practice" Commun. Assoc. Inform. Syst. 4(7).
|
|
|
|
|
Pauwels K, Hanssens DM, Siddarth S (2002). The long term effects of price promotion on category incidence, brand choise and purchace quantity. J. Market. Res. 39(4):421-439.
Crossref
|
|
|
|
|
Jöreskog KG, Wold H (1982). The ML and PLS techniques for modeling with latent variables: historical and compétitiveaspects.In K.G Jöreskog and H. Wold, editors, Systems under indirect observation, part1, North-Holland, Amsterdam, pp. 263-270.
|
|
|
|
|
Katz J (1997). Motives, hurdles and Dropouts, Communication of the ACM 40(4):97-102.
Crossref
|
|
|
|
|
Kibora L (2009), Téléphone mobile : l'appropriation du SMS par une « société d'oralité ». Mobile Phones: The New Talking Drums of Everyday Africa, Cameroon/Leiden: Langaa/ASC. pp. 110-124
|
|
|
|
|
Kopalle PK, Mela CF, Marsh L (1999). The Dynamic Effect of Discounting on Sales: Empirical Analysis and Normative Pricing Implications, Market. Sci. 18:3.
Crossref
|
|
|
|
|
Lambrecht A, Skiera B (2006). Paying too much and being happy about it: existence, causes and consequences of tarif-choice biases. J. Market. Res. 43(2):212-213.
Crossref
|
|
|
|
|
Lichtenstein DR, Ridgway NM, Richard GN (1993). Price Perceptions and Consumer Shopping Behaviour: A Field Study. J. Market. Res. 30:234-245.
Crossref
|
|
|
|
|
Mathieson K (1991). Predicting User Intentions: Comparing the Technology Acceptance Model with the Theory of Planned Behavior.
|
|
|
|
|
Mathieson K, Peacock E, Chin W (2001). Extending the technology acceptance model: the influence of user resources, the Data Bse, 32(3):86-104.
|
|
|
|
|
Nunnally JC (1978). Psychometric theory, McGraw-Hill, 1ère edition, New York.
|
|
|
|
|
Omrane A (2014). Quels leviers Sociaux pour le succès entrepreneurial
|
|
|
|
|
Ong JW, Poong YS, Ng TH (2008). 3 G services adoption among university students: Diffusion of innovation theory. Communications of the IBIMA, 3:114-121.
|
|
|
|
|
Oueslati H (2007). Impact des orientations de magasinage sur l'intention d'achat sur Internet, Actes du 5ème colloque international de la recherche en Marketing, Hammamet. Paap et Franses (2000)
|
|
|
|
|
Rogers EM (1962). Diffusion of innovation, Free Press, NY.
|
|
|
|
|
Rogers EM, Shoemaker FF (1971). Communication of Innovation. Free Press
|
|
|
|
|
Rogers EM (1986), Diffusion of Innovations. New York: Free Press.
|
|
|
|
|
Rogers EM (1995). Diffusion of innovation (4ièmeéd.). New York: The Free Press.
|
|
|
|
|
Rogers EM (2003), Diffusion of innovations (5th edition), New York, Free Press.
|
|
|
|
|
Sawadogo A (2013). Les facteurs déterminant la pénétration de la téléphonie mobile en Afrique : Une étude comparative entre le Mali et le Sénégal
|
|
|
|
|
Shirai M (2003). An analysis of multi-dimensional internal reference prices, Adv. Consumer Res. 30(1):258-263.
|
|
|
|
|
Straub DW, Keil D, Brenner W (1997). Testing the technology Acceptance Model across Cultures: A Three Country Study. Inform. Manage. 31(1):1-11.
Crossref
|
|
|
|
|
Szajna B (1996). Empirical evaluation of the revised technology acceptance model. Manage. Sci. 42(1):85-92.
Crossref
|
|
|
|
|
Taylor S, Todd PA (1995). Understanding Information Technology Usage: A test of Competing Models, Information System research, 6(2):144-176.
Crossref
|
|
|
|
|
Triandis HC (1979). Values, attitudes, and interpersonal behavior. In Nebraska symposium on motivation. University of Nebraska Press.
|
|
|
|
|
Urbany JE (1986). An experimentation examination of the economics of information. J. Consum. Res. 13:257-271.
Crossref
|
|
|
|
|
Van Heerde HJ, Gijsbrechts E, Pauwels K (2008). Winners and losers in a major price war. J. Market. Res. 45(5):499-518.
Crossref
|
|
|
|
|
Vigneron F, Johson LW (1999). A review and a conceptual framework of prestige seeking consumer behaviour, Acad. Market. Sci. Rev. 3:1.
|
|
|
|
|
Wold HOA (1975). Soft modeling by latent aribales: The Non-Linear Iterative Partial Least Squar (NIPALS) approach, in Gani, J. (Editor), Perspectives in probability and statistics, pages, Londres. pp. 117-142
|
|
|
|
|
Wold HOA (1985). Partial Least Squar, Kotz, S. et Johnson, N.L. (Editors), Encyclopedia of Statistical Sciences, John Wiley & Sons, New York. 6:581-591.
|
|
|
|
|
Xin Y (2004). A model for 3G adoption. In Proceedings of the tenth Americas conference on information systems, pp. 2755-2762.
|
|
|
|
|
Zollinger M (1995). Le prix de référence interne: existence et images. Décis Market. 6:89-101.
|
|