This work uses exploratory and confirmatory factor analyses to study Verbal Skills Development Teacher Self-Efficacy Scale (VSDTS), Reading Skills Development Teacher Self-Efficacy Scale (RSDTS) and Writing Skills Development Teacher Self-Efficacy Scale (WSDTS) developed to identify classroom teacher candidates’ perceptions of teacher self-efficacy in developing students’ verbal, reading and writing skills. KMO values above 0.80 in all the three scales showed that the dataset was suitable for factor analysis. It can be argued that the scales are reliable since the factor analyses pointed that all the three scales had a single-factor structure. VSDTS, RSDTS and WSDTS were very good in the principal components analysis conducted under the framework of exploratory factor analysis. Their Cronbach Alpha internal consistency coefficients calculated were in the range of 0.80≤ α <1.00. In the confirmatory factor analysis of VSDTS, good NFI and RMR values and SRMR and CFI values above 0.95 point to substantial fit. In this context, 16-item single factor structure of VSDTS scale was confirmed. For RSDTS, good GFI values, NFI and CFI values above 0.95 and SRMR and RMR values below 0.05 corresponded to substantial fit. In this context, 11-item single factor structure of RSDTS scale was confirmed. For WSDTS, good AGFI values, GFI, NFI and CFI values above 0.95 and SRMR and RMR values below 0.05 corresponded to substantial fit. In this context, 8-item single factor structure of WSDTS scale was confirmed.
Teaching profession as the most profound career that focuses on the training and development of human beings requires one to be highly responsible. In this context, it is crucial for teacher candidates to have special qualities and competence. Self-efficacy is an important form of competence and it gives direction to individuals. There are many studies on the self-efficacy of teachers and as well as pre-service teachers in educational research (Goddard et al., 2000; Henson, 2001; Çakıroglu et al., 2005; Tschannen-Moran and Hoy, 2001; Lin and Gorrell, 2001; Gavora, 2010; Loreman et al., 2013; Girgin, 2017).
Self-efficacy can be defined as an individual’s confidence in his own ability to initiatea nd comple actions that affect the events around him (Bandura, 1994). It is also the quality that is necessary to undertake a task effectively (Kuran, 2002). Relating self-efficacy to teaching, it points to knowledge, comprehension, skills and attitudes that are necessary to undertake the tasks and responsibilities required in the teaching profession (Çetinkaya, 2007). Teacher self-efficacy includes the following: ability to differentiate instructions, adjust and configure curricular, and adopt pedagogical methods that satisfy the learning needs of a wide variety of learners (Loreman et al., 2013). In other words, teacher self-efficacy is the strength and ability of teachers to guide students. It also involves teachers’ beliefs in their ability to successfully undertake tasks related to teaching, to change students’ behaviors (Tschannen-Moran and Hoy, 2001) and to affect students’ performance positively (Berman et al., 1977).
Teachers’ competence is shaped according to an individual’s motivation to teach, his/her characteristics and the training obtained from school. In this respect, teacher training should be given the attention it deserves and professional competence must be obtained during pre-service training.
This study focuses on assessing classroom teacher candidates’ perceptions about their self-efficacy in contributing to the development of language skills, the basis of all learning. Compared to other teachers, classroom teachers have more responsibility in shaping the basics for future learning since they are the ones who first pass educational information to students in formal education setting.
Teachers have the role and responsibility to provide students with the fundamental knowledge and to develop their verbal, reading and writing skills during their first four years of schooling. They prepare learning environments that promote students’ development, organize activities that enhance students’ competence, assess and evaluate students’ performance and take measures that increase students’ academic achievement.
Learners construct their own learning through awareness, as prescribed by constructive learning approach, and effective communication with their environment is only possible with the development of verbal, reading and writing skills which ensure effective use of language. Language skills are the keys that open the door to learning in all other classes. Güneyli (2007) reported that individuals who cannot communicate efficiently, read or write in their own languages would experience difficulties in other classes, whereas individuals with high competence in their own languages would be able to think, create, discuss, question, solve problems and make decisions. Hence, it is suggested that the acquisition of effective language skills can facilitate students’ adaptation to the information age that we are in now. For verbal skills, listening is one of the main routes to obtain knowledge, learn and comprehend.
The strategies used by learners who obtain most of their accumulated knowledge through intensive listening are important. Individuals who have acquired the ability to learn through listening in all types of learning environments are able to use their listening skills and develop themselves (Karadüz, 2010). Listening is not a passive action for the listener; accurate and complete verbal communication requires that the listener, who is the recipient in the process, acts productively. Listening is the task of receiving and interpreting a message and it includes some cognitive behaviors such as perception and comprehension. Speaking is one of the fundamental activities of education and training and it is one of the factors that determines one’s achievement or failure in school, business or social life since knowledge transfer, explanations, presentations, assessment and evaluation between teachers and students are primarily done through speaking (KurudayıoÄŸlu, 2003). Reading is defined as the recognition and perception of print and written symbols that act as stimulants for the recalling of meaning created as a result of prior experiences. It is the construction of new meaning using previous concepts learned by the reader (Tinker and McCullough, 1968); it involves creating meaning from a text and interpreting it (Grabe and Stoller, 2002). It is a process of making meaning where prior knowledge is used based on effective communication between the author and the reader and it takes place for a specific goal using a suitable method in a regular environment (Akyol, 2006). Therefore, reading is regarded as a significant skill for making sense of information and developing relevant perceptions. Writing skills are related to collecting, acquiring and expressing information (Carter et al., 2002), thoughts, ideas, requests and events with some symbols based on specific rules (Demir, 2013). Effective education and training processes are required for individuals to put down their acquisitions on paper. Therefore, identification of classroom teacher candidates’ perceptions about their self-efficacy in developing students’ verbal, reading and writing skills is believed to be important in the teacher training process.
Purpose
This study presents three separate scales developed to determine classroom teacher candidates’ perceptions about their self-efficacy to develop students’ verbal, reading and writing skills and it reports the exploratory and confirmatory factor analyses used for these scales. It is believed that it would be more beneficial to present these three tools together, and hence the factor analyses of the 3 tools are presented together.
Participants
This study undertakes exploratory and confirmatory factor analyses of three separate scales developed to determine classroom teacher candidates’ perceptions about their self-efficacy in developing students’ verbal, reading and writing skills. Data used for the exploratory factor analyses of 3 scales were collected from 149 students of 3rd and 4th year in Classroom Education Department, Akdeniz University. Data used for the confirmatory factor analyses of RSDTS and WSDTS scales were collected from 3rd and 4th year students in Classroom Education Departments of Gazi, Sakarya, GaziosmanpaÅŸa, Cumhuriyet, and Aksaray Universities. Due to the extra number of items in VSDTS scale compared to other scales, data used for confirmatory factor analyses were also collected from Abant Ä°zzet Baysal University students. Table 1 presents the distribution of exploratory and confirmatory factor analyses of the scales based on participants and universities.

According to Tabachnick and Fidell (2001), large samples are not required to obtain high factor loading, and a sample size of 150 is sufficient. According to Kleine (1994), a sample size of 200 is sufficient to obtain reliable factors in a factor analysis, and this figure can even be decreased to 100 when the factor structure is open and limited in number (Çokluk et al., 2012). While it is suggested that sample: variable (item) ratio for sample size should be kept to 10:1, it is proposed that this ratio can be reduced but it should be 2:1 at least (Büyüköztürk, 2002). In the light of this, it can be argued that the sample size used in this work is sufficient for exploratory and confirmatory factor analyses.
Data collection tools
In this study, three separate self-efficacy perception scales were developed to determine classroom teacher candidates’ perceptions about their self-efficacy in developing students’ verbal, reading and writing skills. Literature review shows studies that reported the development of more than one scales together (Cooper et al., 2006).
All the 3 scales used in the study are 5-point Likert type scales
with rating as follows: “Completely Disagree (5), Disagree (4), Partly Agree (3), Agree (2) and Completely Agree (1)”. In order to determine the suitability/validity of the scale items in terms of content validity, scale items in all 3 scales were examined separately by 2 assessment and evaluation experts, 1 Turkish Education expert and 1 Linguistics expert. 90 to 100% agreement among experts was taken as the criterion for item validity. Items that did not meet this criterion were excluded and the scales were finalized in this manner before implementation.
Verbal skills development teacher self-efficacy scale (VSDTS)
Items (25) were written for the scale at first and these items were examined separately by 2 assessment and evaluation experts and 2 language experts. 7 items were excluded according to experts’ views and 5 items were redesigned based on the suggestions of experts. The 16-item scale was finalized in this manner. ANNEX-1 presents the scale items.
Reading skills development teacher self-efficacy scale (RSDTS)
Items (13) were prepared for the scale which was reviewed separately by 2 assessment and evaluation experts and a Turkish Education expert. Language and expression in the items were edited and 2 items that were anonymously agreed on were excluded from the scale. The 11-item scale was finalized in this manner. ANNEX-2 presents the scale items.
Writing skills development teacher self-efficacy scale (WSDTS)
Items (10) were prepared for the scale which was reviewed separately by 2 assessment and evaluation experts and 1 Turkish Education expert. Language and expression in the items were edited and 2 items that were anonymously agreed on were excluded from the scale. The 8-item scale was finalized in this manner. ANNEX-3 presents the scale items.
Data analysis
Firstly, exploratory factor analyses were carried out for the scales. Cronbach Alpha analyses were conducted before confirmatory factor analyses in order to determine internal consistency coefficients for the scales. Confirmatory factor analyses were carried out at the last phase of testing the reliability and validity of the work. While SPSS 20.0 package program was used during the exploratory factor analyses and item analyses in the study, Lisrel 8.30 (Linear Structural Relation Statistics Package Program) was utilized for confirmatory factor analyses.
Factor analysis is conducted to discover the relationship among the variables and factors or to validate whether the variables construct a structure (factor). Exploratory factor analysis should be used when the main goal of the study is to discover the relationship among the variables and confirmatory factor analysis should be used when the main goal is to confirm the factors (Schumacker and Lomax, 1996; Çokluk et al., 2012).
Exploratory factor analysis
KMO and Barlett’s sphericity test were used to test the suitability of the scales for factor analysis. Table 2 displays KMO values and Barlett test results for the scales.
KMO criterion is the proportion of the sum of squares for the total correlation values of the variables to the sum of squares of total and part correlation values. When this proportion is close to 1, the correlation design in the R-matrix is narrow and when the value is close to 0, the design shows dispersion (Field, 2005). Kaiser (1974) reported 0:5 ratio as an acceptable cut of point and classified the KMO values as follows: 0.5- 07: mediocre; 0.7-0.8: good; 0.8-0.9: great; and over 0.9: superb (ÇolakoÄŸlu and BüyükekÅŸi, 2014). In Table 2, the fact that KMO values in all 3 scales are above 0.80 shows that the dataset is suitable for factor analysis. Therefore, from this result one can say that factor analysis can be used for these 3 scales (Çokluk et al., 2012).
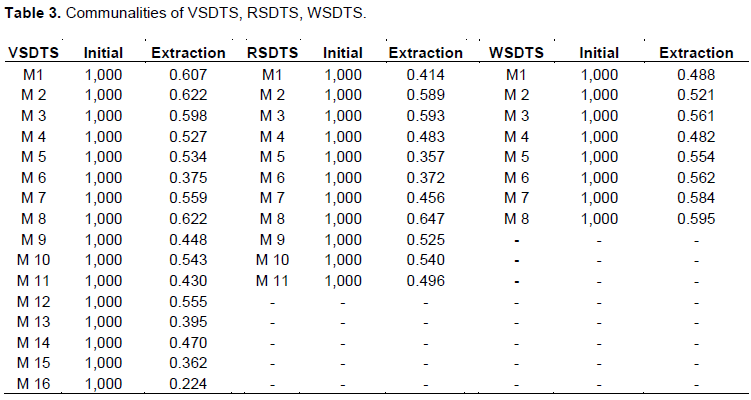
After testing the suitability of the scales used in this study for factor analysis, factor analysis was continued and at first, results of communalities were obtained for the scales. Table 3 displays the communalities for the scales used in the study.
Communalities table presents the ratio of each item to explain the shared variance in a common factor. When the shared variance in an item explained by factors is smaller than 0.10, there is a high probability that these items are problematic (Çokluk et al., 2012). Examination of shared variance in the three scales shows no problems with the items.
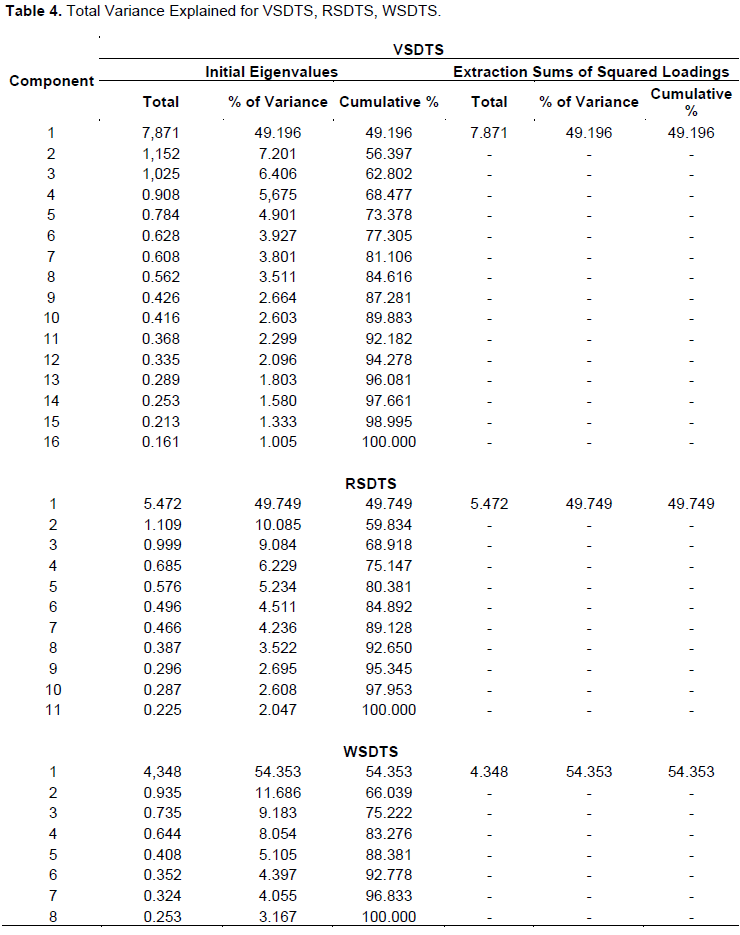
The first column of Table 4 presents the number of items. In the first column, groups of initial eigenvalues, total eigenvalue, percentage of variance and cumulative percentage are provided. Also groups of Extraction Sum of Squared Loadings and suggestions are provided for factor numbers. According to Extraction Sum of Squared Loadings column group for the scales, a single factor is proposed for exploratory factor analysis (Çokluk et al., 2012). Examination of percentage of variance values in the Initial Eigenvalues group shows that the first factor contributed 49.196% to VSDTS, 49.749% to RSDTS and 54.353% to WSDTS. Examination of other factors’ contribution to total variance shows a decreased significance in the constitution. In such cases, it is possible to determine the factor structure as 1 (Çokluk et al., 2012). Another data that can help determine the number of factors is the scree plot graphic. Figure 1 presents the graphics of VSDTS, RSDTS and WSDTS scales.

In the graphics presented in Figure 1, the contributions of the variables to the variance are displayed in points for the variables in Y axis sloping into X axis, and each range between two points means a factor. When the graphics are examined and the slope in all three scales after the second point is taken into consideration, it is seen that the contributions of the factors to the variance are both small and approximately the same. Therefore, it was decided that all three scales had single factors. Since the number of factors is identified to be one, there is no overlapping between factor loadings. However, the size of factor loadings for the scales seems to be significant. Table 5 presents the component matrix for all 3 scales.
Table 5 shows that all items met the criterion of acceptance point of factor loading of 0.32 (Çokluk et al., 2012) and that there were no items with factor loading below this value. Therefore, there was no need to exclude any of the items from the scales.
Reliability analysis
After conducting exploratory factor analyses, confirmatory factor analyses should be taken to assess construct validity for the scales. In this study, Cronbach Alpha analyses were conducted before confirmatory factor analyses to identify internal consistency coefficients for the scales. Confirmatory factor analyses were done at the last phase of assessing the validity and reliability of the work.
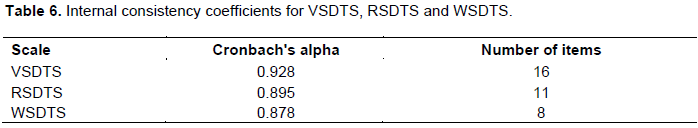
Table 6 presents the internal consistency coefficients for VSDTS, RSDTS and WSDTS scales. Cronbach Alpha internal consistency coefficient calculated according to the variance of each item was identified to be 0.928 in VSDTS scale, 0.895 in RSDTS scale and 0.878 in WSDTS scale. According to Özdamar (1999), when the Cronbach Alpha internal consistency coefficient of the scale is in 0.80≤ α <1.00 range, the scale is highly reliable. Therefore, the features measured by VSDTS, RSDTS and WSDTS are homogenous. Based on these results, it can be argued that VSDTS, RSDTS and WSDTS are reliable tools.
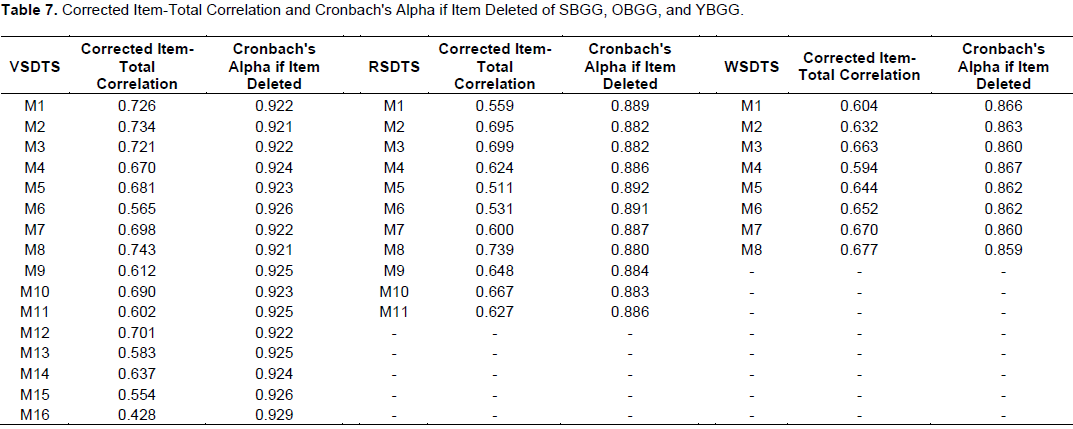
When Corrected Item-Total Correlation and Cronbach's Alpha if Item Deleted conducted to present additional reliability evidence (Table 7) are examined, it is observed that total item correlations for VSDTS changed between 0.428 and 0.743. Cronbach Alpha coefficient of the scale was found to be 0.928. This suggests that excluding only Item 16 from the scale would increase reliability to 0.929. However, since the increase was minor, it was decided to keep the item in the scale. Total item correlations for RSDTS changed between 0.511 and 0.739. Cronbach Alpha coefficient of the scale was found to be 0.895. Since exclusion of items would decrease reliability of the scale, no items were excluded. Total item correlations for WSDTS changed between 0.594 and 0.677. Cronbach Alpha coefficient of the scale was found to be 0.878. Since exclusion of items would decrease reliability of the scale, no items were excluded.
Confirmatory factor analysis
Confirmatory factor analysis (CFA) was conducted to determine construct validity for the scales. Confirmatory factor analysis is used to evaluate the validity of the factorial construct previously determined by the researcher (Floyd and Widaman, 1995; Kline, 2005; Çokluk et al., 2012) and presents detailed statics about the concordance of obtained data (Sümer, 2000).
Two types of matrices, correlation and covariance matrix are used in social sciences for confirmatory factor analysis and the researcher determines which one to be used (Çokluk et al., 2012). Covariance matrices were used in the current study.
Figures 2, 3 and 4 present the confirmatory factor analysis path diagram for VSDTS, RSDTS and WSDTS, respectively.
In Figures 2, 3 and 4, p value for all three scales was significant at 0.00 level of significance. However, in such large samples, it is highly probable to obtain significant p values (Yılmaz and Çelik, 2009). Hence, alternative fit indices are used to examine the concordance between the expected and observed covariance matrices. Table 9 presents the other fit indices and concordance levels for the forms.
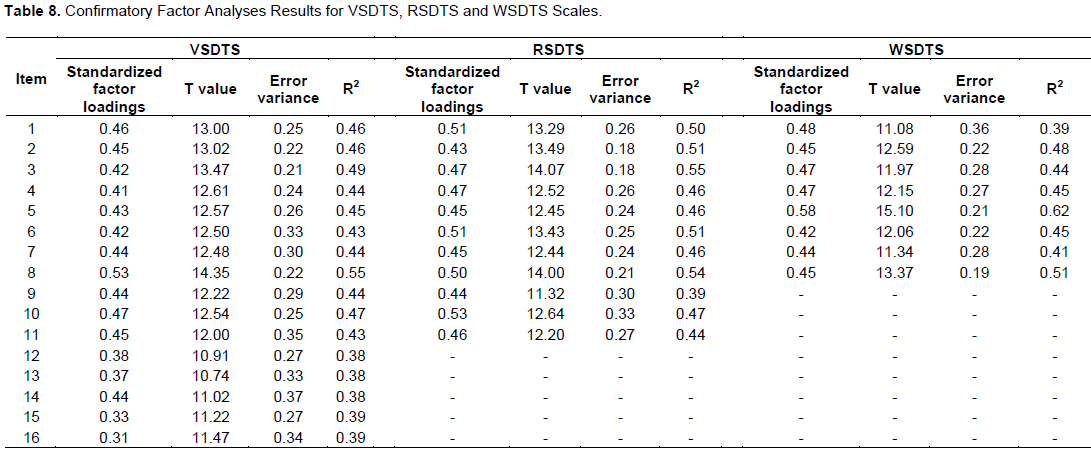
Standardized factor loadings reported as a result of confirmatoryfactor analysis show the correlations between each observed variable and the latent variable it is connected to. Correlation values lower than 0.30 point to low level relationships (Büyüköztürk, 2011). Examination of the table 8 shows that standardized factor loading for VSDTS, RSDTS and WSDTS scales was above 0.30.
R2 shows the explained variance; how much of the latent variable is explained by the observed variance. In other words, it presents the variance explained in each variable (ÅžimÅŸek, 2007). This value is the most (0.55) and the least (0.38) for VSDTS scale; the most (0.55) and the least (0.39) for RSDTS scale and the most (0.62) and the least (0.39) for WSDTS scale. Error variance presents the variance not explained by the indicator naturally. Error variance for the indicator is found by squaring indicator weight and subtracting it from “1” (Åžahin et al., 2008).
Since the p value of the model provides information about the significance of the difference between the expected covariance matrix and the observed covariance matrix, it is not expected to be significant. T values obtained through confirmatory factor analysis path diagram provide information on how much the latent variables explain the observed variables. If the t value is over 1.96, it is significant at 0.05 level of significance and if it is over 2.56, it is significant at 0.01 level of significance. When t values are below 1.96, they are not considered significant (Çokluk et al., 2012). As a result of analyses, p value for all three scales was found to be significant at 0.00 level of significance. However, in large samples the probability of having significant p values is high (Yılmaz and Çelik, 2009). Hence, alternative fit indices are used to examine the concordance between the expected and monitored covariance matrices (McDonald and Moon-Ho, 2002; Schermelleh-Engel et al., 2003; Joreskog and Sörbom, 2001). For instance, according to Joreskog and Sörbom (2001), the most commonly used indices are goodness of fit index (GFI), adjusted goodness of fit index (AGFI), normed fit index (NFI), root mean square residual (RMR) and root mean square error of approximation (RMSEA). In this study, GFI, AGFI, NFI, RMR, SRMR and RMSEA were taken into consideration in the framework of confirmatory factor analysis. Table 9 presents the other fit index values and levels for the scales.

Examination of fit indices presented in Table 9 shows the x2/sd ratio for VSDTS as 4.81; for RSDTS as 2.76 and for WSDTS as 3.18. In small samples, x2/sd ≤2.5 points to substantial fit, while x2/sd ≤3 means substantial fit in large samples (Kline, 2005). When this ratio is below 5, the fit is moderate (Sümer et al., 2006). Considering the obtained x2/sd values, it can be argued that VSDTS scale has acceptable level of fit, WSDTS scale has moderate level of fit and RSDTS scale has substantial level of fit.
VSDTS (RMSEA) was calculated to be 0.103. The calculated value corresponded to weak goodness of fit in RMSEA (≤0.10) (Tabachnick and Fidell, 2001). RSDTS (RMSEA) was found to be 0.081 and WSDTS (RMSEA) was 0.090. RSDTS and WSDTS RMSEA values point to acceptable goodness of fit values (Schermelleh-Engel et al., 2003). VSDTS (SRMR) was found as 0.028, RSDTS (SRMR) as 0.43 and WSDTS (SRMR) as 0.45. VSDTS (RMR) was measured as 0.032, RSDTS (RMR) as 0.021 and WSDTS (RMR) as 0.021. SRMR and RMR values below 0.05 point to substantial goodness of fit while values below 0.08 point to good fit (Brown, 2006; Çokluk et al., 2012). In this case, VSDTS, RSDTS and WSDTS scales point to substantial goodness of fit.
VSDTS GIF was measured as 0.85, AGFI as 0.81; RSDTS GFI was measured as 0.93, RSDTS AGFI as 0.89 and WSDTS GFI was measured as 0.95 and AGFI as 0.90. Values over 0.85 in GFI and AGFI indices indicate acceptable fit (Yılmaz and Çelik, 2009). While values over 0.90 point to good fit, values over 0.95 point to substantial fit (Hooper et al., 2008). However, as cited in Yurt and Sünbül (2014), Anderson and Gerbing (1984), Jöreskog and Sörbom (1993), Cole (1987), and Marsh et al. (1988) regard AGFI ≥0.80 as acceptable fit values.
Compared with suitability of H0 hypothesis, the following values show increase in the fit by using the assumed model (Mels, 2003): VSDTS (NFI)= 0.93; RSDTS (NFI)= 0.97; WSDTS (NFI)=0.96; VSDTS (CFI)=0.94; VSDTS (CFI)=0.95; RSDTS (CFI)=0.97; WSDTS(CFI)=0.97. CFI index values over 0.95 point to substantial fit (Tabachnick and Fidell, 2001).
Based on the results of these analyses, it can be argued that the scales in general had a good fit with the data and factor structure confirmed.