Full Length Research Paper
ABSTRACT
The purpose of this study is to investigate the differences in anger traits of university students and teacher candidates studying in various social and cultural regions, of Batman and Denizli, Turkey. Modelling anger and anger expression style scale according to some variables such as age, gender, education level, number of siblings, parents’ education level was used. The study was carried out in the academic year of 2014-2015. The study population consists of a total of 551 students: 263 are from Batman University; of these, 166 are females and 97 are males; 114 are between the ages of 16-20, and 121 are between the ages of 21 and 24, and 28 are over 25. 288 are from Pamukkale University; of this, 169 are females and 119 are males; 134 are between the ages of 16-20, and 135 are between the ages of 21 and 24, and 19 are over 25. Demographic characteristics and trait anger-anger expression style scale was employed as measurement tools in data collection. In order to test whether the structure of Trait Anger and Anger Expression Styles Scale (TAAESS), defined as 4 factors, was verified in predetermined participation group, Confirmatory Factor Analysis (CFA) (Garson, 2005) was conducted using LISREL program (Joneskog and Sorbom, 1998) and its Turkish version that was translated by Ozer (1994). After TAAESS validity and reliability study was carried out, first level 4 factor Robust ML model was developed in reliability study. Result of this study showed that 4 factors of scale can bring out more consistent results even with 30 items as well. Differences in anger subscales including trait anger, anger-in, anger-out, anger control level differences were found statistically meaningful. It can be proposed that the origin of these differences is probably from the participants’ different social and cultural environments. Among suggestions given for professionalization of university students, and future educators against anger, it is proposed that model of 4 factor Robust ML with 30 items should be employed in researches by increasing social and cultural activities, raising awareness of society against anger and utilizing TAAESS.
Key words: Anger behaviours, education, Robust ML Model.
INTRODUCTION
Recently, technology has advanced and improved at unprecedented levels. With this development, it has been observed that human values and time shared with others have decreased dramatically. That these values have lost their importance causes people to spend less time together, not to listen to each other and unable to control their anger. Among these feelings, anger is one of the most crucial feelings we suffer from and we have difficulty controlling it. Anger can change from a slight depression to a high state of anger. If expressed properly, anger is extremely important for one’s health. When it is out of control, it may cause problems with personal relations at school or work. There lies anger at the root of many problems (Wilde, 2006). Anger is defined as a feeling one has when his requests, needs, plans are hindered or when he feels there is a threat against him as injustice (Kısac, 1999). Anger may stem from inner and outer factors. Inner factors are feelings, while outer factors are threats such as physical injuries, frustrations, exposure to offense and injustice. When all these feelings combine, anger occurs (Kokdemir, 2004).
The behaviours of individuals are explained in three ways: when individuals are exposed to injustice, their level of anger increase; and when they are angry, and express their anger orally or with their behaviour, they express external pulse anger; however, when the individual keeps his anger in him, it represents the inner anger; and when he gets angry with others, how he controls himself is called anger control (Starner and Peters, 2004). It is necessary that individuals be taught that people who can control their anger can be healthier. The healthiest environments where these emotions can be taught are schools. Education programmes are needed at schools so that anger control can be taught (Adana and Aslantas, 2011).
The feeling of anger should be perceived as harm to an individual himself and others. Anger can be converted into a healthier tool by means of good education (Tatlilioglu and Karaca, 2013).
The anger of some individuals is directed to their inner world. These individuals do not show their anger; however, they exhibit their reactions as crossing and sulking. The case can change into suffering or resentment at the end. Individuals with inner anger do not put their anger forth immediately when they get angry. Never-theless, they think about the type of reactions to people whom they get angry with. They wait for the proper time to display their inner anger (Lulofs and Cahn, 2000). An individual who experiences feelings such as anger, fear and worry in an environment where his/her children are present may have behavioural problems in similar conflict environments. It is stated in the literature that the feeling of anger is intensive during this period (Sahin and Batıgun, 2009). When anger levels of parents are high, it leads to the raising up of highly risky children together (Reid et al., 2002).
In general, assessing anger negatively results from the expression style of anger. In order to cope with anger, it is necessary for a person to define anger instead of suppressing it (Morriz, 2002). If parents cannot tolerant each other, their children become intolerant as well (Ozmen, 2004). It is established that students with constant anger either express their anger more or suppress it; and these students feel lonely. It can be considered that students who exhibit constant anger and cannot control their anger can be set away from friendly atmosphere since they establish inappropriate behaviours (Kaya at al., 2012). Anger and expression of anger is a result of cultural, mental and biological backgrounds (Soykan, 2003).
In recent years, when the studies are examined, it is clearly seen that anger researches have been increasing every passing day. As the results of the studies conducted, it has been witnessed that realistic steps have not been put forward about solution to anger. In both groups, based on many variables, the statistics of anger subscale levels (anger within, anger trait, anger outburst, anger control) have been found meaningful. For the reasons of the differences between both groups, they may stem from social and cultural diversities of the regions where the universities are situated. It is possible to state that social and cultural development may have positive influence on anger level. It is suggested that next generation teachers utilize first level 4 factor Robust ML model. It will help them with their future studies to cope with their anger more professionally, increase the number of cultural and social activities and raise the awareness of their community against anger. This study will help the youths in society to understand anger in, anger out, trait anger and anger under control. Such a study will guide all institutions and organizations in arranging students’ and families’ oriented education programs.
METHOD
Personal information form
In order to determine the ages, genders, education levels, number of siblings, education levels of their fathers, trait anger and anger styles of university students in two different regions, an information form prepared by the researcher is employed. In this study, on 5-7 November 2015, "International Dynamic, Exploratory and Active Learning (IDEAL) Conference" organized by the University of Amasya was presented as a verbal statement.
In Table 1, the distribution of demographic properties of university students is examined. In this study, according to the university variable, there are 288 (52.3%) students attending Pamukkale University, and 263 (47.7%) students attending Batman University. When the gender distributions of the students are examined, there are 335 (60.8%) females and 216 (39.2%) males. When the age distributions of the students are studied, there are 248 (45.0%) students at “16-20” age clearance and 256 (46.5%) students at “21-24” age clearance and 47 (8.5%) students at “25 and over” age clearance. When the distribution of students studying at Pamukkale University is examined, it can be seen that the population consists of 169 (58.7%) female and 119 (41.3%) male students. On the other hand, when the distribution of students studying at Batman University is inspected, it can be seen that the population consists of 166 (63.1%) female and 97 (36.9%) male students. When the age distribution of Pamukkale University students is examined, it is seen that there are 134 (46.5%) students between the ages of “16-20”, and 135 (46.9%) students between the ages of “21-24”, and 19 (6,6%) students over 25; while at Batman University there are 114 (43.3%) students between the ages of “16-20”, and 121 (46.0%) students between the ages of “21-24” and 28 (10.6%) students “over 25”.
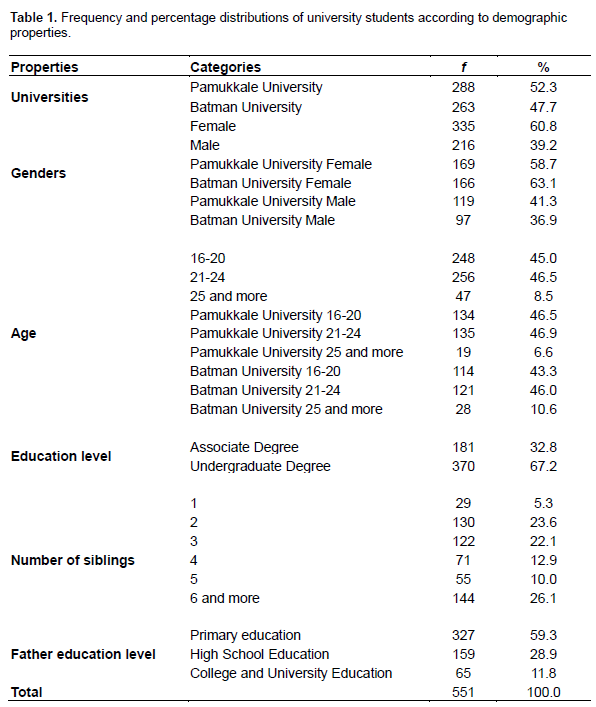
When the education levels of the students are investigated, there are 181 (32.8%) students having associate degree, and 370 (67.2%) students have undergraduate degree. When the students are examined based on the number of siblings they have, 29 (5.3%) students have 1 sibling; 130 (23,6%) students, 2 siblings; 122 (22.1%) students, 3 siblings; 71 (12.9%) students, 4 siblings; 55 (10.0%) students, 5 siblings and 144 (26.1%) students, 6 and more siblings. When the distributions of the students based on their fathers’ education level are studied, there are 327 (59.3%) students whose fathers are primary school graduates, 159 (28.9%) students whose fathers are high school graduates, and 65 (11,8%) students whose fathers are university graduates. Considering the general population, there are 551 (100.0%) university students in the study.
Data collecting tool
The validity and reliability of the tool was carried out by Ozer (1994). The scale consists of 30 items and it has trait anger, anger under control, anger-out, and anger in sub-scales. In the study of validity and reliability, Chronbach Alpha values were as 0.79 for anger trait scale, 0.84 for anger under control scale, 0.78 for anger out scale, and 0.62 for anger in scale. Anger trait subscale can be obtained via total of the first 10 items in the scale; and anger in subscale via items 13, 15, 16, 20, 23, 26, 27 and 31, and anger out subscale via items 12, 17, 19, 22, 24, 29, 32 and 33, and anger control subscale via items 11, 14, 18, 21, 25, 28, 30 and 34, respectively. The high points obtained from trait anger show that anger level is high; the high points obtained from anger under control scale show that anger can be controlled; the high points obtained from anger out scale show that anger can be easily controlled, and the high points obtained from anger in scale show that anger is suppressed (Savasir and Sahin, 1997).
Study of confirmatory factor analysis (CFA) of the scale of trait anger anger style scale (TAAESS)
Validity of the study
Confirmatory factor analysis (CFA) is used in confirming 4 factor structures obtained as a result of exploratory factor analysis predefined scale utilized in this study. When the following values are studied, related analysis results are analyzed to know whether the scale can provide multivariate normality assumption or not. According to these values, Relative multivariate Kurtosis=1.108. The fact that this value is bigger than 1.00 shows that normality assumption is not provided. Besides, when skewness and kurtosis values are observed, it can be seen that multivariate normality assumption is not provided since it is meaningful according to p<0.05.
Test of multivariate normality for continuous variables
Skewness Kurtosis
Value Z-Score P-Value Value Z-Score P-Value
25.817 21.171 0.000 996.519 13.334 0.000
Skewness and Kurtosis
Chi-Square P-Value 25.817
626.011 0.000
According to these results, had the variable normality assumption been provided, it would have used Maximum Likelihood (ML) parameter estimation method. However, since it did not provide this and our sampling was smaller, and since it was not related to sampling, Robust Maximum Likelihood (Robust ML) parameter estimation method was employed. This model is first Level 4 factor Robust ML method.
Confirmatory factor analysis (CFA)
To uncover the anger and furry reactions of individuals, whether trait anger anger style scale 4 factor and 34 item structure is confirmed or not was examined via CFA. CFA aims to evaluate how much a factorial model, a form of factor of numerous observable variables (secret variables), shows compliance with real data. The model was determined by employing the data of an empirical study or was defined as a manipulated structure depending on a specific theory (Sumer, 2000). In order to assess the validity of CFA, a number of conformity indexes are employed. Of these, the mostly used ones are: Chi-Square Goodness, (Chi-Square Goodness, χ2), Comparative Fit Index (Comparative Fit Index, CFI), Non- Normed Fit Index (Non-Normed Fit Index, NNFI), Normed
Fit Index (Normed Fit Index, NFI), Goodness of Fit Index (Goodness of Fit Index, GFI) (Cole, 1987; Sumer, 2000).
The fact that the values observed in scale model are between the clearance of Χ2/d<3; 0<RMSEA<0.05; 0.97≤NNFI≤1; 0.97≤CFI≤1; 0.95≤GFI≤1 and 0.95≤NFI≤1 shows it is a perfect fit; and the clearance of 4<Χ2/d<5; 0.05<RMSEA≤0.08; SRMR≤0.08; 0.95≤NNFI≤0.97; 0.95≤CFI≤0.97; 0.90≤GFI≤0.95 and 0.90≤NFI≤0.95 shows it is an acceptable fit (Kline, 2005; Sumer, 2000).
The validity of the scale
In order to evaluate whether 4 factor and 34 items of the scale are confirmed or not, CFA was applied. In the first applied CFA, the items not having non-significant t values were examined statistically. CFA analysis was repeated after 12th, 17th, 19th, and 31st items having non-significant t values were removed from the scale. The obtained path diagram is shown in Figure 1.
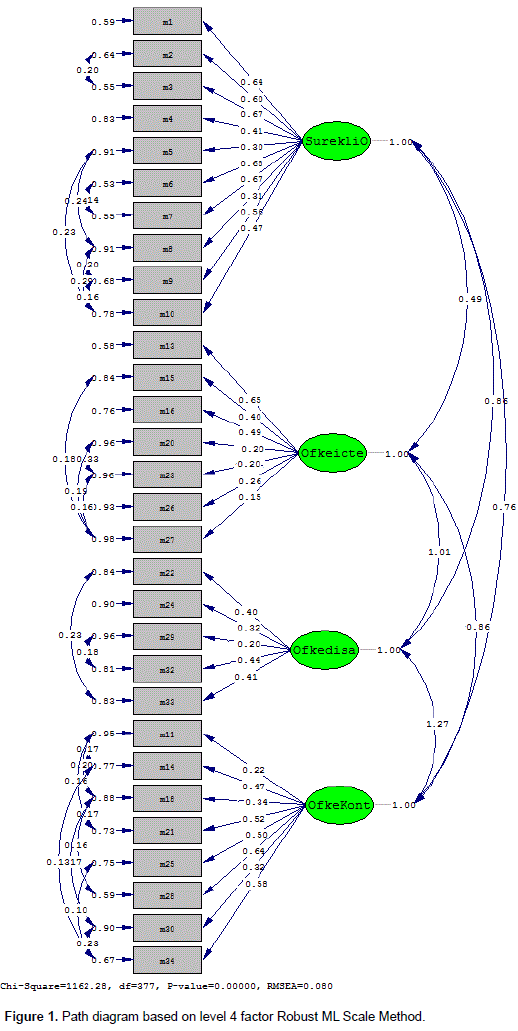
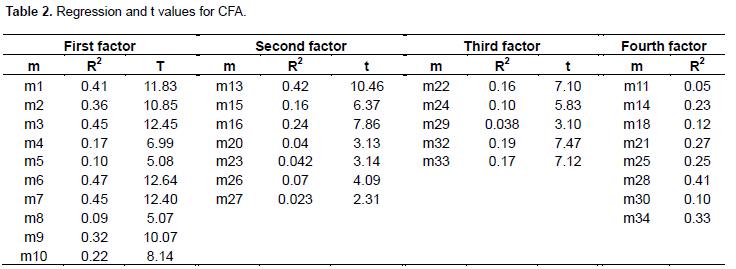
The fit indexes were found as χ2=1162.28, sd=377, X2/sd= 3.08, CFI=0.96, NNFI=0.95 and NFI=0.93, GFI=0.90 RMSEA=0.080, SRMR=0.072. When the coefficients of the relations between variables of the model exhibiting factorial structure of the scale were examined, the fit indexes were at sufficient levels. When fit index values and error values of RMSEA and SRMR were observed, an acceptable fit was reached. When fit statistics calculated via CFA were taken into consideration, it was decided that 4 factor structures defined before were generally in line with data collected. When Figure 1 is examined, it is seen that the scale whose final state is given consists of 30 items and 4 factors. Regression and t values belonging to the items are given in Table 2.
When Table 2 is examined, it is determined that the obtained regression coefficients and t values are significant and that the model is verified. While first factor of m6 is seen to be the most important item with R2=0.47, it is concluded that m8 is the least important item with R2=0.09. While second factor of m13 is seen to be the most important item with R2=0.42, it is concluded that m27 is the least important item with R2=0.023. While third factor of m32 is seen to be the most important item with R2=0.19, it is concluded that m29 is the least important item with R2=0.038. While the fourth factor of m28 is the most important item with R2=0.4, it is concluded that m11 is the least important item with R2=0.05. Generally, it is concluded that m6 is the most important item of the scale with the value, R2=0.05; however, m27 is the most unimportant item of the scale with R2=0.023.
Reliability study of Scale of Trait Anger Anger Style Scale (TAASS)
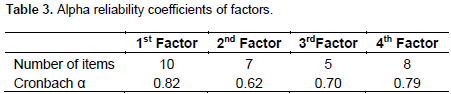
For the reliability of the scale, items determined for each factor are shown in Table 3 showing Cronbach alpha inner coefficient consistency. When taking all questions into consideration in calculation, this coefficient is the coefficient number best reflecting the general reliability structure of the test according to other coefficients (Ozdamar, 2004).
According to Table 3, Cronbach alpha internal consistency coefficients are determined that reliability coefficient and high level of reliability are found to be 0.82 for 1st Factor; 0.62 for 2nd factor; 0.70 for 3rd Factor and 0.79 for 4th Factor, respectively. These coefficients prove that the scale has acceptable level of internal consistency for all factors. The fact that the items have high level of reliability within themselves is determined by means of reliability coefficients. Tezbasaran (1997: 47) states that a reliability coefficient to be accepted as sufficient in a Likert type scale should be close to 1 as much as possible. According to these results, it can be said that all of the factors of the scale used for this study have high reliability level.
Data analysis
The data collected in line with the purpose of the study are processed by IBM SPSS-21 program. The frequency and percentage distributions of demographic properties of the university students are inspected. To find out the levels of perception of anger related to Trait Anger Anger Style Scale sub factors, descriptive statistics (mean, standard deviation, minimum and maximum scores) are looked into. With the help of independent sample t-test analysis, the differences between the perception levels of anger obtained from sub-factor of scale used are observed according to university, gender and education states of students. On the other hand, with the help of One-Way Anova analysis, the differences between perception levels of anger obtained from the sub factors of the scale used are looked at according to the ages, number of siblings and education levels of fathers of the students. CFA is carried out employing LISREL program to test whether the described trait anger anger style scale with 4 factor structure is confirmed or not in participants’ group determined. In order to test the reliabilities of sub factors of scale, Cronbach Alpha internal consistency analysis is checked.
FINDINGS
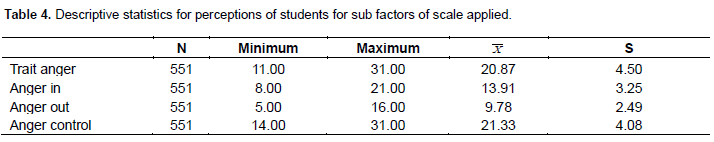
In Table 4, it is seen that when the perception levels belonging to “Trait Anger” sub-factor of university students are compared with (X=20.87) maximum (31.00) and minimum (11.00) values, it approximately has medium level perception; that is to say, the anger level is at medium level. It is seen that when perception levels belonging to “anger-in” sub-factor are compared with (X=13.91) maximum (21.00) and minimum (8.00) values, it approximately has medium level perception; that is, its levels of transferring anger in are at medium level. When perception levels belonging to “anger-out” sub-factor are compared with (X=9.78) maximum (16.00) and minimum (14.00) values, the students approximately have medium level perception; that is, the anger is not controlled and its levels of diverting out or other objects are at medium level.
It is seen that when perception levels belonging to “anger-in” sub-factor are compared with (X= 21.33) maximum (31.00) and minimum (11.00) values, it approximately has medium level perception; that is, its levels of anger controllability are at medium level. Based on the students’ university, when the differences between the perceptions of sub factors of trait anger anger style scale are examined, under “Trait Anger” sub-factor, there is no significant difference between the anger levels of the students attending Pamukkale University (X=20,92) and Batman University (X= 20.82), according to t(549)= 0.26, p=0.796>0.05 (Table 5).
With regard to sub-factor of “Anger-in”, there is significant difference between the levels of anger suppression of students attending Pamukkale University (X=13.59) and the levels of anger suppression of students attending Batman University (X=14.27), according to t(549)=2.48, p=0.014<0.05. This significant difference stems from the fact that the levels of transferring anger in and suppression of the students attending Batman University are higher than those of Pamukkale University. In relation to sub-factor of “Anger-out”, there is no significant difference between the levels of not controlling but directing anger out among the students attending Pamukkale University (X=9.75) and Batman University (X=9.82)according to t(549)=0.34, p=0.738>0.05.
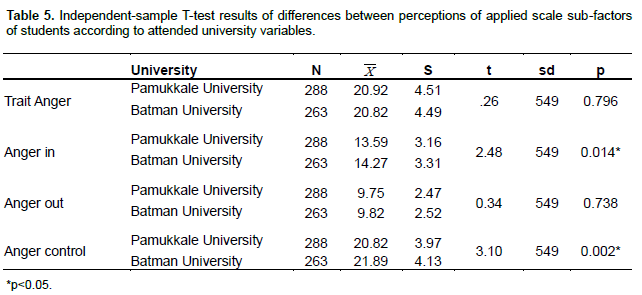
In relation to sub-factor of “Anger-control”, there is a significant difference between the levels of controlling anger with the students attending Pamukkale University (![]() =20.82) and Batman University (X=21.89), according to t(549)=3.10, p=0.002<0.05. This significant difference stems from the fact that the students receiving education in Batman University have higher anger control levels than those of Pamukkale University.
=20.82) and Batman University (X=21.89), according to t(549)=3.10, p=0.002<0.05. This significant difference stems from the fact that the students receiving education in Batman University have higher anger control levels than those of Pamukkale University.
In Table 6, the differences between perceptions belonging to sub factors of trait anger anger style scale are examined according to the genders of the students; there is no significant difference between the female students’ anger level heights (X=20.87) and the male students’ anger level heights (X=20.86) in relation to sub factor of “Trait Anger” according to t(549)=0.03, p=0.973>0.05. In relation to sub factor of “Anger-in”, there is no significant difference between the female students who supress their anger levels (X=14.04) and male students who supress their anger levels (X=13.71) according to t(549)=1.19, p=0.235>0.05.
In relation to sub factor of “Anger-out”, there is no significant difference between the levels of female students’ not controlling their anger and expressing it out with (X=9.78) and the levels of male students’ not controlling their anger and expressing it out with (X=9.79), according to t(549)=0.02, p=0.982>0.05.
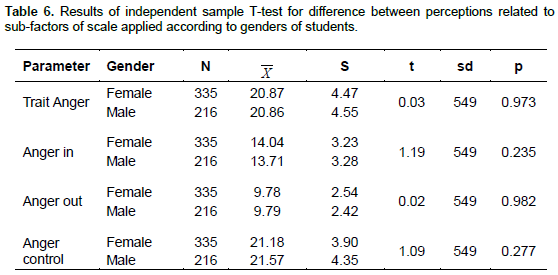
In relation to sub factor of “Anger control”, there is no significant difference between the levels of the female students’ controlling their anger (X =21.18) and the levels of male students’ controlling their anger (X =21.57) according to t(549)=1.09, p=0.277>0.05. When the differences between the perceptions belonging to TAASS sub factors are examined according to the ages of the students, in relation to the “Trait Anger” sub factor, there is no significant difference between the anger levels of the students’ ages according to F(2/548)=0.11, p=0.893>0.05 (Table 7).
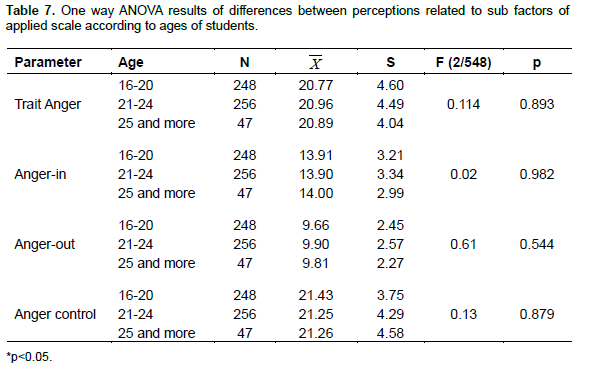
In relation to “Anger-in” sub factor, there is no significant difference in anger suppression levels of the students in terms of age according to F(2/548)=0.02, p=0.982>0.05.
In relation to “Anger-out” sub-factor, there is no significant difference between not controlling their anger but directing it out in terms of the age of students according to F(2/548)=0.61, p=0.544>0.05.
In relation to “Anger Control” sub-factor, there is no significant difference between keeping their anger under control in terms of their ages according to F(2/548)=0.13, p=0.879>0.05. When differences between perceptions belonging to sub-factors of TAASS according to students’ education levels, in relation to “Trait Anger” sub factor, there is no difference between the anger level of those with associate degree (X =21.19) and those with undergraduate degree level (![]() =21.19), according to t(549)=1.18, p=0.237>0.05 (Table 8).
=21.19), according to t(549)=1.18, p=0.237>0.05 (Table 8).
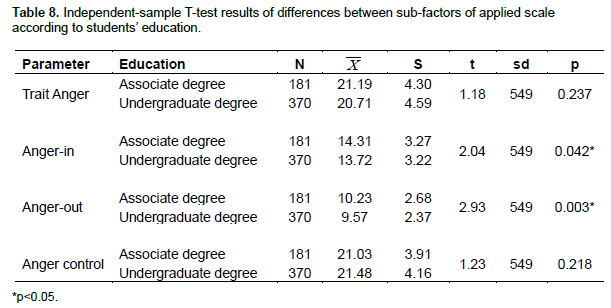
In relation to “Anger-in” sub-factor, there is significant difference between anger suppression levels of students with associate degree education (X =14.31) and those with undergraduate degree (X =13.72), according to t(549)=2.04, p=0.042<0.05. This significant difference stems from the fact that the levels of anger-in or anger suppression in students with associate degree are higher than those with undergraduate degree.
In relation to “Anger-out” sub-factor, there is a significant difference between the levels of not controlling anger but expressing it out of students with associate degree (X =10.23) and those of undergraduate students (X =9.57) according to t(549)=2.93, p=0.003<0.05. This significant difference stems from the fact that the levels of not controlling anger but expressing it out with the students receiving associate degree education are higher than those of undergraduate students. In relation to “Anger Control” sub-factor, there is no significant difference between the levels of anger control of students with associate degree (X =21.03) and undergraduate students (X =21.48), according to t(549)=1.23, p=0.218>0.05.
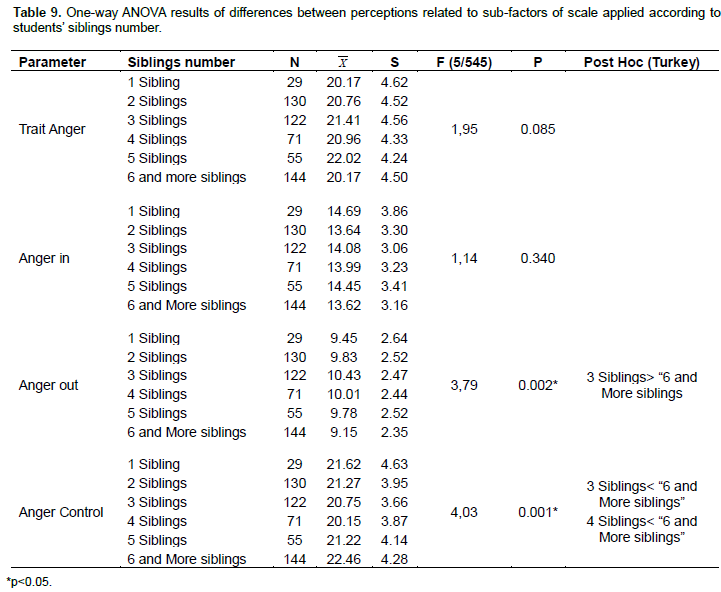
With reference to Table 9, when the students’ perceptions belonging to sub-factors of TAASS according to the number of the siblings that the students have, under “Trait Anger” sub-factor, there is no significant difference between anger levels of the students in terms of sibling number according to F(2/545)=1.95, p=0.085>0.05.
In relation to “Anger-in” sub-factor, there is no significant difference between anger suppression levels of students in terms of sibling number according to F(5/545)=1.14, p=0.340>0.05. In relation to “Anger out” sub factor, there is significant difference between the levels of not taking their anger under control but directing them out with students based on the number of siblings they have, according to F(5/545)=3.79, p=0.002<0.05. This significant difference stems from the fact that the levels of not taking under control their anger but directing it out with students who have 3 siblings (X =10.43) are higher than those of having 6 and more siblings (![]() =9.15).
=9.15).
In relation to “Anger Control” sub-factor, there is a significant difference between the levels of taking their anger under control in terms of number of siblings, according to F(5/545)=4,03, p=,001<,05. This significant difference stems from the fact that the levels of taking their anger under control with students who have 3 siblings (X =20.75) are found to be smaller than those having 4 siblings (X =20.15), and those having 6 and more siblings (X =22.46).
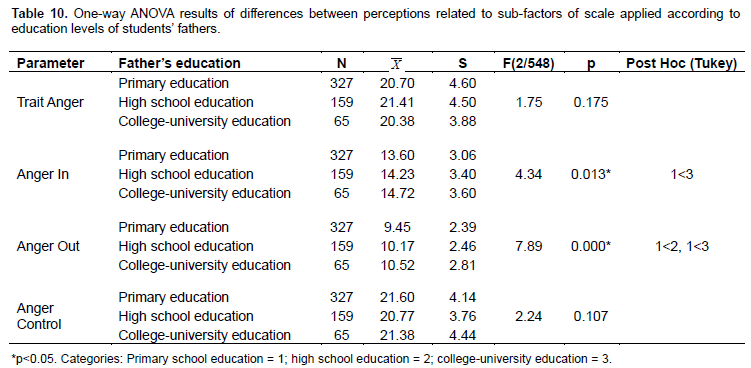
In Table 10, in the differences between perceptions belonging to TAASS sub-factors according to the
education levels of students’ fathers, under “Trait Anger” sub-factor, there is no significant difference between anger levels in terms of fathers’ education levels, according to F(2/548)=1.75, p=0.175>0.05.
In “Anger In” sub-factor, there is a significant difference between anger suppression levels of their fathers’ education levels according to F(2/548)=4.34, p=0.013<0.05. This significant difference stems from the fact that the levels of anger suppression of the students whose fathers are primary school graduates (X =13.60) are lower than those of college and university graduates (X =14.72).
In “Anger Out” sub-factor, there is a significant difference between the levels of not taking their anger under control but directing it out in terms of education levels of students’ fathers according to F(2/548)=7.89, p=0.000<0.05.
This significant difference stems from the levels of not taking their anger under control but directing it out with students whose fathers are primary school graduates (X =9,45) are lower than those of whose fathers are high school graduates(X =10.17); and those whose fathers are college and university graduates(X =10.52). In “Anger Control” sub-factor, there is no difference between the levels of being able to control their anger in terms of their fathers’ education levels, according to F(2/548)=2.24, p=0.107>0.05.
RESULTS AND DISCUSSIONS
The aim of this study, according to some variables, is to compare the TAASS model for students attending universities in different social and cultural regions. TAASS was applied to university students in South-eastern Anatolian and Aegean Regions, where Batman and Pamukale Universities are located, respectively.
According to the results of the study, when the differences between perceptions belonging to sub-factors of TAASS are examined according to their gender and age variations, there is no significant difference in “ Trait Anger, Anger In, Anger Out, Anger Control” sub factors. The results of this study and those of other researchers in the literature are parallel to each-other. Rice et al. (2008) searched whether there were any differentiations in terms of race and gender between school connectedness and anger expression styles. At the end of the study, they could not find any differences in terms of gender of trait anger scores. In their study carried out in 2007, Kesen et al. observed that there was an increase in trait anger and anger out in adolescents’ ages. In the present study, it can be seen that anger is insignificant in respect to age between both groups. The reason could be as an individual gets older, s/he increases the awareness to responsibility and also, that the roles families give males and females have the same values in all parts of the society.
According to university variable, when perceptions belonging to TAASS sub-factors are compared, there is no significant difference in trait anger and anger out sub factors; conversely, there is a significant difference in anger in and anger control. According to university variable, the fact that anger in and anger control factors have significant differences is thought to stem from the social and cultural life quality of Aegean Region, which is more developed compared to South-eastern Anatolian Region, socially and culturally. In 2014, in a study carried out with Physical Education teacher candidates studying in a university, Cengiz et al. found that one of the problems found in school environment is that some students have difficulty expressing their anger. The above study displays parallelism with our study.
When perceptions about sub-factors of TAASS are compared according to education levels of university students’ father, there is no significant difference in trait anger and anger control factors; on the contrary, there is a significant difference in anger in and anger out factors. According to Boulter (2004), Gorman-Smith et al. (2004) and Tolan (2001), problems between parents and miscommunication between a child and his/her child-minder have some connections with violent behaviours witnessed with adolescents. In their study conducted with adolescents, Esre and Ustun (2011) found that adolescents expressed their anger out higher than their parents. In our study, the reasons why there is a significant difference in anger in and anger out factors of fathers’ education level are because of the education parents give to their children.
According to the number of siblings that the university students have, there is no significant difference in sub factors of trait anger and anger in; on the contrary, there is a significant difference in anger out and anger control factors. Gok (2009) showed that the adolescents oppressed and mistreated by their families could not keep their anger, so they express their anger out. In this study, students who have few siblings can develop jealousy instinct for each other since they cannot share their parents. On the other hand, with students who have more siblings, it is possible to think that they can express out their anger and control it due to the fact that their parents do not show them enough love. Caglayan (2014) pointed out that those who are most violent to sportsmen were trainers in his study, where he evaluated sportsmen exposure to violence and their anger levels. It was stated that trainers should receive education on anger and violence.
The studies carried out show that anger expression styles can be controlled in a positive way.
Generally, anger subscale level (trait anger, anger in, anger out and anger control) differences were found to be statistically significant according to various variables in both groups. The reasons for these differences between both groups may stem from social and cultural differences of the regions where both universities are located, and lack of education. It can be said that social and cultural development affects anger level positively. It is suggested that first Level 4 factor Robust ML model developed for future educators to be professionalized against anger should be used in subsequent studies.
CONFLICT OF INTERESTS
The author has not declared any conflict of interest
REFERENCES
|
Adana F, Aslantas H (2011). Ergenlikte ofke ve ofkenin yonetiminde okul hemsirelerinin rolu. Adnan Menderes Universitesi Tıp Fakultesi Dergisi.12(1):57-62. |
|
|
Boulter L (2004). Family-school connection and school violence prevention. Negro Educ. Rev. 55(1):27-40. |
|
|
Cengiz, R, Arslan F, Sahin E (2014). Beden Egitimi Ogretmenlerinin Oz-guven ve Boyun Egici Davranıslarının İncelenmesi. Turk. J. Educ. 3(3). |
|
|
Cole DA (1987). Utility of confirmatory factor analysis in test validation research. J. Consult. Clin. Psychol. 55:584-594. |
|
|
Gorman SD, Henry BD, Tolan PD (2004). Exposure to community violence and violence perpetration: The protective effects of family functioning. J. Clin. Child Adolesc. Psychol. 33(3):439-449. |
|
|
Gok M (2009). Aile ici siddet ve ofke ifade tarzları arasındaki iliskinin incelenmesi, Cukurova universitesi sosyal bilimler enstitusu egitim bilimleri anabilim dalı, Yuksek lisans tezi. |
|
|
Kaya N, Kaya H, Atar YN, Turan N, Eskimez Z, Pallos A, Aktas A (2012). Hemsirelik ve ebelik ogrencilerinin ofke ve yalnızlık ozellikleri. Hemsirelikte Egitim ve Arastırma Dergisi 9(2):18-26. |
|
|
Kesen NF, Deniz ME, Durmusoglu N (2007). Ergenlerde saldırganlık ve ofke duzeyleri arasındaki iliski, Yetistirme yurtları uzerinde bir arastırma. Selcuk Universitesi Sosyal Bilimler Enstitusu Dergisi 17:353-364. |
|
|
Kısac I (1999). Universite ogrencilerinin surekli ofke ifade bicimi duzeyleri. Gazi Universitesi Mesleki EgitimDergisi 1(1):63-74. |
|
|
Kline RB (2005). Principles and Practice of Structural Equation Modelling (2nd Edition ed.). New York: The Guilford Press. |
|
|
Kokdemir H (2004). Ofke ve ofke kontrolu. Pivolka, 3(12):7-10. |
|
|
Lulofs RS, Cahn DD (2000). Conflict from theory to action, United States of America. A person Education Company. |
|
|
Ozer K (1994). Ofke, kaygı ve depresyon egilimlerinin bilissel alt yapısıyla ilgili bir calısma. Turk Psikoloji Dergisi 31:12-25. |
|
|
Ozdamar K (2004). Paket Programlar Ä°le Ä°statistiksel Veri Analizi I, Eskisehir, Kaan Kitapevi. |
|
|
Ozmen SK (2004). Aile icinde ofke ve saldırganlıgın yansımaları. Ankara Universitesi, Egitim Bilimleri Fakultesi Dergisi, 37(2):27-39. |
|
|
Rice M, Weaver K, Howell C (2008). Relationship of anger, stress, and coping with school connectedness in fourth-grade children, Published Online: 28 Feb. |
|
|
Savasır I, Sahin NH (1997). Bilissel-Davranıscı- terapilerde degerlendirme, sık kullanılan olcekler. Ozyurt matbaacılık, Turk Psikologlar Dernegi Yayınları 9:71-78. |
|
|
Soykan C (2003). Ofke ve Ofke yonetimi. Kriz dergisi 1(2):19-27. |
|
|
Starner TM, Peters RM (2004). Anger expression and blood pressure in adolescents. J. School Nurs. 20(6):335-342. |
|
|
Sumer N (2000). Yapısal esitlik modelleri: Temel kavramlar ve ornek uygulamalar. Turk Psikoloji Yazıları 3(6):49-74. |
|
|
Sahin NH, Batıgun AD (2009). Lise ve universite ogrencilerinde intihar riskini belirlemeye yonelik bir modelin sınanması. Turk Psikiyatri Dergisi 20(1):28-36. |
|
|
Tatlılıoglu K, Karaca M (2013). Ofke olgusu hakkında sosyal psikolojik bir degerlendirme. J. Acad. Soc. Sci. Stud. 6(6): 1101-1123. |
|
|
Tezbasaran A (1997). Likert Tipi Olcek Gelistirme Kılavuzu.(İkinci baskı), Turk Psikologlar Dernegi Yayını, Ankara. |
|
|
Tolan P (2001). Youth violence and its prevention in the United States. An overview of current knowledge. Inj. Control Saf. Promot. 8(1):1-12. |
|
|
Wilde J (2006). Ofke sorunu yasayan cocuklara yonelik uygulamalar. Cev: A. Ozmen, Ankara Universitesi Egitim Bilimleri Fakultesi Dergisi 39(1):135-144. |
|
Copyright © 2024 Author(s) retain the copyright of this article.
This article is published under the terms of the Creative Commons Attribution License 4.0


