ABSTRACT
The purpose of this study was to analyze teachers’ perspectives on the usage of smart boards and Tablet PCs in the Fatih Project using some variables (gender, branches, school types, educational status etc). The measurement scale of the study was developed and applied with the high school teachers in Düzce. Quantitative research methods were used in the study and screening model was applied. The SPSS 20.0 statistical package program was used to analyze the data. Frequency values, percentages and mean values were used in data analysis; whereas, the One-Way Variance Analysis (ANOVA) and the t-test were used for unconnected sampling. The study samples were 323 teachers chosen haphazardly from amidst teachers from a variety of high schools in Düzce in the 2015-2016 academic year. In general, the teacher viewpoints on the dimensions defined in the measurement tool were observed to be “I am indefinite” or “I am indecisive”. In consequence of the analyses, it was identified that there was a remarkable difference in using Tablet PC PCs on behalf of the male participants according to the gender variable. Seeing that the branch variable, there was a significant difference in using Tablet PC PCs dimension in favor of the foreign language branches; and a significant difference was also found out in using Tablet PC PCs dimension on behalf of the skills class branches. According to school type variable, significant differences were detected in the distribution of the Tablet PC PCs in favor of the vocational high schools. No significant difference was observed according to the graduation variable. In average class population variable, on the other hand, a significant difference was determined in favor of the classes with 26 to 30 students and with 31 and over students in the smart board dimension.
Key words: Fatih project, teacher’s viewpoints, smart board, tablet PC, Turkey.
The educational institutions and the efficiency and quality of the education they provide have been severally discussed. Each country aims for more successful education and training activities for its youth for the future. For this reason, each society has to review the money spent on education in its future plans and work on
how to improve its educational systems to become more efficient and productive; and therefore, in the future, one of the significant points that will be emphasized by societies in our permanently evolving and changing world will be the qualification of the literate human labor force, because societies can only develop and change with the increasing number of the educated people who chase any kind of innovation in and who are experts in their fields (Erden and Fidan, 1988). Küçükahmet (1997) stated that the educational process of a person starts when a person is born and continues until death, and added that some parts of the education that continue throughout the lives of individuals are provided either at schools or in classroom environments in a planned and programmed manner and is called “education”. The infrastructure and physical equipment of the schools are very important. The education and training activities provided at schools must be planned and programmed, and they must cover the expectations and needs of the society with infrastructure and physical facilities matching the requirements of the modern age (BinbaşıoÄŸlu, 1994)
In order to create an efficient educational environment, it is inevitable to make use of educational tools and equipment (Kazu and YeÅŸilyurt, 2008). Today, the fast-developing technology has facilitated the lives of people, and it also has additional important functions like collecting, producing and disseminating the information in the field of education. In order for the education to be more qualified, the use of technology in classes is important. The acceptance of technology by teachers is mostly affected by the urge to adapt to external demands or expectations. This shows that teachers prefer to use technology in order to cover the external demands and expectations rather than their efficiencies in classrooms (Baek et al., 2008). Since the 1980s, technology has become the inevitable part of educational environments and has brought with it the debates on the effects of technology on education, and many teachers claimed that technology was efficient for presenting the contents of the education, while others claim that students used technology for fun rather than educational purposes and therefore it was not proper for education (Plumm, 2008). The aim of Fatih Project was to bring a different vision to the Turkish Educational System since 2010, and its general purpose was to provide classrooms with computers and technologies until late 2013, and perform computer technology-assisted education (MoNE, 2011). For this purpose, the components of Fatih Project have been collected under 5 titles, which are hardware-software, e-content, the use of communication technologies, and in-service training of teachers.
It was aimed that the hard-ware-software infrastructure of Fatih Project would be completed within 3 years’, between 2010 and 2013; and in the next 2 years, the aim was to perform the evaluation process of the project and monitor the reflections and outcomes of the project in the Turkish Educational System (Alkan at al., 2011). According to this target, it was aimed to cover the needs of the third education level in the 1st year; the needs of the second education level in the 2nd year, and the needs of the first education level in the 3rd year. In the context of these targets, the pilot applications started in 2011 in certain schools; and by the end of 2011-2012 academic year, the applications were completed in 17 cities in 52 schools 3 of which were primary schools and 50 were high schools. The applications were tested by distributing the Tablet PCs, which was not mentioned before, to students (Bilici, 2011).
There are many studies previously conducted on computers and smart (interactive) boards, which are among technological products used in education (Adıgüzel at al., 2011; Gürol at al., 2012; Dinçer, 2011; Alkan at al., 2011; Harton et al., 2002; Kalem-Fer, 2003; BaÄŸcı, 2013; Ayvacı et al., 2014; AteÅŸ, 2010; Küçüktepe and Baykın, 2014; Merkel, 1984; Yang, 2008; Stoica et al., 2011; Somyürek at al., 2009; Sünkür and Arabacı, 2012; Åžad and Özhan, 2012; SenemoÄŸlu, 2010; Yenipalabıyık, 2013). In these studies, the general foci were computer-assisted instruction, which was learnt by students and who improved themselves by using computer programs. In addition, it was claimed in these studies that the teachers should be provided with more in-service trainings.
Purpose of the study
The purpose of this study was to evaluate the teachers’ viewpoints on the delivery of Tablet PC to students and the usage of smart boards by teachers at high schools against the backdrop of Fatih Project in 2013-2014 academic year. It is also the aim of the study to determine the viewpoints of the teachers who work at secondary education institutions on the distribution of Tablet PCs to students and on using smart boards. In addition, the significance of the differences between the variables was determined according to gender, branch, school type, educational status, level and average class populations. For this purpose, the following problem definition and sub-problems were taken shape in the study.
Problem statement
Do teachers’ viewpoints on Fatih Project, which started in the 2013-2014 academic year in high schools, differ according to the selected variables?
Sub-problems
(1) What are the teachers’ perspectives on using interactive whiteboards, which started at high schools asin 2013-2014 academic year?
(2) What are the teachers’ perspectives on Tablet PC delivery to students, which started in high schools in 2013-2014 academic year?
(3) Do the teachers’ perspectives on using interactive whiteboards and Tablet PC delivery, which started at secondary education institutions in 2013-2014 academic year, differ at a actuarially significant level according to gender, branch, school type, educational attainment, level, year and class population variables?
The model, population and sampling of the study, the data collection tools used in it, the data collection process and the analyses of the data are explained subsequently.
Model of the study
This study, which has the purpose of “Evaluating the Teacher Perspectives on the Delivery of Tablet PC PCs and using interactive whiteboards used at secondary education institutions as of 2013-2014 academic year, was conducted with the questionnaire model (Yıldırım and ÅžimÅŸek, 2013). The Survey Model is based on describing a situation as it is (Karasar, 1994: 77). It is also preferred in social science studies, which are field studies in nature (Borg and Gall, 1971). For this reason, the data were collected by receiving the perspectives of the teachers on the delivery of Tablet PC PCs and using smart boards. For this reason, questionnaire is an important data collection tool to get statistical data. Thence, the quantitative research model was done for in the study, and a convenient scale for the study was prepared and applied to high school teachers. The relevant literature and field review was made for the scale. While the scale was being prepared, both the viewpoints of the high school teachers and the experts were received and made use of. Beforehand the scale was implemented, it was applied to a sample group, and the reliability findings were determined. The reliability findings are explained in detail in the data collection tool section.
Population and sampling of the study
The study population consisted of the teachers who worked at secondary school institutions in Turkey, and the sampling consisted of 323 high school teachers who worked in the city of Düzce and who were selected randomly from among the study population. The demographic properties of the study group are given in Tables 1, 2, 3, 4, 5, and 6. The teachers incorporated in the study on a voluntary basis. It paved the way for the teachers to fill in the scale of the study and do probable rectification anytime and anywhere they wanted. Since the teachers participated voluntarily in the study, it is expected that the results of the study are more reliable (Kerski, 2000). It might be claimed that the questionnaires that are implemented in an official manner are less reliable than the ones that are filled voluntarily because the teachers who want to improve themselves are be bound up with infilling them.
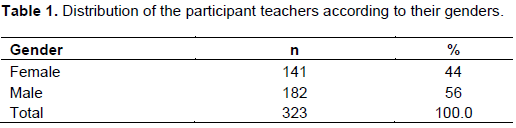
The gender distribution of the teachers who participated in the study is given in Table 1. Within this framework, we can see that 44% of the teachers who participated in the study (n=141) were female and 56% (n=182) were male. The number of the male teachers who participated in the study is more than the female ones. Nevertheless, the distribution of the gender is poised.
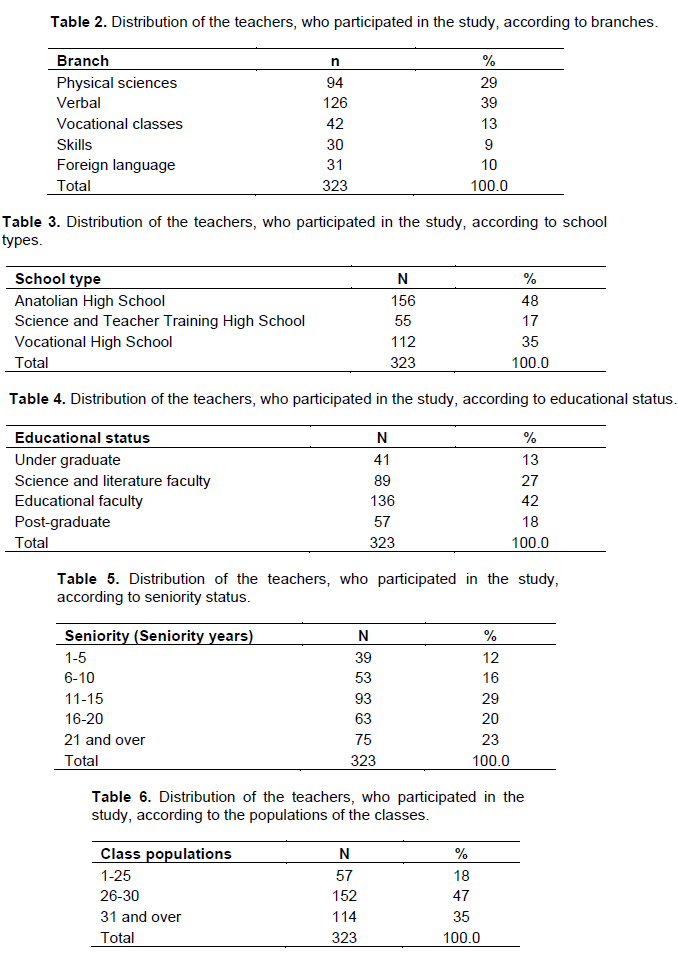
The distribution of the participant teachers with reference to their branches is taped in Table 2. Twenty-nine percent of the teachers, who participated in the study (n=94) were from physical sciences field; 39% (n=126) were from verbal field, 13% (n=42) were from vocational training-education field; 9% (n=30) were from skills field; and 10% (n=31) were from foreign languages field. The number of the teachers who worked in the verbal field was the highest. This circumstance is appertaining to the general distribution.
The distribution of the participant teachers with reference to their school types is shown in Table 3. Forty-eight percent of the teachers, who participated in the study (n=156) were laboring at Anatolian high schools, 17% of the teachers, who participated in the study (n=55) were laboring at science and teacher training high schools, 35% of the teachers, who participated in the study (n=112) were laboring at vocational high schools. The number of the teachers who were laboring at Anatolian High Schools was more.
This situation has come to light with the reconfiguration of the secondary education institutions in Turkey in the recent times. Since plain high schools were made the cut as Anatolian High Schools, this group shows a more level of participation.
The distribution of the participant teachers with reference to their educational status is shown in Table 4. Thirteen percent of the teachers, who participated in the study (n=41) were graduated from undergraduate degrees, 27% of the teachers, who participated in the study (n=89) were from science-literature faculties, 42% of the teachers, who participated in the study (n=136) graduated from educational faculties, and 18% of the teachers, who participated in the study (n=57) had post-graduate degrees. The number of the teachers who graduated from educational faculties was more.
The distribution of the participant teachers with regard to their seniority at service is shown in Table 5. Twelve percent of the teachers, who participated in the study (n=39), had 1 to 5 years’ experience, 16% of the teachers, who participated in the study (n=53), had 6 to 10 years’ experience, 29% of the teachers, who participated in the study (n=93), had 11 to 15 years’ seniority, 20% of the teachers, who participated in the study (n=63), had 16 to 20 years’ seniority, and 23% of the teachers, who participated in the study (n=75) had 21 years and above seniority. It might be alleged that the majority of the teachers are experienced in their professions.
The distribution of the participant teachers with reference to the average class populations is shown in Table 6. Eighteen percent of the teachers, who participated in the study (n=57) labored in classes with 1 to 25 students, 47% of the teachers, who participated in the study (n=152) labored in classes with 26 to 30 students; 35% of the teachers, who participated in the study (n=104) labored in classes with 31 and over students. When the populations of the classes in the schools where the study was carried out were analyzed it was observed that the classes where there were 26 to 30 students which constituted the preponderance. This situation also represents the overall status of the distribution in classes in the country.
Data collection tool
In order to designate the teacher perspectives on Fatih Project which became active as of 2013-2014 academic year in secondary education institutions, a 5-Point Likert scale was enhanced by the author of the study. The scale composed of 17 items and 2 factors. Therewithal, aside from these 2 factors, there are questions on the personal information of the teachers who participated in the study in the first section of the scale. This section is composed of 6 items on demographic variables. This section was formed as personal information, and includes some variables like the gender, branch, school type, educational status (graduation), seniority years and average population of the classes of the teachers. In the 2 dimensions of the scale, the smart board application magnitude consisted of 9 items, and the Tablet PC distribution magnitude consisted of 5 items.
The scale was presented for the expert opinions and evaluations. Necessary corrections were made on the scale taking into account the viewpoints and critics of the experts, and it was made proper for the pre-application. Then, this scale was applied to 113 secondary education teachers for reliability analyses. This application was performed as “tete a tete” interviews with the teachers. The items on the content dimension that had low values in the pilot application were removed from the scale. The scale was applied after the reliability studies of the items. If the KMO value in such scales is over 0.60, the scale is seen as being proper for Factor Analysis (Büyüköztürk, 2013). The KMO value of the scale was found as 0.905. This is a value that is convenient for analysis. Into the bargain, the item load values of the scale are viewed in Table 7.
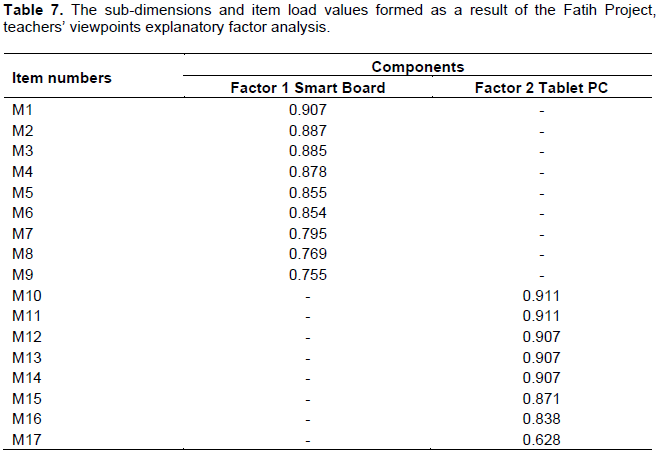
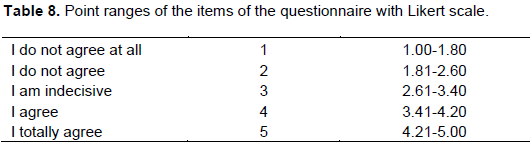
The rate of explaining the total variance by the 5-factor structure is 71.4%. Çokluk et al. (2010) reported that 40 to 60% was the ideal rate in multifactorial structures. The factor load values of 5 factors were not observed to be close to each other and their contributions to the total variance was more than the other factors. After the Vertical Spinning (Varimax), the items of the 5-factor structure that overlapped with each other and that had item load values below 0.32 were removed from the scale, and it was given the latest form for application. The numbers given earlier was about the dimensions obtained after the items with low values were removed. After the reliability analysis, the Cronbach Alpha Coefficient of the scale, which consisted of 17 items, was found to be 0.90. As a result, the scale is reliable. In addition, the range of the points is shown in Table 8 in agreement with the Likert Scale.
Analysis of data
The statistical analyses were produced by using the SPSS 20.0 program in the study. In the analyses of the problem statement and sub-problems, the descriptive statistics method was utilized; the t-test and One-Way Variable Analysis (ANOVA) tests were utilized for irrelevant sampling. The Tukey Test was used for intergroup comparisons. The level of significance was taken as 0.05.
The frequency values, percentages, arithmetic averages and similar statistical values were used to find out which answers of the teachers given to the questions in the questionnaire were more intense (by using the 5-Point Likert Scale). The Unrelated Sampling t-test was performed in order to determine whether there were significant differences between the teacher viewpoints in terms of two-group variables (like gender). The (ANOVA was used in order to determine whether there were significant differences between the teacher viewpoints in three or more group variables (“the branch, school type, graduation, seniority year, class population”). In case differences were determined, the Tukey Multiple Comparison Test was made in order to determine between which groups the differences were. The significance level was taken as 0.05. The options and their points given in the scale across the sentences are as the following.
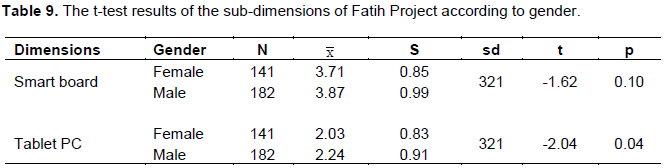
The t-test results of the scale are shown in Table 9. When Table 9 is examined it is observed that the teacher viewpoints on smart board do not differ at a significant level according to gender variable [t (321) = -1.62; p > 0.05]. In other words, gender does not seem a determinant variable for this dimension. However, a significant difference is observed between the viewpoints of the teachers on distributing Tablet PCs dimension according to gender variable in favor of the male teachers [t (321)= -2.04; p<0.05]. It may be considered that male teachers adapted themselves more easily to Tablet PC use. In addition, when Table 9 is examined it is observed that the average of the teacher viewpoints on smart board application was determined as “I agree”; and the teacher viewpoints on Tablet PC distribution were determined as “I do not agree”. In general, the teachers do not find Tablet PC distribution as a positive development.
The ANOVA results of the Fatih Project scale sub-dimensions according to branches are shown in Table 10. In this context, a significant difference is observed between the teacher viewpoints on smart board application dimension according to branches [F(4-318)=3.57; p<0.05]. This difference was found to be significant in favor of verbal branch and skills branches; and against foreign language branches. It is possible to claim that the use of smart boards bring facilities in terms of documentaries, films, maps and presentations. According to the table, the teacher viewpoints on physical sciences, verbal, vocational classes and in skills fields as “I agree”. The teacher viewpoints on foreign language branch were determined as “I am indecisive” on smart board application dimension. When the activities like “Listening” are considered in foreign language field, it is expected that the teacher viewpoints would be more positive.
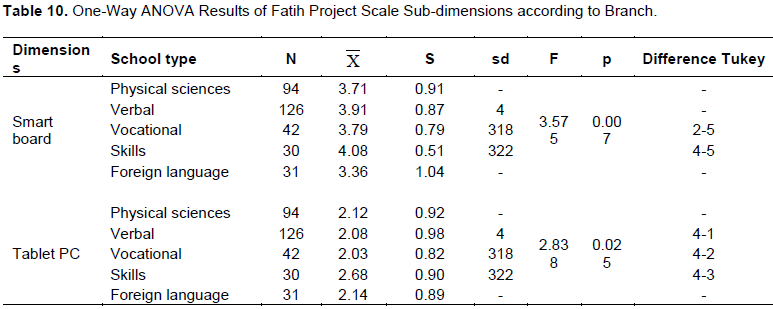
According to Table 10, a significant difference is observed between the teacher viewpoints on Tablet PC distribution dimension according to branches [F(4-318)=2.83; p<0.05]. This difference was found in favor of skills branch, and against physical sciences, verbal and vocational classes. Especially the teachers of Skills classes (like music, art, physical education) considered the innovations like smart board and Tablet PC in a more positive manner. According to the table, the teacher viewpoints on Tablet PC distribution dimension are as “I do not agree”. In general, the teachers have the viewpoint claiming that the Tablet PC distribution influenced the motivation of the students to classes in a negative manner.
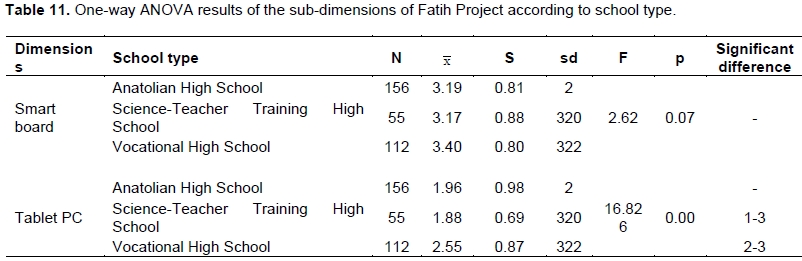
According to Table 11, it is observed that the teacher viewpoints do not differ on smart board according to the school types of the teachers at a significant level [F(2-320)=2.62; p >0.05]. In addition, the teacher viewpoints on smart board use were determined as “I agree”. In general, the teachers consider the smart board use as a beneficial development.
According to Table 11, there is a significant difference between the teacher viewpoints on Tablet PC distribution dimension according to the school type variable [F(2-320)=16.8; p<0.05]. This difference between the teachers working at vocational and Anatolian High School was found to be in favor of the teachers who worked at vocational high schools; and in favor of the teachers who worked at vocational high schools between the teachers who worked at Science and Teacher Training High School and vocational high schools. According to the table, the viewpoints of the teachers on Tablet PC distribution dimension were as “I do not agree”.
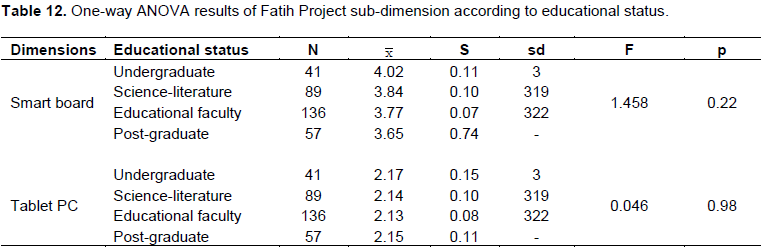
According to Table 12, the teacher viewpoints on using smart boards do not differ at a significant level according to the educational status of the teachers (graduation) [F(3-319)=1.45; p > 0.05]. In addition, the teacher viewpoints on using smart boards were determined as “I agree”.
According to Table 12, the teacher viewpoints on using Tablet PCs do not differ at significant level according to the educational status of the teachers [F(3-319)= 0.46; p > 0.05]. In addition, the teacher viewpoints on using Tablet PCs were determined as “I do not agree”.
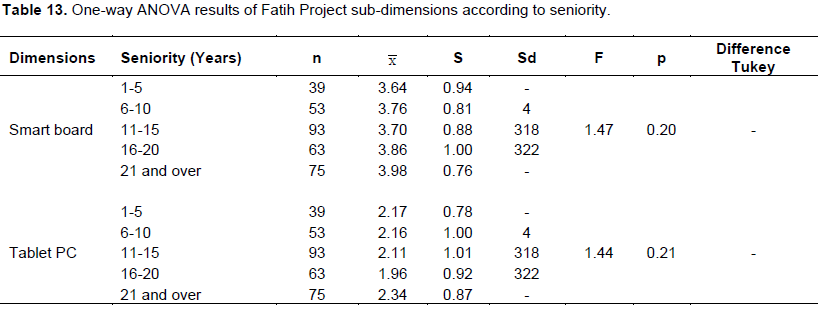
According to Table 13, it is observed that the teacher viewpoints on using smart boards do not differ at a significant level according to the Seniority Years [F(4-318) =1.47; p > 0.05]. In addition, the teacher viewpoints on using smart boards were determined as “I agree”.
According to Table 13, it is beheld that the teacher perspectives on using Tablet PCs do not differ at a significant level according to the Seniority Years of the teachers [F(4-318) =1.44; p > 0.05]. Moreover, the teacher perspectives on using Tablet PCs were identified as “I do not agree”.
According to Table 14, there is a significant difference between the teacher viewpoints on using smart boards according to average Class Population variable [F(2-320)=6.80; p<0.05]. This difference was detected between the teachers who had 1 to 25 students in their classes and those who had 26 to 30 students in their classes in favor of the teachers who had 26 to 30 students. The difference that was detected between the teachers who had 26 to 30 students in their classes and the ones who had 31 and over students was in favor of those who had 31 and over students. A significant difference was also detected between the teachers who had 1 to 25 students and those who had 31 and over students in favor of those who had 31 and over students in their classes. As the Class Population increased, the smart boards were found to be more useful. According to the table, the teacher viewpoints on using smart boards were determined as “I agree”.
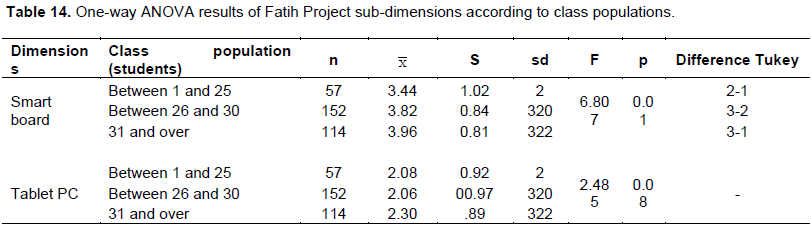
According to Table 14, it was detected that the teacher viewpoints on using Tablet PCs in classes did not differ at a significant level according to average class population [F(2-320) =2.48; p >0.05]. In addition, the teacher viewpoints on using Tablet PC were determined as “I do not agree.”
It is observed that the teacher viewpoints do not differ at a significant level on using smart boards according to gender variable. Gender is not a determinant variable for this dimension. A significant difference was observed between the teacher viewpoints on Tablet PC distribution dimension in favor of the male teachers. It may be claimed that male teachers adapt more easily to Tablet PC use.
A significant difference was detected between the teacher viewpoints on smart board application according to branches variable in favor of the verbal branches and skills classes and against the foreign language branch. A significant difference was observed between the teacher viewpoints on Tablet PC distribution according to branches in favor of skills classes, and against the physical sciences, verbal and vocational classes. The teachers of skills classes (music, art, physical education, etc.) approached technological innovation in a more positive manner.
The teacher viewpoints on using smart boards according to school types did not differ at a significant level. A significant difference was detected between the teacher viewpoints on Tablet PC distribution according to the school types in favor of the teachers who worked at vocational high schools, and against the teachers who worked at Anatolian, Science and Teacher Training High Schools.
It was determined that the teacher viewpoints on using Smart board and Tablet PCs did not differ at a significant level according to the educational status of the teachers.
It was observed that the teacher viewpoints did not differ at a significant level on using Smart board and Tablet PC according to Seniority Years variable.
A significant difference was detected between the viewpoints of the teachers who had 1 to 25 students in their classes and those who had 26 to 30 students in their classes on using smart boards according to average Class Population variable in favor of those who had 1 to 25 students in their classes. Significant differences were detected between the teachers who had 26 to 30 students in their classes and who had 31 and over students in their classes in favor of those who had 31 and over students in their classes; and between those who had 1 to 25 students in their classes and those who had 31 and over students in their classes in favor of those who had 31 and over students in their classes. As the class population increases, the smart boards are considered as a more beneficial innovation. It was observed that the teacher viewpoints on Tablet PC distribution did not differ at a significant level according to average class population variable.
In general, the teacher viewpoints were determined as “I agree” in the smart board dimension, and “I do not agree” in the Tablet PC dimension. Generally, the teachers did not consider Tablet PC distribution as a positive development. The idea that Tablet PC distribution influence students’’ motivation to classes in a negative manner. In general terms, the teachers consider the use of smart boards as a beneficial development. In addition, a comment may be made claiming that “The teachers have not received adequate in-service training on associating the Tablet PCs and smart boards with the contents of the classes”.
The enforcement like using interactive whiteboards and distributing tablet PCs at high schools must be tactful by receiving the line of vision of the high school teachers, students and parents without populist policies. It is recommended that the learning and teaching processes are organized by receiving the viewpoints of the pedagogues, teachers and instructresses.
The results of the study showed that the viewpoints of the teachers differ on using smart boards and distributing tablet PCs at different school types. This situation shows that the education given at different high school types are not the same. It is recommended that these innovative applications are distributed to students who are at different age groups by considering their school types instead of standard applications.
The authors have not declared any conflicts of interest.
REFERENCES
|
Adıgüzel T, Gürbulak N, Sarıçayır S (2011). Akıllı tahtalar ve öÄŸretim uygulamaları Mustafa Kemal Üniversitesi Sosyal Bilimler Enstitüsü Dergisi, 8(15):457-471.
|
|
|
|
Alkan T, Bilici A, Akdur TT, Temizhan O, Çiçek H (2011). Fırsatları artırma teknolojiyi iyileÅŸtirme hareketi (Fatih) Projesi, 5. Uluslararası Bilgisayar ve ÖÄŸretim Teknolojileri EÄŸitimi Sempozyumu, Elazığ: Fırat Üniversitesi.
|
|
|
|
AteÅŸ M (2010). OrtaöÄŸretim CoÄŸrafya Derslerinde Akıllı Tahta Kullanımı.Marmara CoÄŸrafya Dergisi, (22):409-427.
|
|
|
|
Ayvacı HŞ, Bakırcı H, Başak MH (2014). The Evaluation Of Problems Emerging During The Implementation Process Of Faith Project By Administrators, Teachers And Students. (YYU J. Educ. Faculty), 9(I):21-47
View
|
|
|
|
Bağcı H (2013). In Favour of Faith Project: Review of Students Opinions Related To The Smart Boards Okan Uni. Social Sciences Institute, Unpublished master thesis, İstanbul.
|
|
|
|
Baek Y, Jung J, Kim B (2008). What makes teachers use technology in the classroom? Exploring the factor saffecting facilitation of technology with a Korean sample. Comput. Educ. 50:224-234.
Crossref
|
|
|
|
Bilici A (2011). ÖÄŸretmenlerin biliÅŸim teknolojileri cihazlarının eÄŸitsel baÄŸlamda kullanımına ve eÄŸitimde Fatih Projesi'ne yönelik görüÅŸleri: Sincan Ä°l Genel Meclisi Ä°.Ö.O. örneÄŸi", 5. Uluslararası Bilgisayar ve ÖÄŸretim Teknolojileri EÄŸitimi Sempozyumu, Elazığ: Fırat Üniversitesi.
|
|
|
|
BinbaşıoÄŸlu C (1994) Genel ÖÄŸretim Bilgisi. Ankara: KadıoÄŸlu Matbaası
|
|
|
|
Borg WR, Gall MD (1971). Educational, Research" New York: David McKay Com.
|
|
|
|
Büyüköztürk Åž (2013). Statistics, Research Design SPSS Applications and Comment. Pegem Academy Ankara.
|
|
|
|
Çokluk Ö, ÅžekercioÄŸlu G, Büyüköztürk Åž (2010). Sosyal bilimler için çok deÄŸiÅŸkenli istatistik: SPSS ve LISREL Uygulamaları. Ankara: Pegem Akademi.
|
|
|
|
Dinçer S (2011). "ÖÄŸretmen yetiÅŸtiren kurumlardaki öÄŸrencilerinin öÄŸrenim hayatları boyunca bilgisayar öÄŸrenme düzeylerinin ve bilgisayar okuryazarlıklarının incelenmesi" Akademik BiliÅŸim, Malatya: Ä°nönü Üniversitesi
|
|
|
|
Erden M, Fidan N (1988) Eğitim Bilimlerine Giriş Başkent Yayınevi Ankara Fatih Projesi. "Proje Hakkında" 06 01, 2012 tarihinde MEB Fatih Projesi Web sitesi: http://fatihprojesi.meb.gov.tr/tr/icerikincele.php? id=6 adresinden alındı (2011).
|
|
|
|
Gürol M, DonmuÅŸ V, Arslan M (2012). Ä°lköÄŸretim Kademesinde Görev Yapan Sınıf ÖÄŸretmenlerinin Fatih Projesi Ä°le Ä°lgili GörüÅŸleri. EÄŸitim Teknolojileri AraÅŸtırmaları Dergisi 3(3).
|
|
|
|
Harton HC, Richardson DS, Barreras RE, Rocloff MJ, Latane B (2002). Focused Interactive Learning: ATool for Active Class Discussion. Teaching of Psychology, 29(1):10-15.
Crossref
|
|
|
|
Kalem-Fer S (2003). Aktif ÖÄŸrenme Modeliyle OluÅŸturulan ÖÄŸrenme Ortamının ÖÄŸrenme, ÖÄŸretme ve Ä°letiÅŸim Sürecine Etkisi" Educational Sciences: Theory and Practice. 3(2):433-461.
|
|
|
|
Karasar N (1994). Bilimsel AraÅŸtırma Yöntemi. 6. Baskı, Ankara: 3A AraÅŸtırma EÄŸitim Danışmanlık Ltd.
|
|
|
|
Kazu H, YeÅŸilyurt E (2008). ÖÄŸretmenlerin ÖÄŸretim Araç-Gereçlerini Kullanım Amaçları. Fırat Üniversitesi Sosyal Bilimler Dergisi, Cilt 18/2:175-188.
|
|
|
|
Kerskı JJ (2000). The implementation and effectiveness of Geographic Information Systems Technology and Methods in Secondary Education, Colorado: University of Colorado, Department of Geography.
|
|
|
|
Küçükahmet Leyla (1997). EÄŸitim Programları ÖÄŸretimi. Ankara: Gazi Kitabevi.
|
|
|
|
Küçüktepe S, Baykın EY (2014). An Investigation of Teachers' Views on the Application of Faith Project in English Classes. J. Res. Educ. Teach. 4:23 ISSN 2146-9199.
|
|
|
|
Merkel AI (1984). A study of the effectiveness of using computer assisted i nstruction in the teaching of English as a second language.Unpublished doctoral dissertation (UMI Number: 8425076). Indiana University, Indiana.
|
|
|
|
Plumm KM (2008). Technology in theclassroom: Burning the bridges to the gaps in gender-biased education?.Comput. Educ. 50:1052-1068.
Crossref
|
|
|
|
SenemoÄŸlu N (2010). GeliÅŸim, öÄŸrenme ve öÄŸretim (16. baskı). Ankara: Pegem Yayınları.
|
|
|
|
Somyürek S, Atasoy B, Özdemir S (2009). Board's IQ: What makes a board smart? Comput. Educ. 53:368-374.
Crossref
|
|
|
|
Stoica D, Pragina F, Paragina S, Miron C, Jipa A (2011). The interactive whiteboard and the instructional design in teaching physics. Procedia Soc. Behav. Sci. 15:3316-3321.
Crossref
|
|
|
|
Sünkür M, Arabacı Ä°B, Åžanlı Ö (2012). "Akıllı tahta uygulamaları konusunda ilköÄŸretim II. kademe öÄŸrencilerinin görüÅŸleri (Malatya ili örneÄŸi)" E-Journal New World Sci. Acad. 7(1):313-321.
|
|
|
|
Åžad SN, Özhan U (2012). Honey moon with IWBs: A qualitative insight in primary students' views on instruction with interactive whiteboard. Comput. Educ. 59:1184-1191.
Crossref
|
|
|
|
Yang JY (2008). Integratingthe task-based approac hand the grammar translation method with computerassisted instruction on Taiwanese EFL college students' speaking performance. Unpublished doctoral dissertation. (UMI Number: 3305360). Alliant International University, California.
|
|
|
|
Yenipalabıyık P (2013). In-servıce EFL teachers' self-efficacy beliefs for technology integration: Insights from Fatih Project. Unpublished master thesis. Abant İzzet Baysal University, Bolu.
|
|
|
|
Yıldırım A, ÅžimÅŸek H (2013). Sosyal bilimlerde nitel araÅŸtırma yöntemleri (GeniÅŸletilmiÅŸ 9. baskı). Ankara: Seçkin Yayınları.
|