Full Length Research Paper

ABSTRACT
The purpose of this research is to develop a Synergistic Climate Scale (SCS) that can be used in organizations. Firstly prepared with 20 items, the scale was examined by five experts for its content validity, readability and intelligibility. As a result, two items were added to the scale, after experts’ views. In the development of Turkish draft form of the scale in line with expert opinions, the form was employed to a sample of 242 master degree students that major in Education Management and Inspection Program co-maintained by Zirve University and KahramanmaraÅŸ Sütçü Ä°mam University and 20 master degree students that attend the same program in Harran University; Education Management and Inspection. In total, 262 students filled the draft form. In the development of Slovakian draft form of the scale, it was employed to a sample of 154 participants; that is, 103 teachers and 16 principals getting in-service training in Slovakia Pedagocika Institute located in Vinne District and also 35 academicians working in Ruzomberok Catholic University. The structure validity was tested through exploratory factor analysis and confirmatory factor analysis. Cronbach’s Alpha internal consistency coefficient was calculated to determine the reliability. As a result of the analysis, it was seen that Turkish form has two factors and 16 items while Slovakian form has 3 factors and 15 items. It is accepted the perceptions of persons toward synergistic climate of the organization will increase as the points got from the scale increase. The reverse is accepted to happen if the points got from the scale decrease.
Key words: organizations, organization climate, synergy, Synergistic Climate Scale.
INTRODUCTION
In studies done about organization in recent years, a special emphasis has been put on synergistic manage-ment and synergy among members of an organization (Amabile, 1997; Chou, 2007; Bititci et al., 2007; Rejeb, Morel-Guimaraes et al., 2008; Carlborg et al., 2013; Chen and Chen, 2013). The desire for change felt more with each passing day in the society keeps affecting the organizations and their activities in deep way. This desire requires organizations to have changes in their structure, perspectives about their environment and new insights in the way of doing business. No matter how organizations are established, all organizations are in need of power for survival and development. Synergy is an important part of survival and development. In this sense, synergy among employees can be said to become a necessity for an organization to be successful. These facts inevitably require today's organizations to employ more strategic applications and policies. It is necessary to have a suitable climate in the organization to develop these applications and policies for the organization. In this regard, the synergistic climate of organization bears paramount importance.
Synergy
It is a known fact people work better as group than they are alone. The best example is seen in birds that fly in V formation. However, there comes the question whether just forming a group is enough for all it takes? The answer lies in “synergy”.
Synergy comes from the Greek word synergia which means “working together” (Wikipedia). This term has been used in different senses through the centuries. In contemporary literature, synergy can be noted as the degree to which a partnership combines the assets of all the partners such as relationships, values, strengths, perspectives and resources for better solutions that lead better group performance and harmony (Jones and Barry, 2011). In this sense, synergy leads to desired outcomes though combination of group powers in harmony. Similarly, Dahl (2000) found out that synergy leads to the high levels of energy, cooperation, trust, and enthusiasm. So, synergy should be given attention in group development processes; Forming, Storming, Norming, Performing and Adjourning for more rewarding desired results.
Synergy is an advantage that partnerships or any other collaborative groups gain by involving different people in work and considering partnerships in terms of synergy can help the leaders of the organization appreciate and optimize the roles of all organization stakeholders (Lasker and Weiss, 2003). Synergy bears a holistic approach and thus asserts the idea “a whole is greater than the sum of the parts”. Synergy produces unity and is essential for an environment that seeks to foster good climate in organization. According to Parmelee (2006) synergistic relationship implies that each actor is changed, supported and empowered by the other side.
Organizations may encounter difficulties in solving problems and their best person may not be sufficient in solving the case. So it is needed to have groups with synergy to address the problems. The groups may work in collaboration and act together, but they need to support each other by leveraging, combining and taking advantage of their supplementary strengths and capabi-lities for having synergy. According to Lasker et al. (2001), the synergy that actors in an organization seek to attain through collaboration is more than a mere exchange of resources and the synergy created by collaboration can be very powerful. It is something about forming a result, very different from its parts.
With some studies in previous years, synergy is not confined to only person to person, group behaviors or relationships; it is also researched in some following cognitive studies. Synergy that is based on partnership and collaboration also play important roles in rationality of decision process of the groups (Cur?eu et al., 2013). In line with this, Cur?eu and Schruijer (2012) claim that group norms fostering collaboration and participation forms a group synergy that finally “leads to the emergence of complex collective cognitive structures, better decision quality, and higher group rationality“. So formation of synergy could contribute into better decision quality among the actors or stakeholders and rationality in groups.
Synergistic management
Actions, works and mental activities that people can do alone are limited. However, when they come together as an effective group, there occurs even greater energy than they can image and everything is put into order in a short time with near-perfect results (Gürlek, 2010: 1). The concept of synergistic management founded on the function of the interaction and communication between the participants refers to an integrative and participative approach to management. Also, the concept of synergistic management can be defined as “the process of combination of all sources in organization such as human, information, systems, hardware under an effective leadership and thus forming a higher energy “(Cook, 1999: 101, as citied in Özdevecio?lu and ?nce, 2012: 31).
According to Aktan (1999), synergistic management refers to formation of teamwork dissemination, ensuring employees’ participation in decision-making and manage-ment process, using all sources such as people in the organization, information, system, hardware etc. to have multi-functional working groups, which contribute to higher energy in the organization. Synergistic manage-ment model could be said to be an effective leadership for forming a culture for the organization and individuals in the formation of energy for group goals.
Forming a 'total quality culture' and 'sharing culture' in the organization is the basis for synergistic management. In order to place synergistic management process in the organization, a shared vision, knowledge, work, authority and responsibility etc. must be available (Aktan, 2005: 204). To institutionalize synergistic management in the organization, there are main characteristics to be owned by higher board and organization leaders (Tecim, 2005: 40): 1. Written communication 2. Oral communication 3. Problem solving, 4. Benefiting from the abilities of people, 5. Gender, race and ethnic-cultural structure in the organization, 6. Vision, 7. Creative thinking, 8. Flexibility, 9. Power of decision-making, 10. Leadership, 11. Disputes, 12. Delf-directedness, 13. Interviews and cooperation, 14. Planning and evaluation, 15. Financial management, 16. Human resource management, 17. Providing services to clients, 18. Being aware of external environment, 19. Group study, 20. Technology management, 21. Internal control / integrity, 22. Technical competence
Organization climate
Gök (2009: 590) defines organizational climate as an atmosphere demonstrating the intrinsic properties of the organization and formed by shared perceptions, emplo-yees' attitudes and behaviors. Forehand and Gilmer (1964: 362; as citied by Gök, 2009: 590) defines organizational climate as group of properties describing the organization and distinguishing it from other organi-zations and influencing the behavior of people in the organization.
The literature on organizational climate has multi-dimensional structure and these dimensions were examined by different researchers from different aspects (Fleishman, 1953; Argyris, 1958; Forehand and Haller, 1964; Pritchard and Karasick, 1973; Dachler, 1974; James and Jones, 1974; Lyon and Ivancevich, 1974; Vidaver-Cohen, 1998; Burton et al., 2004; Patterson et al., 2004; Bock et al., 2005). These studies examined organizational climate in terms of leadership, human relations, supervision, environment, managerial job performance, job satisfaction, motivation, morale, climate, firm performance, the impact of strategic conformity, efficiency etc. In this study, a synergistic climate scale that will reveal organization synergistic climate features is focused on.
Synergistic climate
Synergistic management is a model that highlights interaction, communication, sharing, teamwork, cooperation among individuals, co-ordination, delegation of power, total participation (Gürlek, 2010: 4). Synergistic organizational climate can be described as an atmosphere of cooperation or solidarity among employ-ees in group dynamics and organizational adaptation based on harmony, goal congruence and vision. In short, organization having synergistic climate needs to have an organizational culture in the dimensions of goal congruence, vision, group dynamics and solidarity.
Synergistic organizational climate; organization of employees in group dynamics and organizational adapta-tion based on solidarity, goal congruence and vision can be described as the atmosphere of the working environment they have. In a nutshell, organizations with synergistic climate; goal congruence, harmony, group dynamics, vision, solidarity size of a corporate culture must be available.
Goal congruence dimension
The purpose is consciously choosing a clear instruction using skills and abilities of team, contributing to the organization and directing team members. Businesses like individuals must have a good reason for existence. The most important condition for a high-performing team is sharing the same goal by the team members. In this sense, synergy can be defined as staying focused on the target with a high motivation around a shared purpose (Balay and Müjdeci, 2013). While Gürlek (2010: 19) highlights managers, employees, team collaboration, common purpose, power delegation to employees, the value given to people, seeing the whole, vision and planning as factors that comprise synergistic management; Aktan (1999: 27) specifies that unity of action and purpose is necessary for synergy in the organization.
Harmony dimension
Employees need to be adapted to the working envi-ronment in order that efficient use of human resources can be provided. Employee and organization harmony describes the relationship between individual identity and organizational climate, individual and organizational goals, individual needs, organizational systems and structures (Kristof, 1996). Studies argue that increase in employees’ organizational harmony enables more positive outputs related to work (French et al., 1982; Lovelace and Rosen, 1996).
In his definition of synergistic management regarding harmony among employees, Gürlek (2010:4) specifies that synergistic management is a model that includes unity of power between individuals, cooperation, total participation, delegation of power, team work, sharing, coordination, harmony among employees, acting toge-ther, communication and interaction, which are to be placed into center of management.
Group dynamics dimension
Group dynamics is the examination of power styles enforced on groups and individuals by the persons (Reeves, 1970, p. 12). According to Coleman, the reason for our shared effort is to reach goals for groups which people join due to satisfaction and sometimes disappoint-ment (Hicks, 1979, p.211). According to Willard (1994), "teamwork culture" must be formed within the organization in order to form a synergistic situation. This teamwork will be a critical step in terms of forming a culture of continuous learning environment.
According to Gürlek (2010: 12), synergy is ‘revealing the power’, which is hard for persons to do alone, by coming together and using group dynamics. Synergy is the energy that moves the group (Aktan, 2005: 173). According to Aktan (1999), synergistic management is formation of multi-functional working groups in the organization. According to Tecim (2005: 40), one of the main characteristics for top management to institutionalize synergistic management in the organization is group work.
Vision dimension
Vision is a specific thought of a person which has not been achieved in the past and has not been considered till now and which is explicitly expressed about what to be done. It expresses personal perspective of a person, his depth, dream and untested ideas. Basic of synergistic management is the availability of organizational culture regarding vision sharing, information sharing, work-sharing and gain-sharing and sharing of authority and responsibility (Aktan, 2005: 204). According to Tecim (2005: 40), another main characteristic for top manage-ment to institutionalize synergistic management in the organization is vision.
Solidarity dimension
The most common purpose of teamwork is to build group based on support and trust to complete works as desired and value their differences, attitudes and skills while doing so.
According to Dereli and Baykaso?lu (2010: 5), synergy is defined as positive energy revealed under different abilities and as resulting added value. When three 1 is added, it makes 1+1+1=3; however, when these three numbers get side by side, you get 111. The same can be said about all other numbers. So when members in organization get in the same line with the same vision and goal, the power of synergy can be attained. In turn, as Figure 1 presents, Synergistic Climate is bigger than its dimensions of Goal Congruence, Harmony, Group Dynamics, Vision, and Solidarity.
Various activities and works can contribute to support and solidarity among members. Solidarity based relation-ship is for the benefit of the parties and members and it is based on clear, common goals and shared interests.
This study bears paramount importance as there has been found no other research in literature regarding development and use of synergistic climate scale for organizations. In addition, this scale is important in that;
1- It assesses synergistic climate in organization thoroughly via dimensions of Goal Congruence, Harmony, Group Dynamics, Vision, and Solidarity.
2- It is a scale that can be employed for all sorts of organizations.
Purpose
The purpose of this paper is to develop a Likert type Synergistic Climate Scale (SCS) to be used in organizations.
METHODS
This study was done in accordance with descriptive scanning model. The information about sample of the study, development of data collection tool and techniques used in data analysis is given below.
Study group
This study was realized with 416 academicians, administrative personnel and students in 8 faculties shown in Table 1.

As shown in Table 1, 242 participants (%92.4) are from Zirve University -K. Mara? Sütçü ?mam University Education Manage-ment and Inspection Shared Program, 20 participants (%7.6) are from Harran University - Social Sciences Institute Education Management and Inspection Program. The participants from Slovakia are by groups; 103 teachers (66.9%) and 16 principals (%10.4) from schools of Vinne District and 35 academicians (22.7%) from Ruzomberok Catholic University.
Development of the data collection tool
While writing items for this scale, literature was reviewed about “perceptions of synergistic climate”. The related theoretical information was taken into consideration. After detailed scanning, 20 items for assessing the dimensions of X, Y, Z within Synergistic Climate were written. The items-pool was presented to 5 experts in the fields of education management and inspection, testing and assessment so that they could examine the items. These items were increased to 22 with field experts’ opinions. Data collection tool was presented in Likert type draft form; from I absolutelydisagree (1) to I absolutely agree (5).
Analysis of the data
The information related to analysis of data collected in the study ispresented in this part. The 22 itemed scale developed in this study was presented to 262 participants in Turkey and 154 participants in Slovakia. The item test correlations, exploratory factor analysis, confirmatory factor analysis, Cronbach’s Alpha, Kaiser-Meyer-Olkin (KMO) coefficient and Bartlett Sphericity tests were used to prove reliability and validity of the data.
Validity: Validity of the scale was examined with Exploratory Factor Analysis and Confirmatory Factor Analysis. Exploratory Factor Analysis aims at reaching meaningful structures at lesser numbers of factors (Büyüköztürk, 2011).
Exploratory Factor Analysis: Validity of a scale depends on how much it assesses a variable that is intended. Validity tests are generally done with theoretical analyses (Reuterbergand and Gustafsson, 1992). One of these theoretical analyses is called construct validity which foresees to what extent items are related to the variable intended to be assessed. In this study, factor analysis is given place as theoretical analysis. Factor analysis is one of the most used methods in proving construct validity of a scale (Bacon et al., 1995). The first method to be used within the scope of factor analysis is Exploratory Factor Analysis. This analysis is done to find out whether items are loaded into smaller number of factors or not. The items collected in the same factor group are given a name depending on features of item content (Balc?, 2005).
FINDINGS
Exploratory and confirmatory factor analysis and relia-bility, item analyses are explained in the findings part.
Exploratory Factor Analysis (EFA) Findings
Turkish Form EFA Findings
To collect data for construct validity of the scale, “rotated principal components analysis” was used. Kaiser-Meyer-Olkin (KMO) coefficient and Bartlett Sphericity test were employed to examine whether data were suitable for principal components analysis. KMO coefficient is a statistical method to prove whether the sample of items is adequate for a factor analysis or not. Data are admitted to be appropriate for analysis if KMO coefficient takes a value close to 1 and a perfect match if it is 1. Upon the analysis completed, KMO was found to be .972.
Normal distribution is necessary to use parametric methods. Bartlett Sphericity test is a statistical technique to test whether variances are equal across groups or samples. If chi-square test result is significant, it means data come from multivariate normal distribution. Bartlett test was found to be significant in the study (χ2=8568,53; p<.05). EFA was employed to reach a meaningful construct regarding persons’ synergistic climate perceptions and reveal constructs named factors.
After EFA, 6 items were removed from 22 item scale since these were found to be non-conforming with the construct of the scale or they loaded strongly on more than one factor (m4, m5, m6, m7, m8, m9). The rest 16 items have 2 factors with eigenvalues greater than 1. According to Exploratory Factor Analysis (EFA) results, distribution of 16 items into factors is shown in Table 2.
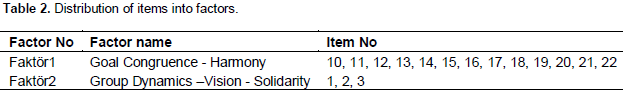
When Table 2 is examined, scale items are seen to gather under 2 factors: 10, 11, 12, 13, 14, 15, 16, 17, 18, 19, 20, 21, 22 items fall into Factor 1 named “Goal Congruence - Harmony”; 1, 2, 3 items fall into Factor 2 named “Group Dynamics –Vision - Solidarity”.
When Table 3 that includes numerical info regarding factors in scale is examined, there are 2 factors that have eigenvalues greater than 1.00.
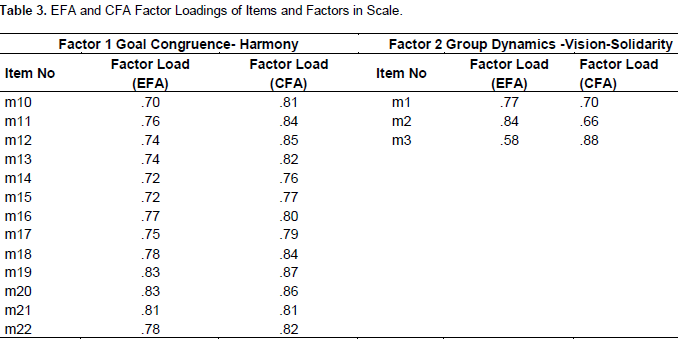
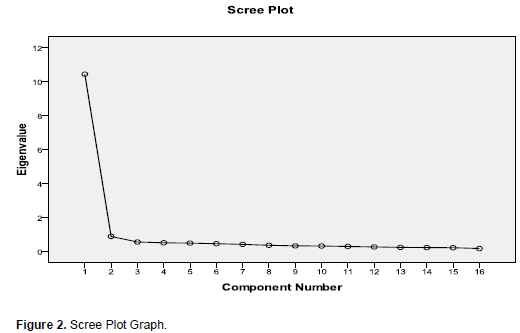
The total explained variance for scale is 70.59 and total-item correlations are between “.617 - .774”. Explained variance ratio is more than %30, which is assumed to be sufficient for social sciences’ scale development (Büyüköztürk et al., 2004). Factor 1 whose eigenvalue is 8.2 explains 51.2% of total variance, Factor 2 with 3.09 eigenvalue explains 19.33% of total variance. Graphical distribution of factors in explaining total variance of the scale is displayed in scree plot graph (Figure 1).

3 items in the scale were seen to have high loading values in two factors. Although the difference between the two values ??is less than 0.1, these items are very important for the content validity of the scale (Tabachnick and Fidell, 2001).Thus, they were not removed from the scale and were placed under the second factor.
When Scree Plot graph is examined, it is seen that the contribution of other factors to total variance percentage decreases after the first factor (Figure 2).
Slovakian form EFA results
“Rotated principal components analysis” was used to collect data about construct validity of the scale. Kaiser-Meyer-Olkin (KMO) coefficient and Bartlett Sphericity test was employed to examine whether data are appropriate for principal components analysis. KMO coefficient is a statistical method to prove whether the sample of items is adequate for a factor analysis or not. Data are accepted to be appropriate for analysis if KMO coefficient takes a value close to 1 and a perfect match if it is 1. Upon the analysis done, KMO value was found to be .871. Normal distribution is necessary to use parametric methods. Bartlett Sphericity test is a statistical technique to test whether variances are equal across groups or samples. If chi-square test result is significant, it means data come from multivariate normal distribution. Bartlett test was found to be significant in the study (χ2=1246,94; p<.05). EFA was employed to reach a meaningful construct regarding persons’ synergistic climate perceptions and reveal construct or constructs named factors.
After EFA, 7 items were removed from 22 itemed scale since these were found to be non-conforming with construct of the scale or they loaded strongly on more than one factor (m10, m12, m18, m19, m20, m21, m22). The rest 15 items have 3 factors with eigenvalues greater than 1. According to Exploratory Factor Analysis (EFA) results, distribution of 15 items into factors is shown in Table 4.
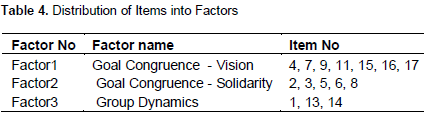
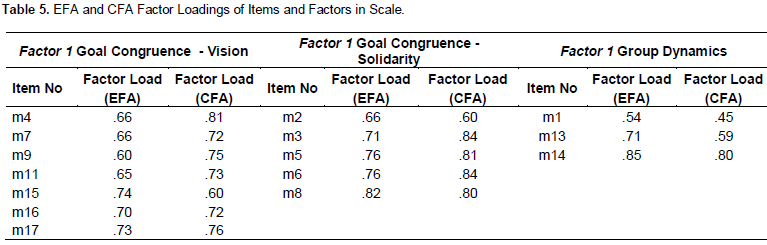
When Table 4 is examined, scale items are seen to gather under 3 factors: 4, 7, 9, 11, 15, 16, 17 items fall into Factor 1 named “Goal Congruence - Vision”; 2, 3, 5, 6, 8 items fall into Factor 2 named “Goal Congruence - Solidarity”. 1, 13, 14 items fall into Factor 3 named “Group Dynamics”.
When Table 5 that includes numerical info regarding factors in the scale is examined, there are found to be 3 factors that have eigenvalues greater than 1.00. The total explained variance of scale is 63.549 and total-item correlations are between “.360 - .778”. Explained variance ratio is more than 30%, which is assumed to be sufficient for social sciences’ scale development (Büyüköztürk et al., 2004). Factor 1 whose eigenvalue is 3.8 explains 25.8% of total variance, Factor 2 with 3.7 eigenvalue explains 24.85% of total variance. Factor 3 with 1.9 eigenvalue explains 12.8% of total variance. Graphical distribution of factors in explaining total variance of scale is displayed in scree plot graph (Figure 3).

When Scree Plot graph is examined, it is seen that the contribution of other factors to total variance percentage decreases after the first factor.
Synergistic Climate Turkish Form
Confirmatory Factor Analysis (CFA) Findings
In Confirmatory Factor Analysis done for Synergistic Climate Scale’s Turkish Form, it was tested to see to what extent the construct of the scale is consistent with the two-factor model shown by exploratory factor analysis. Factor loadings, error variances are displayed in path diagram (Figure 4).

While examining path diagram, it is seen that factors loadings of items in two-factor scale change between “.66-.89”. Also another result seen in the diagram is that error variances of items change between “.23-.51”. Fit indices calculated with Confirmatory Factor Analysis are given in Table 1. Fit indices criterion compared with obtained values are displayed with observed values.
As seen in Table 6, X2 value was not found to be at requested level and p<.05 was not met.

Calculation of X2/fd was considered more suitable to calculate goodness of fit. X2/fd value was found below 5; thus, goodness of fit was revealed to be good. When other fit indexes were checked, values of NFI, NNFI, CFI, IFI and RFI (≥0.95) and RMR (≤0.05) have perfect fit; value of GFI (≥0.90) has good fit (Hu and Bentler, 1999). The value of RMSEA was seen to have an acceptable level of fit. That RMSEA is lower than .08 means there is a good fit (Çokluk et al., 2010; Schermelleh-Engel et al., 2003).
SYNERGISTIC CLIMATE SCALE SLOVAKIAN FORM
Confirmatory Factor Analysis Findings
In Confirmatory Factor Analysis done for Slovakian Form of Synergistic Climate Scale, it was tested to see to what extent the construct of the scale was consistent with the three-factor model shown by exploratory factor analysis. Factor loadings, error variances are displayed in path diagram (Figure 5).
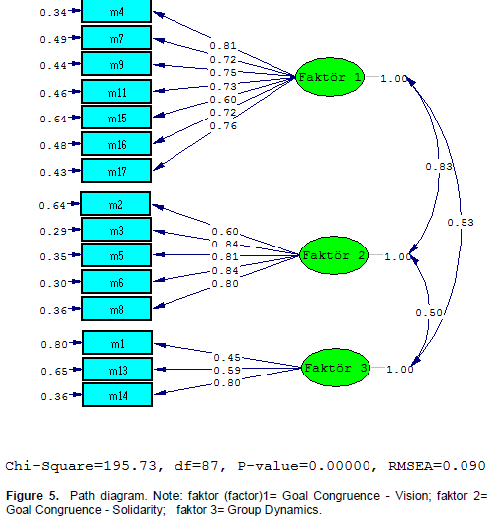
When examining the path diagram, it is seen that items’ factors loadings of three-factor scale change between “.45-.84”. Also another result obtained in the diagram is that error variances of items change between “.29-.80” Fit indices calculated with Confirmatory Factor Analysis are given in Table 7. Fit indices criterion compared with obtained values are displayed with observed values.
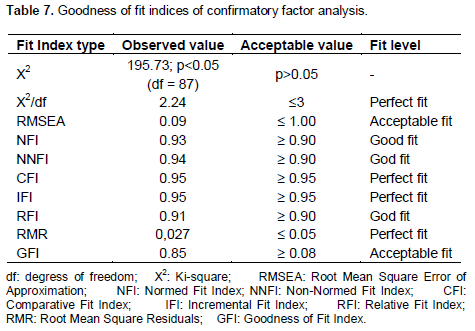
As seen in Table 7, X2 value was not found to be at the requested level and p<.05 condition was not met. Calculation of X2/fd was considered more suitable to calculate goodness of fit. X2/fd value was found below 3; thus, goodness of fit was revealed to be perfect. When the other goodness of fit indexes are checked, it has been seen that CFI and IFI values (≥0.95) and RMR value (≤0.05) indicate perfect fit, RMSEA and GFI values indicated acceptable fit.
Reliability and item analysis
Turkish
Internal consistency coefficient was calculated for the reliability of the scale. In the analysis done, total reliability coefficient for the whole scale was found to be 0.96. Internal consistency coefficient for each dimension is presented in Table 8.
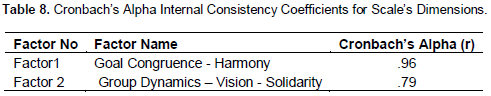
As seen in Table 7, internal consistency coefficients regarding synergistic climate was found to be .96 for Goal Congruence - Harmony dimension and .79 for Group Dynamics - Vision-Solidarity Dimension. When the Cronbach’s Alpha internal consistency coefficient for the whole scale was checked, this value was .96. Total-item correlation values for all items in the scale change between.41 and .75. When item is removed and internal consistency coefficient of the scale is examined, none of the items has shown decrease or increase in coefficient, whose value is .96 for all items.
Slovak
Internal consistency coefficient was calculated for the reliability of Synergistic Scale. In the analysis done, total reliability coefficient for the whole scale was found to be 0.96. Internal consistency coefficient for each dimension is presented in Table 9.
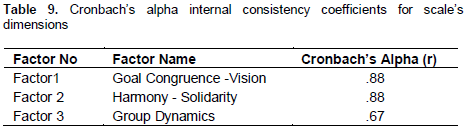
As seen in Table 9, internal consistency coefficients regarding synergistic climate was found to be .88 for Goal Congruence -Vision dimension; .88 for Harmony - Solidarity Dimension and .67 for Group Dynamics dimension. When the Cronbach’s Alpha internal consistency coefficient for the whole scale was checked, this value was found to be .91. Total-item correlation values for all items in the scale change between .33 and .79. When item is removed and internal consistency coefficient of the scale is examined, none of the items has shown decrease or increase in the coefficient, whose value is .91 for all items.
DISCUSSION
1- According to EFA results of Turkish form of the scale, the value of KMO was found to be .972 (χ2=8568,53; p<.05). At the end of EFA, 6 items (m4, m5, m6, m7, m8, m9), which did not comply with the structure of the scale or loaded under different factors, were removed from the scale which included 22 items initially. The remaining 16 items with eigenvalues higher than 1 formed 2 factored structure. Factor 1 composed of items of 10, 11, 12, 13, 14, 15, 16, 17, 18, 19, 20, 21, 22 was named “Goal Congruence - Harmony”; and Factor 2 composed of items of 1, 2, 3 was named “Group Dynamics Vision Solidarity”.
Total variance of the scale was found to be 70.59 % and factor loadings were seen to change between “.58-.84” and item-total correlations of the scale were found to change between “.61 - .77”. If item loading values are over .40, these items are evaluated as “very good”; if they are over 0.70, these are evaluated as “perfect” (Tabachnick and Fidell, 2001). In this case, scale items’ factor loadings could be said to be at good and perfect levels. While Factor 1 with eigenvalue of 8.2 explains 51.2 % of total variance, Factor 2 with eigenvalue of 3.09 explains 19.33 % of total variance. This change was also seen in Scree Plot; other factors following the first factor were seen to contribute less and less to total variance.
2- According to CFA results of Turkish version of the scale, factor loading values of items in two-factor structure were seen to vary between “.66 - .89”. In addition, the error variance of items was determined to change between “.23 - .51”. When fit index values ??upon CFA were examined, it was seen that value of X2 did not meet the condition of p <.05; thus, X2/fd value was examined. Output table presented a X2/fd value lower than 5, which shows that model has a good fit. In comparison with all other fit index values, it was spotted that NFI, NNFI, CFI, IFI and RFI values (≥0.95) have perfect fit (≤0.05); values of GFI (≥0.90) and RMSEA (≤ 0.08) have good fit. Even if value of RMSEA was not found at good level, the value is lower than 0.10, which shows there is conformity between model and real data (Çokluk et al., 2010).
3- According to EFA results of Slovak form of the scale, the value of KMO was found to be . 871 (χ2=1246,94; p<.05). According to EFA results, 7 items (m10, m12, m18, m19, m20, m21, m22) were removed from the scale. The remaining 15 items with eigenvalues higher than 1 formed 3 factored structure. Factor 1 including items of 4, 7, 9, 11, 15, 16, 17 was named “Goal Congruence -Vision”; and Factor 2 including items of 2, 3, 5, 6, 8 was named “Harmony - Solidarity” and Factor 3 including items of 1, 13, 14 was named “Group Dynamics”
Total variance of the scale was found to be 63.549 % and factor loadings were seen to change between “.54-.85” and item-total correlations of the scale were found to change between “.360 - .778”. Similar to Turkish version of the scale, scale items’ factor loadings for Slovak form are seen to be at good and perfect levels. While factor 1 with eigenvalue of 3.8 explains 25.8 % of total variance, factor 2 with eigenvalue of 3.7 explains 24.85 % of total variance and factor 4 with eigenvalue of 1.9 explains 12.8 % of total variance.
4- According to CFA results of Slovak version of the scale, factor loading values of items in three-factor structure were seen to vary between “66-.89”. In addition, the error variance of items was determined to change between “.23-.51”. When fit index values ??upon CFA were examined, it was seen that value of X2 did not meet the condition of p <.05. X2/fd value was examined and a value of X2/fd lower than 5 was found, which shows that model has a good fit. In comparison with all other fit index values, it was seen that NFI, NNFI, CFI, IFI and RFI values (≥0.95) have perfect fit (≤0.05); values of GFI (≥0.90) and RMSEA (≤ 0.08) have good fit.
5- According to the analysis conducted for the reliability of the scale, the Turkish form's reliability coefficient for the whole scale was found to be 0.96. When internal consistency coefficients of sub-dimensions were checked, X and Y dimensions were found to have .96 and .79 respectively. Item-total correlation values of all items in the scale were determined to be change between .41 and .75.
6- According to the analysis conducted for the reliability of the Slovak form of the scale, the form's reliability coefficient for the whole scale was found to be 0.91. When internal consistency coefficients of sub-dimensions were checked, X, Y, Z dimensions were found to have. 88, .88 and .67 respectively. Item-total correlation values of all items in the scale were determined to be change between .33 and .79. High internal consistency is an indicator of consistency between items and the whole scale and also construct validity (?encan, 2005). In this case, it is possible to say that internal consistency coefficients for Slovak and Turkish forms are high on scale and factor basis.
It is accepted that the perceptions of persons toward synergistic climate of the organization will increase as the points got from the scale increase. Dimensions of “Organization Culture” and “Team”, belonging to Synergistic Management Scale developed by Balay and Müjdeci (2013), have general similarity with synergistic climate and its dimension; group dynamics. However, when the items in Synergistic Management Scale are checked, it can be seen that these items are to do with assessing synergistic management rather than assessing synergistic climate in the organization.
CONCLUSION
The pursuit of synergy is generally considered an important strategic thrust in the organizations, the quest for global efficiency and effectiveness (Faes et al., 2000). In this regard synergistic climate is inevitable. Monitoring and evaluation of such climate entails robust scientific measuring tools.
When investigating the literature, it can be said that little attention is paid to developing scale to measure synergy particularly in educational organizations as well as other type of organizations. To fill such a gap, the purpose of this research was to develop a Synergistic Climate Scale (SCS) that could be used in organizations. As a result of the analysis made, it revealed that Turkish form has two factors entitled “Goal Congruence- Harmony” and “Group Dynamics - Vision - Solidarity” and 16 items; Slovakian form has three factors entitled Goal Congruence – Vision, “Harmony- Solidarity”, and “ Group Dynamics” and 15 items.
This study is considerable in terms of developing a scale in two different countries which have separate cultures, and displaying different results. In turn, the findings derived from this study can be seen as a contribution to be used in different countries in measuring synergistic climate and at the same time to make adapta-tion studies to different languages. Moreover, it was not solely performed to develop a scale in one language and in one culture. Actually it was aimed synchronously to see the different potential results of developing a scale in different cultures.
CONFLICT OF INTERESTS
The author has not declared any conflict of interests.
REFERENCES
| Aktan CC (1999). 2000'li yıllarda yeni yönetim teknikleri (4). Sinerjik yönetim, Ä°stanbul: TÜGÄ°AD Yayını. | ||||
| Aktan CC (2005). DeÄŸiÅŸim Çağında Yönetim. Ä°stanbul: Sistem Yayıncılık. | ||||
|
Amabile TM (1997). Entrepreneurial creativity through motivational synergy. J. Creative Behav. 31(1):18-26. Crossref |
||||
|
Argyris C (1958). Some problems in conceptualizing organizational climate: A case study of a bank. Admin. Sci. Q. 501-520. Crossref |
||||
| Balay R, Müjdeci N (2013, Kasım). Sinerjik yönetim ölçeÄŸinin geliÅŸtirilmesi. Sözel bildiri, VIII. Ulusal EÄŸitim Yönetimi Kongresi, Ä°stanbul. (Özet Kitabı). | ||||
| Balcı A (2005). Sosyal bilimlerde araştırma. Ankara: Pegema Yayıncılık. | ||||
|
Bacon DR, Sauer PL, Young M (1995). Composite reliability in structural equations modeling. Educ. Psychol. Meas. 55(3):394-406. Crossref |
||||
|
Bititci U, Turner T, Mackay D, Kearney D, Parung J, Walters D (2007). Managing synergy in collaborative enterprises. Production Planning & Control. 18(6):454-465. Crossref |
||||
| Bock GW, Zmud RW, Kim YG, Lee JN (2005). Behavioral intention formation in knowledge sharing: Examining the roles of extrinsic motivators, social-psychological forces, and organizational climate. MIS quarterly. 87-111. | ||||
|
Burton RM, Lauridsen J, Obel B (2004). The impact of organizational climate and strategic fit on firm performance. Hum. Resour. Manage. 43(1):67-82. Crossref |
||||
| Büyüköztürk Åž, Akgün Ö, Kahveci Ö, Demirel F (2004). Güdülenme ve ÖÄŸrenme Stratejileri ÖlçeÄŸinin Türkçe formunun geçerlik ve güvenirlik çalışması. Kuram ve Uygulamada EÄŸitim Bilimleri, 4(2), 207-239. | ||||
| Büyüköztürk Åž, Çokluk Ö, Köklü N (2011). Sosyal bilimlerde istatistik (7. Baskı). | ||||
|
Carlborg P, Kindstrom D, Kowalkowski C (2013). A lean approach for service productivity improvements: synergy or oxymoron? Managing Service Quality. 23(4):291-304. Crossref |
||||
|
Chen JK, Chen IS (2013). A theory of innovation resource synergy. Innovation-Management Policy & Practice. 15(3):368-392. Crossref |
||||
| Chou TC (2007). What is synergy? Scientist. 21(8):15-15. | ||||
|
CurÅŸeu P, Schruijer S (2012). Normativeinterventions, emergentcognitionanddecisionrationality in ad-hoc andestablishedgroups. Management Decision. 50(6):1062–1075. Crossref |
||||
|
CurÅŸeu PL, Jansen RJG, Chappin MMH (2013). Decision Rules and GroupRationality: CognitiveGainorStandstill? PLoS ONE 8(2): e56454. Crossref |
||||
| Çokluk Ö, ÅžekercioÄŸlu G, Büyüköztürk Åž (2010). Sosyal bilimler için çok deÄŸiÅŸkenli istatistik-SPSS ve LISREL uygulamaları. Ankara: Pegem A Yayınları. | ||||
| Dachler HP (1974). Work Motivation and the Concept of Organizational Climate. Research Report No. 4. | ||||
| Dahl BA (2000). Organizational Synergy in Medical Groups. Physician Executive 26(3):29. | ||||
|
Dereli T, BaykasoÄŸlu A (2010). Takım çalışması. Retrieved September 16, 2014 (de indirildi) from the World Wide Web: |
||||
|
Faes W, Matthyssens P, Vandenbempt K (2000). The pursuit of global purchasing synergy. Ind. Market. Manage. 29(6):539-553. Crossref |
||||
|
Fleishman EA (1953). Leadership climate, human relations training, and supervisory behavior. Pers. Psychol. 6(2):205-222. Crossref |
||||
|
Forehand GA, Von Haller G (1964). Environmental variation in studies of organizational behavior. Psychological bulletin. 62(6):361. Crossref |
||||
| French JRP, Caplan RD, Harrison RV (1982). The mechanisms of job stress and strain. Chichester: Wiley. | ||||
|
Gök S (2009). Örgüt ikliminin çalışanların motivasyonuna etkisi üzerine bir araÅŸtırma. Uluslararası Ä°nsan Bilimleri Dergisi. 6:2. EriÅŸim. |
||||
| Gürlek Y (2010). Yatılı Ä°lköÄŸretim Bölge Okullarındaki Yöneticilerin, ÖÄŸretmenlerin Ve DiÄŸer Çalışanların Sinerjik Yönetime Ä°liÅŸkin GörüÅŸleri. Yüksek Lisans Tezi, GaziosmanpaÅŸa Üniversitesi, Tokat. | ||||
|
Hu LT, Bentler PM (1999). Cutoff criteria for fit indexes in covariance structural analysis: Conventional criteria versus new alternatives. Structural Equation Modeling, 6:1-55. Crossref |
||||
|
James LR, Jones AP (1974). Organizational climate: A review of theory and research. Psychological Bull. 81(12):1096. Crossref |
||||
|
Jones J, Barry M (2011).Developing a scale to measure synergy in health promotion partnerships. Global Health Promotion 18(2):36-44. Crossref |
||||
|
Kristof-Brown AL, Zimmerman RD, Johnson EC (2005). Consequences of individuals' fit at work: A meta-analysis of person–job, person–organization, person–group, and person–supervisor fit. Pers. Psychol. 58:281−342. Crossref |
||||
|
Lasker RD, Weiss ES, Miller R (2001). Partnership synergy: A practical framework for studying and strengthening the collaborative advantage. Milbank Q. 79(2):179–205. Crossref |
||||
| Lasker RD, Weiss ES (2003).Creating Partnership Synergy: The Critical Role of Community Stakeholders.J. Health Hum. Services Admin. 26(1):119-139. | ||||
|
Lovelace K, Rosen B (1996). Differences in achieving person– organization fit among diverse groups of managers. J. Manage. 22:703−722. Crossref |
||||
|
Lyon HL, Ivancevich JM (1974). An exploratory investigation of organizational climate and job satisfaction in a hospital. Acad. Manage. J. 17(4):635-648. Crossref |
||||
| ÖzdevecioÄŸlu M, Ä°nce Balcı F (2012). Kültürel Sinerji Yönetimi: Kavramsal Çerçeve, Erciyes Üniversitesi Ä°ktisadi ve Ä°dari Bilimler Fakültesi Dergisi. 28(38):27-45. | ||||
|
Parmelee EL (2006). School and community: A case study of state-society synergy in public education. (Order No. 3239661, University of Denver). ProQuest Dissertations and Theses 294-294 p. |
||||
|
Patterson M, Warr P, West M (2004). Organizational climate and company productivity: The role of employee affect and employee level. J. Occupational Organ. Psychol. 77(2):193-216. Crossref |
||||
|
Pritchard RD, Karasick BW (1973). The effects of organizational climate on managerial job performance and job satisfaction. Organ. Behav. Human Perform. 9(1):126-146. Crossref |
||||
| Reeves ET (1970). The dynamics of group behavior. American Management Association Inc. | ||||
|
Reuterberg SE, Gustafsson JE (1992). Confirmatory factor analysis and reliability: Testing measurement model assumptions. Educ. Psychol. Meas. 52(4):795-811. Crossref |
||||
|
Rejeb Ben H, Morel-Guimaraes L, Boly V, Assielou NG (2008). Measuring innovation best practices: Improvement of an innovation index integrating threshold and synergy effects. Technovation 28(12):838-854. Crossref |
||||
| Schermelleh-Engel K, Moosbbrugger H, Muller H (2003). Evaluating the fit of structural equation models: Test of significance and descriptive goodness-of-fit measures. Methods of Psyohological Research Online, University of Koblenz-Landau. 8(2):23-74. | ||||
| Åžencan H (2005). Sosyal ve davranışsal ölçümlerde güvenilirlik ve geçerlilik. Ankara: Seçkin Yayınları. | ||||
| Tabachnick BG, Fidell, LS (2001). Using multivariate statistics (4th Ed.). Needham Heights, MA: Allyn & Bacon. | ||||
|
Tecim V (2005). Stratejik yönetim. Retrieved September 16, 2014 (de indirildi) from the World Wide Web. |
||||
|
Vidaver-Cohen D (1998). Moral climate in business firms: A conceptual framework for analysis and change. J. Bus. Ethics 17(11):211-1226. Crossref |
||||
| Wikipedia. http://en.wikipedia.org/wiki/Synergy | ||||
| Willard B (1994). Annual leadership development prework. IBM Canada, Leadership Development. | ||||
Copyright © 2024 Author(s) retain the copyright of this article.
This article is published under the terms of the Creative Commons Attribution License 4.0


