Full Length Research Paper

ABSTRACT
In this research, we aim to develop a 5-point likert scale and use it in an experimental application by performing its validity and reliability in order to measure the will perception of teenagers and adults. With this aim, firstly the items have been taken either in the same or changed way from various scales and an item pool including 61 items highly comprimising significant and probable testing areas have been formed. This item pool has been applied in a sample of 238 students at Erzincan University in the first stage. The last form Will Perception Scale (WPS) including 18 items determined as a result of the item analysis based on total-item correlation and the comparison of extreme groups has been applied in a sample of 238 new participants. Personal Information Form has also been applied in the second sample group. With the aim of testing the validity of the scale, Kaiser-Meyer-Olkin (KMO), Bartlett Test, Principal Components Analysis and Varimax Rotation Method have been employed. To test its reliability, Cronbach Alpha coefficients according to the factors have been calculated. As a result of the applications, the scale is seen to meet the requirements of validity and reliability. The factor loads of the items vary between .79, 128 and .81, 540. The lowest item total correlation of 18 items is .79, 128 (mean r= .80, 334); t values of these items vary between 2.049 and .32, 744. While the internal consistence of 61 items in the pool is a=.891, the internal consistence of 18 items in the scale is a=.918. The results obtained with the techniques such as item analysis, pearson correlation and factor analysis prove that all the validity and reliability indicators are high and as expected in literature, the scale can show that the highness of psychological symptom level, the lowness of willpower skill and the highness of paranormal beliefs and external locus of control in willpower skill are interrelating.
Key words: Will, will perception, will training, control, control locus, education.
INTRODUCTION
Human is a creature that has superior abilities to other living beings. The superiority of human brings respon-sibility. His responsibility is based on his will (Akgüç, 2008:253). Human is a human with his will, not his intelligence and knowledge. Intelligence and knowledge more or less exist in animals. However, will is morally a power and privilege peculiar to human who comprises the last ring of the chain of living organisms.
Will is not only a power and privilege but it is also the only spiritual force differing people and creating the difference of superiority and inferiority among them (Ba?gil, 2009: 26).
Willpower can be defined as choosing and deciding and converting these choices to actions (Dökmen, 2000: 213). Will is defined as the thing known directly. In addition to this, the way to the apparent material world starts from it. Will is the key to everything. It is a narrow door to reality. We must understand the universe through our existence. People’s wills appear in their bodies. This will brings forth intelligence in the brain and the continuity demand in body (Schopenhour, 1962:25).
The theoretical and psychological requirements related with the term, will
Will in keeping life under control and willingness is discussed in psychology like that: Will (volition, willpower) is a term Rank uses as an integrative power of personality. Rank interpreted this term as the natural result of being born and an obligatory element for the development of a human organism (Geçtan, 1998:157).
Rank describes three developmental stages of willpower: (1) counter willpower - objection to a person’s willpower (Yalom, 2001; Babayi?it, 469). A child learns to say no to his/her parents and own impulses with counter willpower. Rank says that willpower is determined as counter willpower (Geçtan, 1998:158). 2- positive willpower, a person’s being ready for the thing to do, 3- creative willpower, a person’s being ready for the thing (s)he wants to do (Yalom, 2001; Babayi?it,469). Rank has defined human as a living being who is conscious, purposeful, and able to make a choice and direct himself/herself (Geçtan, 1998:158).
Erikson also highlights the fifth psychosocial develop-ment stage “identity versus confusion” and identity. Erikson states that identity versus confusion stage is the stage where gains of previous four stages reappear, an individual think about these gains and (s)he tries to combine these gains with the society (s)he lives in (Arslan, 2008:3). Sense of autonomy which is the gain of the second stage and will can gain a place in personality within reliable relationships and disagreeements during puberty (Dereboy, 1993 as cited in: Arslan, 2008:32).
As is seen, the term will comes to the fore in two stages of Erik Erikson. It is seen that a person starting to gain will in autonomy versus shame and doubt stage starts to form his/her personality in identity versus confusion stage
In existentialist approach, there are four main anxieties. These are necrophobia (fear of death), freedom, isolation and meaninglessness. The four main anxieties in question create anxiety and worry and people develop some coping mechanisms in order to cope with this anxiety. Fear of death, isolation-loneliness and finding no meaning in life can direclty be a source of anxiety. What freedom means is that human is a willed creature who can make free choices and take responsibility of them. How much freedom is used and how much responsibility a human takes afflict human (Dökmen, 2000: 50).
When the relevant literature above and the research done about will are analyzed, will is taken into account as an emotion in some sources (Berkowitz, 1963; Satre, 1965; Dökmen, 2000) while some researchers take it as a skill in others (Glover, 1970; Popkin, 1987; Chamberlin, 1994; Jenkins, 1994; Ellenburg, 2001). Some of them define it as a personality trait and characteristic (Yalom, 2001; Ruyter, 2002; Golzar, 2006).
Within this scope, developing a Will Perception Likert Scale which is more comprehensive than locus of control scales and whose structure has been determined is aimed in order to determine how a person’s will affect choosing behaviour and deciding process while having a behavioral pattern and how (s)he uses it so that it can be used in the sample of university students at first.
In the second stage we aimed to check its feasibility with demographic variations of the scale with 18 items.
In the third stage we aimed to determine whether any change will be seen in those who got Will Education in Psiko-education Program after they get low score from the scale.
METHODOLOGY
Sample
In the first stage of the research, the sample consists of 238 voluntary participants from the students in the departments of Psychological Counselling and Guidance, Theology, Mathematics, Economics, Public Administration, Mechanical Engineering and Electrical and Electronic Engineering at Erzincan University (Turkey). 151 of the participants are females, 87 of them are males and the average age of the whole group is 21.1. (S=2.2, Ranj=17-28).
Data collection tool
In this research, developing an extensive Will Likert Scale about what will is and what will is not is aimed. With this aim, a list has been formed by doing a broad literautre search. Moreover, the questions “What is will for you?”, “What is sense of will for you?” “What is a willed behaviour for you?” are asked to 238 voluntary participiants in order to answer them. The answers given to these open-ended questions have been classified and 61 items have been formed.
It has been seen that 61 items in the scale have 5 groups of will. These are (1) Will and chance, (2) Will and destiny, (3) Will and justice, (4) Will and power, (5) Will and control belief. Therefore, it has been thought that the items determined for the pool and focus of will belief can represent all the fields of will researched in literature.
The scale items were formed in accordance with 5-point Likert format. The rating was done and graded as thus: “Totally disagree (1)”, “Disagree (2)”, “Agree sometimes (3)”, “Agree (4)”, “Totally agree (5)”. 32 of the scale items were answered regularly and 29 of them were answered irregularly, and so no response bias. The scale was used with the instruction below.
With this survey, it is aimed to determine people’s ideas about life. You are asked to state to what extent you agree with the ideas presented in these items.
For this, please read each item carefully and state the degree of relevancy of the idea presented in that item with your ideas. It is enough to put a (X) sign into the box reflecting your idea among the alternatives opposite to each statement. There is no “True” or “false” answer.
Process
The application of the scale to the participants was done by the researcher during the course hours as groups. The particiants were informed about the fact that they can ask questions about the unclear points in the items and these kinds of demands were met by the researcher.
FINDINGS
The scale was done for the experimental group for validity and reliability analysis. Firstly exploratory factor analysis was done over the data obtained from the scale for validity. The eigenvalue of the items is 1, the core values of the items are at least .30, the items are in only one factor and the difference among the factors in two factors is at least .10 in exploratory factor analysis while deter-mining the items will be in the scale (Büyüköztürk, 2007). In addition to this, during validity analysis, 25 degree varimax rotation was done.
The concordance of item-factor structure obtained from exploratory factor analysis and model was tested with confirmatory factor analysis. The validity analysis of the scale was done with coefficient of internal consistence. In the research, SPSS 19.0 packaged program was used and co-efficient of internal consistence was determined in order to do exploratory factor analysis. Lisrel 8.7 packaged program was used in order to do confirmatory factor analysis. In the research, a control scale formatted Likert type was aimed. With this aim, item analysis was done in order to determine which items of the scale including 61 items are statistically functional. In this study, it was thought that it must be started with an item analysis prioritising the relationship between conceptual dimension which it measured and general scale score of each item (item total correlation). In this direction, for each item of the scale, item total correlation was cal-culated with item delivery technique. These correlations vary between 0.00 and 0.87 values. Furthermore, it has been analyzed whether each item distinguishes the group belonging to top 27% of the sample from the group belonging to bottom 27% of the total score significantly. For this, the scores of two groups in question have been compared with t test technique. As a result of this analysis, 17 items cannot distinguish the top and bottom groups significantly.
As a result of item analysis carried out in two stages, in addition to 17 items which cannot distinguish the top and bottom groups significantly, another 20 items whose total correlation is .50 or which are substractive have been taken from the scale even if they can distinguish with their relatively low t values. However, in the factor analysis done in order to test the validity of the scale, 4 factors are seen with principal component analysis in the unrotated factor analysis as a result of the analysis done without limiting factors in the will scale. As the amount of variance which can be explained with four factors is 49.2% and has difficulty in giving meaning to factors quite well and forming content integrity, the structure explaining 79.85% of variance with varimax vertical rotation tecnique by being limited with a single factor has been obtained as it must be a single factor for the scale’s capability to prove the existence and absence of will. The factor loads of the items vary between .79, 128 and .81, 540. Therefore, the lowest item total correlation of 18 items has been .79, 128 (mean r= .80, 334); t values of these items vary between 2.049 and .32. 744. Furthermore, while the internal consistence 61 items in the pool is a=.891, the internal consistence of 18 items in the scale is a=.918. It has been thought that a new scale including 18 items and a really high reliability is obtained in this way.In the second stage of the research, the sample consists of 238 voluntary participants from the students in the departments of Psychological Counselling and Guidance, Theology, Mathematics, Economics, Public Administration, Mechanical Engineering and Electrical and Electronic Engineering at Erzincan University (Turkey). 151 of the participants are females, 87 of them are males and the average age of the whole group is 21,1 (S=2.2, Ranj=17-28).
In this stage of the research, Will Scale including 18 items whose functionality has been determined at the end of the first study has been used as a data collection tool. Again 5 point Likert scale has been graded regularly (the items graded irregularly have been eliminated). The ascent in scores reflects the highness of will and probable score range is among 18-90. Personal Information Form was applied to the sample and demographic attributes were obtained.
The statistical processes in the research are in order of exploratory factor analysis, confirmatory factor analysis and determining coefficient of internal consistence. For the validity of the scale, exploratory factor analysis was done over the scores obtained from the tyrant dimension. The pattern obtained as a result of exploratory factor analysis was tested with confirmatory factor analysis for both tyrant and victim dimensions. The findings are presented in order of statistical process.
Exploratory factor analysis
For the validity of Will Perception Scale, exploratory factor analysis is done at first. Firstly, in order to do this analysis, KMO test testing the sufficiency of the sample is done. KMO value is found as .84. According to Büyüköztürk (2007), it is concluded that the factor analysis can be done over the data obtained as this value is bigger than .70. Secondly, it is determined that a factor analysis is suitable to be done as the data obtained by looking at the results of Bartlett Sphericity (χ2 = 3470.59, p.=.000) vary significantly (Büyüköztürk, 2007). Varimax rotation (25) was done so that principal component analysis can be done at first in a way that the core values of 18 items in the factor analysis are 1. As a result of validity analysis, it has been found that the scale has a single factor structure Table 1.
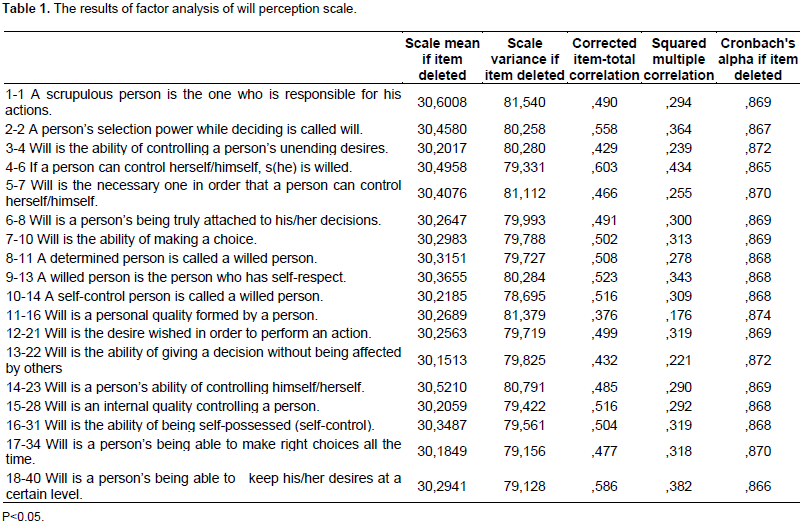
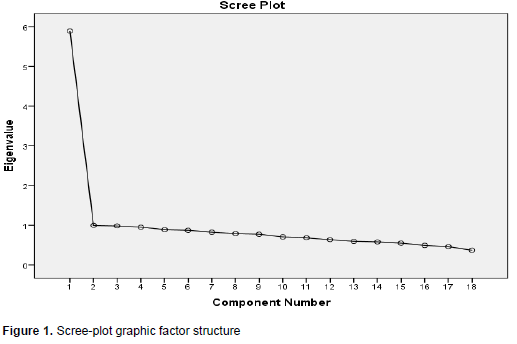
When the whole scale including 18 items are taken into account, it demonstrates that the scale has a single factor structure. The factor load values of 18 items in the scale vary between 0.79 and 0.81. Single factor explains 79.85% of total variance in the scale. As a result of exploratory factor analysis, it has been found that the scale consists of 18 items and a single factor. These values show that the scale explains will well. The model concordance test of the values obtained and the structure has been analyzed with confirmatory factor analysis (Figure 1).
Confirmatory factor analysis
The scale including 18 items and a single factor was tested with confirmatory factor analysis. As a result of CFA done, it is seen that all the factors explain will per-ception variable significantly when it is checked whether the factors determined explain will variable significantly. As a result of the analysis done, it is found that fit indexes are X2= 137.70 (sd=139, p.= .00), X2 / sd= 3.47 RMSEA= 0.000, GFI= 0.94, AGFI= 0.93, CFI= 1.00, NFI=0.95 ve NNFI= 1.00 (Figure 2).
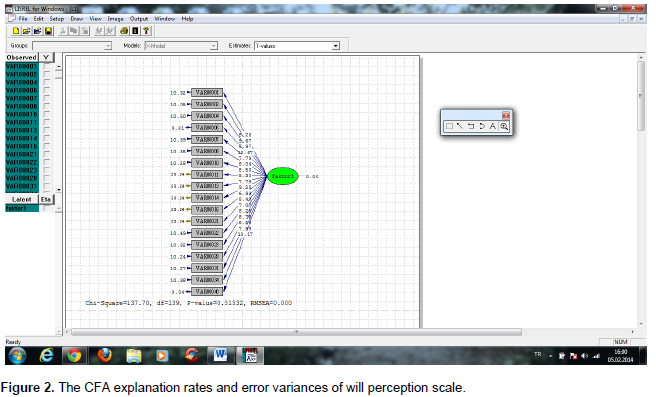
In order to determine the accordance of the models formed with confirmatory factor analyises and the data, the evaluation was done by looking through fit indexes such as X2 (chi-square), RMSEA, GFI, AGFI, CFI, NNFI (Anderson and Gerbing, 1984). In this evaluation, it has been accepted that the accordance of the model with the data is perfect in the case that the rate of X2/sd is 5 or less. The value of RMSEA is close to zero and less than 0.05, which shows that the accordance of the model with the data is perfect. However, the rate up to 0.08 can be accepted for the accordance of data. Besides, it shows that the accordance of the model with the data is perfect in the event that CFI and AGFI indexes are higher than 0.90. It has been accepted that 0.85 and higher for CFI and 0.80 and higher for AGFI are enough for the accordance of the model with the data (Anderson and Gerbing, 1984).
When fit indexes of the scale are analyzed, fit indexes are seen to be at an acceptable level. Based on these findings, the validity of the scale can be stated to be achieved. For reliability analysis of the scale, coefficients of internal consistence (alpha) have been calculated.
Coefficients of internal consistence
For the scale including 18 items and a single factor, predictions of reliability have been obtained by testing their internal consistence. The 18- item total coefficient of internal consistence of will perception is found to be .81. It is regarded as an acceptable value for validity of the scale. The values obtained as a result of validity-reliability analysis show that it can be used in terms of the psychometric qualities of the scale.
The offer of Will Development Training has been given to 90 people who have taken low points from Will Scale and 41 people have accepted to attend the psycho-education group voluntarily. The program starting on 1 March 2014 was carried out for 90 min at 13.30 – 15.00 every Tuesday at the Hall of Psychological Counselling with Group, the Department of Pyschological Counselling and Guidance, Faculty of Education, Erzincan University and the application was continued for 12 weeks until 31 July 2014 (The demands of Bairam Holiday and Some Intersessions were met). The program carried out by the researcher was also applied in the experimental and control groups of the scale in August 2014. The scale was applied to 41 people attending will training in experimental group and for 79 people in control group.
Analyzing and commenting on the data
In the scale prepared with 5 point likert approach, the alternative “Totally Agree” was given 5 points, “Agree Sometimes” 4 points, “Agree” 3 points, “Disagree” 2 points and “Totally Disagree” 1 point. In the assessment, The score interval of “5” has been accepted to be 4.20-5.00, the score interval of “4” to be 3.40-4.19, the score interval of “3” to be 2.60-3.39, the score interval of “2” to be 1.80-2.59 and the score interval of “1” to be 1.00-1.79. Arithmetic mean and standard deviation value have been used for the analysis of descriptive data, and one-way ANOVA analysis was used for comparing family education scores of experimental and control groups. In order to comment on the findings, level of significance was accepted as .05.
Findings and comments
Firstly descriptive and then statistical analysis were used by starting from the first factor of the scale while commenting on the findings.
The perceptions of the socioeconomic qualities of a family and the functions of school
During the research, the perceptions related with the first factor of experimental and control groups were com-mented on at first and standard deviation data were used in order to determine the qualities of score range of the items. The variation percentage of standard deviation according to mean was determined through variance coefficient (V=S/ X .100) (Akdeniz, 1998). The variance coefficient of experimental group’s parents is V=1.15/ 3.88x100 29.64%. As is seen in Table 2, in this factor the perceptions of experimental group concentrate at the alternative “Agree sometimes” which is a general average (X =3.¯88) and spread to the alternatives “Agree” and “Totally Agree”, so they range in different alternatives approximately at the rate of 1/3. The variance coefficient of the individuals’ will perceptions in the control group is 46.16% and it has been determined that the range shows quite a spread quality. In control group, it has been understood that individuals can generally comprehend the functions of using will with their own personal psychosocial qualities as a systematical and functional will training supported by the experts has not been given in control group. On the other hand, it has shown that the will training supported by the psychoeducation experts about the will perceptions of experimental group has been effective about “understanding and using will”.

Findings show that the ultimate targets can be reached as a result of will training program if an individual knows himself/herself and family qualities. According to control group, the lowest realization rates include the subjects ‘the solution of the problems an individual can have (Item. 5)’ and ‘the usage of will in case of failure (Item 16)’. According to this, for the indivuduals to use their will power and perceptions are seen to be quite inadequate. Individuals’ Will Perceptions Related with Psychosocial, Academic and Personal Development Opportunities have been compared in Table 3.
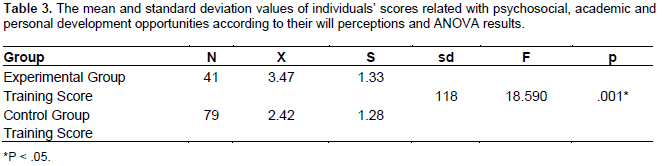
It has been concluded that there were significant differences among the will perceptions of individuals in the experimental and control group according to the result of the scale [F (118)=18.590, p<.05]. As is seen from Table 3, in this factor where the data related with ‘Psychosocial, Academic and Personal Development Opportunities’ have been taken into account, the alternative of “Agree” appears in experimental group, the alternative of “Totally Disagee” appears in control group. According to these findings, it has been shown that will training contributes to ‘Psychosocial, Academic and Personal Development’ significantly by means of educational facilities offerred to individuals and the will perceptions of individuals who do not attend to Will Training remain at a low level. The findings show that individuals need to know themselves and have the knowledge about their will perceptions and call attention to the requirement of vocational training.
DISCUSSION AND CONCLUSION
When the scale of internal coefficient (a=.918) being also another structural validity (Anastasi and Urban, 1997) is taken into account, it can be concluded that Will Scale has shared 45% variance with both factor structure and Locus of Control Scale measuring in similar field; andWill Scale is the scale measuring will perception based on correlations with some related variations and thus it is valid in published literature. This tool is seen to be used reliably when it is considered with its high coefficience of reliability.
It has been determined that its content is more comprehensive, its answering format is less limiting and its dimension is simpler than other control scales. It has been thought that developing a suitable Will Perception Scale for the young and adult and practising it in a psychoeducation program are significant contributions to the field. Within this scope, it can be said that the researcher has reached his initial aim.
Due to the fact that will is a cognitive characteristic, the arrangement of the training programs in a way it brings students rich experiences to be able to use will can make their perceptions of the skills of using will high. For this, a program can be prepared and carried out for the development of the skill of using will collobaratively (Paliç, 2011).
The studies in literature support the idea that using will power is a skill and it can be developed with training. This skill can be applicable to different people, time, event and surroundings. The adoption and internalization of this skill and its adaptation to cognitive, affective and behavioral areas in different ways must be included in the long-term targets. In addition to the information in literature, through this research, we aimed to achieve a program to help the young and adult cope with their problems.
The research is limited to university students. It is necessary to test the effectivity of the program in different types of school and adult employees as it has been done with only university students. In the direction of findings obtained, it has been suggested that will perception skill training should be among main subjects in guidance activities with the thought of its capability of contributing to university students’ both academic and emotional-social development in the educational, vocational and personal guidance studies. Due to group dynamic’s contribution to social skill training, it must be thought as another suggestion that group guidance activities should be preferred by school counsellors working at schools.
In short, the success in using will depends on the true identification of the problem at first. In addition to the identification of the problem truly, enough knowledge must be obtained about the problematic situation and various behaviour types thought to eliminate this problem must be formulated and it must be started from the alternative to lead to the best solution. If the available alternatives are applied and they are successful after the evaluation of them, it is continued in that way; otherwise, another alternative is put into practice.
CONFLICT OF INTERESTS
The author has not declared any conflict of interests.
REFERENCES
|
Anastasi A, Urbina S (1997). Psychological Testing (7.ed). NJ: Prentice-Hall. |
|
|
|
|
|
Arslan E (2008). ""Adolescents in terms of attachment styles Erikson's psychosocial developmental period and Investigation of Ego Identity Process", Selcuk University, PhD Thesis, Konya, Turkey. |
|
|
|
|
|
BaÅŸgil AF (2009). Alone with a young, Istanbul: Yagmur Publications, Istanbul, Turkey. |
|
|
|
|
|
Berkowitz LD (1963). "Responsibility and Dependency", J. Abnormal Soc. Psychol. 66:429–436. |
|
|
|
|
|
Berkowitz L, Lutterman K (1968)."The traditional Socially Responsible Personality", Public Opinion Quarterly. 32: 169-185. |
|
|
|
|
|
Büyüköztürk Åž (2007). Data Analysis Manual for Social Sciences. PEGEM A Publications. 180s, Ankara. |
|
|
|
|
|
Chamberlin LJ (1994). "Developing Responsibility In Today's Students". Clearing House 67(4):204 - 206. |
|
|
|
|
|
Dökmen Ü (2000). To exist, Thrive, Reconciliation. Sistem Publication Ä°stanbul, Turkey. |
|
|
|
|
|
Ellenburg FC (2001). "Society And Schoole Must Teach Responsible Behavior", Educ. Adm. 106(1):9-11. |
|
|
|
|
|
Geçtan E (1998). Psychoanalysis and After. Remzi Publication, Ä°stanbul, Türkey. |
|
|
|
|
|
Glover J (1970). On responsibility. New York: Humanities Pres, p.96. |
|
|
|
|
|
Paliç G (2011). Students Voice Opinions on Concepts and Knowledge Level, e-Journal of New World Sciences Acad. 6(1):66-77. |
|
|
|
|
|
Popkin MK (1987). Adjustment Disorders in Medically III Ä°npatients Referred For Consultation in A University Hospital. Psychosomat-ics, 31(4):410-414. |
|
|
|
|
|
Ruyter D (2002). 'The Virtue Of Taking Responsibility", Educ. Philosophy Theory 34(1):25-36. |
|
|
|
|
|
Yalom I (2001). Existential Psychotherapy. (Trans: I Babayiğit) in Istanbul, Kabalcı Publisher, Istanbul Turkey. |
|
Copyright © 2024 Author(s) retain the copyright of this article.
This article is published under the terms of the Creative Commons Attribution License 4.0


