ABSTRACT
This study assessed farmers’ perception and adaptation options to climate change in six kebeles selected from different agro-ecological zones of Dire Dawa Administration, eastern Ethiopia. Data for the study were collected from 171 respondents selected through multi-stage sampling technique. Descriptive statistics were employed to assess climate change perception differentials among gender, social groups and institutional settings, while multinomial logit model (MNL) was used to identify factors influencing households’ climate change adaptation options. The results revealed an increment in annual (0.2-1.1°C/decade) and seasonal (0.5-1.4°C/decade) temperatures at all stations and the rate of an increment was found to be higher in the highland areas. Similarly, 76.0 and 81.9% of the interviewed farmers were aware of the change in annual and seasonal temperature respectively and their perception appears to be in accordance with the statistical record of these areas. Whereas, both the annual and seasonal precipitations were found to have no trend, except for one station at Dire Dawa where only annual and summer precipitations were found to have an increasing trend and Kulubi where a winter precipitation was found to have a decreasing trend. Farmers’ perception on the patterns of annual and meher precipitations were in line with the observed data at two stations (Kulubi and Dengego). On the other hand, the surveyed farm households in the study area perceived at least one aspect of climate change primarily through their life experience. The majority of farmers (81.87%) adapted to climate change stresses using the adaptation strategies such as soil and water conservation with or without agronomic practices like change in cropping time; crop type and variety and crop diversification. Results of the multinomial logit model showed that farm size, level of education of household head, agro-ecology, livestock owned, farm income and credit service significantly and positively influences one or a combination of climate change adaptation strategies identified by farmers. On the other hand, gender, age of the household head and non-farm income were found to influence the adaptation strategies pursued by farmers negatively and significantly. Therefore, an effort that enhances farmers’ education, farm and livestock productivity, and credit services in accordance with different agro-ecologies so as to create the capacity to adapt to climate induced stresses remain an important strategy that policy makers at all levels of the administration should consider. In addition, sex, age and non-farm income of the household should also be sought critically.
Key words: Climate change, adaptation, perception, determinants, multinomial logit model.
The Intergovernmental Panel on Climate Change (IPCC) in 2007 reported that there is a statistically significant increase in the global mean state of the climate or in its variance, and further increases are expected if carbon dioxide (CO2) and greenhouse gas (GHG) emissions are not controlled. Moreover, there is a general agreement that the earth’s climate is undergoing changes, and observations are consistent with scientific expectations regarding the increasing concentration of GHG in the atmosphere. On the other hand, human activities, such as burning of fossil fuels, deforestation, and/or poor natural resource management have changed the global climate resulting in an increased temperature and alter the amount, intensity and distribution of precipitation and sea level rising (IPCC, 2007).
Climate change has adversely affected the livelihood of people in developing countries where a large proportion of the population is heavily dependent on agriculture, and has exacerbated poverty, food insecurity and vulnerability of agro-pastoral community in sub-Saharan Africa (Bryan et al., 2009). Ethiopia, a country having dependent on the agricultural sector (accounts for about 52% of the GDP and 85% of the foreign exchange earnings, and employs about 80% of the population) (CSA, 2007) could be widely held as one of the most vulnerable countries to future climate change stresses (Conway and Schipper, 2011).
A recent mapping on vulnerability and poverty in Africa has ranked Ethiopia as one of the most vulnerable countries in the continent with the least adaptive capacity to climate change. Even though, the impact of climate change is not limited to the occurrence of drought (Lautze et al., 2003), Ethiopia has suffered from at least five major national drought since 1980, apart from numerous local drought all over the country (ILRI, 2006; ACCCA, 2010). In addition other important climate variables such as daily temperature, precipitation (type, frequency and intensity), wind, relative humidity and cloud are also changing, implying the multiple aftermath of the change in climate in the country.
Tadege (2007) indicated that, over the last decade an average minimum and maximum temperatures of the country have increased by around 0.25 and 0.1°C, respectively, and further it is expected that in the year 2050 mean temperature will increase by 1.7 to 2.1°C. Though, most climate models support this increase in temperature, there is contradictory ideas as to the change in precipitation, where both increase and decrease are forecasted depending on the model employed (Strzepek and Mccluskey, 2006). Accordingly, high variability in precipitation is observed in the country
Study area, sampling and data collection
The study was carried out in Dire Dawa Administration (DDA) which is astronomically located between 9° 27` to 9° 49` N and 41° 38`- 42° 19’ E longitude and found in the eastern part of Ethiopia 515 km away from the capital Addis Ababa and 330 km to the west of the republic of Djibouti (IDP, 2006). DDA is organized into 38 rural and 9 urban kebeles (Smallest administrative unit). It has a rugged and undulating mountainous topography ranging from 1000 to 2260 m asl with a total annual rainfall ranging between 410 to 850 mm and extreme temperature ranging from 14.5 to 34.6°C. The study area covers a total area of 1332.62 km2 and an estimated total population of 377,000 (CSA, 2007). Agriculture (both crop and livestock production) is the main stay of the economy in the study area. Subsistence mixed farming constitutes 93% of the total farm households in the study area.
For collecting primary data the study employed a multistage sampling technique to select sample farm household. In the first stage, out of the 38 kebeles in the Administration, six kebeles, of which four (Biyo-Awale, Adada, Legebira and Eja-Aneni) are selected from densely populated eastern Woinadega (area with altitude between 1500-2400 m. a. s. l and relatively colder and wetter) zone and two (Gedensar and Goleadeg) from sparsely populated western kola zone (area with altitude between 500-1500 m. a. s. l and are relatively drier and warmer IDP (2006)). were randomly selected to represent different attributes of the Administration with respect to agro-ecological differences, and agricultural production systems. In the second stage, a total of 171 farm households were sampled randomly using probability proportional to the size (PPS) of the total households of each kebele. To select sample households from the selected kebeles, list of household heads has been used. Enumerators were trained for one day to familiarize them with the issues of data collection and the questionnaire was pretested.
Both primary and secondary data were collected from different sources. Primary data were collected using a structured questionnaire, whereas data on the physical, socio-economic and demographic variables of each kebele, and information on climate condition in the study area were gathered from secondary sources such as repots previous studies.
Data analysis
This study employed both qualitative and quantitative analysis techniques. The qualitative analyses used interpretations, comparisons and arguments. The quantitative analyses made use of both descriptive statistics and econometric techniques. Farmers’ perception analysis was subjected to descriptive statistics tools such as mean, frequency and percentages. In addition, probability distribution tests like independent t-test and chi-square test were used to test whether there is a statistically significant differences between the two groups (who perceive climate change and not) in terms of continuous and categorical variables, respectively.
Econometric analysis
The decision of whether to use any adaptation option or not could fall under the general framework of utility maximization (Komba and Muchapondwa, 2012). Consider a rational farmer who seeks to maximize the present value of expected benefits of production over a specified time horizon, and must choose among a set of j adaptation options. Farmer i decide to use j adaptation option if the perceived benefit from option j is greater than the utility from other options (say, k) depicted as:

Where Uij and Uik are the perceived utility by farmer i of adaptation options j and k, respectively; Xi is a vector of explanatory variables that influence the choice of the adaptation option; βj and βk are parameters to be estimated; and εj and εk are the error terms. Both multinomial logit (MNL) and multinomial probit (MNP) regression models estimate the effect of explanatory variables on a dependent variable involving multiple choices with unordered response categories (Deressa et al., 2008). However, due to computational simplicity, the MNL specification was used to model climate change adaptation behavior of farmers involving discrete dependent variables with multiple unordered choices (Deressa et al., 2009; Legesse et al., 2013; Tessema et al., 2013). Deressa et al. (2009) indicated that, the model is normally estimated using the iterative maximum likelihood estimation procedure, which yields unbiased, efficient and consistent parameter estimates.
To describe the MNL model, let y denote a random variable taking on the values (1, 2, . . ., J) where J is a positive integer, and let x denote a set of conditioning variables. In this case, y denotes adaptation options or categories and x represents the different household, institutional and environmental attributes affecting adaptation options. The question is how changes in the elements of x affect, keeping other factors constant, the response probabilities P(y = j|x), j = 1, 2… J. Since the probabilities must sum to unity, P(y = j|x) is determined ones we know the probabilities for j = 2... J.
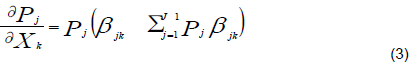
Let x be a 1 x K vector with first element unity. Thus, the probability that household i with characteristic x choose adaptation option j is specified as follows:
Where P stands for probability, j stands for adaptation option, x for explanatory variables and βj = K x 1 coefficients, j = 1, 2. . , J.
The MNL, however, works under the assumption of the Independence of Irrelevant Alternatives (IIA). Following this assumption, the odds of any two outcomes are independent of the remaining outcomes available. Hence, omitting or adding outcomes should not affect the odds of the remaining outcomes (Long and Freese, 2001). It indicates that the probability of using a certain adaptation option by a given household needs to be independent from the probability of choosing another adaptation option (that is, Pj/Pk is independent of the remaining probabilities). Thus, before data analysis and presentation, the model has to be tested for the validity of the IIA assumptions, using the Hausman test as explained in Hassan and Nhemachena (2008) and Deressa et al. (2009).
The parameter estimates of the MNL model only show the direction of the relationship between the dependent and independent variables. Therefore, to determine the actual magnitude of change of probabilities, the marginal effect of the explanatory variables, the MNL equation has to be differentiated. Differentiating the equation of multinomial logit model with respect to the explanatory variable provides marginal effect of the explanatory variable (the probability of change in dependent variable with a unit change in the independent variable). This will be calculated as follows:
The marginal effects or marginal probabilities are functions of the probability itself and measure the expected change in probability of a particular choice being made with respect to a unit change in an independent variable from the mean.
Moreover, the model will be tested for multicollinearity using the variance inflation factor (VIF) computed as follows:
Where VIFj is variance inflation factor, Rj2 is the coefficient of determination that results when one explanatory variable (j) is regressed against all other explanatory variables. By default, value of VIF greater than 10 is assumed to indicate model multicollinearity problem (Gujarati, 1995).
Variable definition and working hypothesis
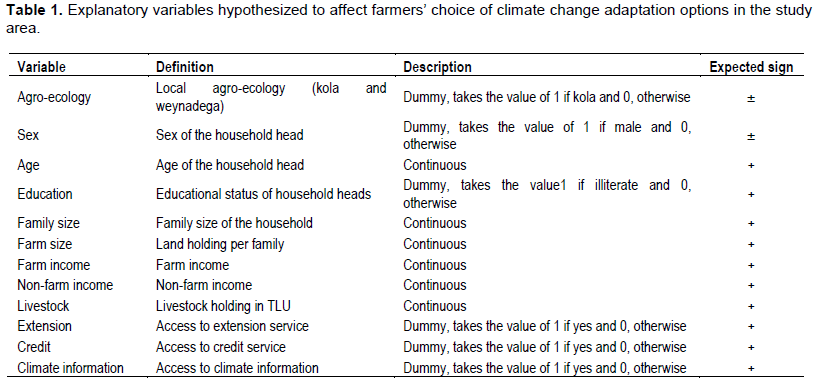
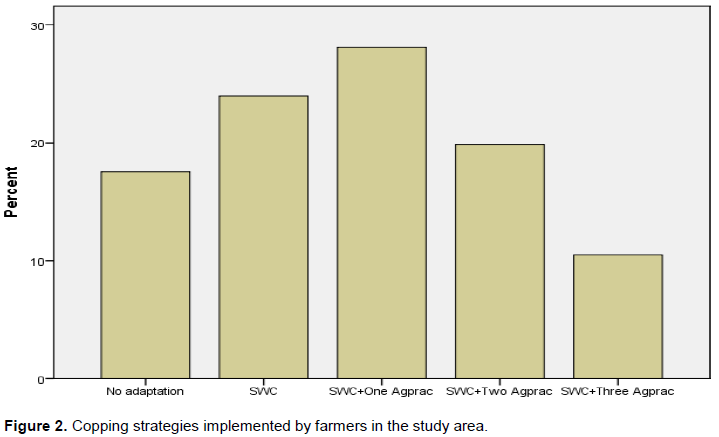
The dependent variable for MNL model used in this study was households’ choice of adaptation strategies against climate change stresses. The alternative climate change adaptation strategies include soil and water conservation (SWC) practice solely and SWC plus one agronomic practice, SWC plus two agronomic practices and SWC plus three agronomic practices. The agronomic practices include change in planting date, crop diversification and changing crop varieties). Farmers’ usually adopt more than one adaptation strategy at a time (Tessema et al., 2013). To apply MNL model, the dependent variable has to be defined in a way that ensures mutually exclusive outcomes. On the other hand, farmers’ choice of adaptation strategy is affected by the socio-economic characteristics, institutional, and agro-ecological setting of the households. Therefore, the hypothesized factors are discussed below and the description of each explanatory variable is given in Table 1.

The agro-ecology in which the household lives is expected to influence their choice of adaptation to climate change. In Ethiopia, areas categorized as kola (lowland, 500 to 1500 masl) are characterized by relatively hotter and drier climate whereas weynadega (middle land 1500 to 2500 masl.) and dega (highland, 2500 to 3500 m asl.) are wetter and cooler (Deressa et al., 2009). In this study, the sampled peasant associations fall under either kola or weynadega. Evidences revealed that farmers in drier and hotter climate are more likely to respond to climate change than farmers in cooler and wetter areas (Tesso et al., 2013). On the other hand, Deressa et al. (2009), Legesse et al. (2013) and Tessema et al. (2013) reported that farmers living in different agro-ecological settings have their own choice of adaptation methods. Deressa et al. (2009) observed that farming in the kola zone significantly increases the probability of soil and water conservation practices, compared to farming in weynadega. However, farming in kola significantly reduces the probability of using different crop varieties, planting trees, and irrigation as compared to farming in weynadega. Hence, agro-ecology was hypothesized to have a positive or negative effect on household’s adoption decision on climate change adaptation options.
Male-headed households in Ethiopia have been considered to have access to information, agricultural inputs, institutions and other attributes. Hence, they have a significant and positive influence on adoption of climate change adaptation strategies (Deressa et al., 2009; Legesse et al., 2013). Similarly, female-headed households in Ethiopia in general and in Eastern Hararghe in particular are expected to be less likely to adapt due to their limited access to land, information, inputs and institutions as a result of traditional social barriers (Wilson and Getnet, 2011). In contrast, Nhemachena and Hassan (2007) noted that female-headed households are more likely to adopt climate change adaptation methods. The authors argued that most agricultural operation in Africa is performed by female farmers that might give the opportunity to perceive the impact of climate change. This study followed the former argument which indicated that male headed households were more likely to use adaptation methods as they have more access to resources and information.
Adaptation to climate change is obtained from experience accumulated over time (Mutekwa, 2009). Similarly, farmers with more years of farming experience are more capable of assessing the available technologies and making adaptation decisions (Gbetibouo, 2009). Moreover, Deressa et al. (2009) and Tesso et al. (2012) also indicated that age of the household has a positive and significant effect on adopting climate change adaptation options. Experienced farmers are more likely to use one or more climate change adaptation strategies (Maddison, 2006). Thus, in this study, age was expected to affect climate change adaptation options positively.
Since adaptation to climate change is a response for understanding the issue and its long term consequences. In this regard, education could influence the rate of technology adoption by improving awareness. The more a farmer is educated, the more likely he/she is to access information, perceive and adapt to climate change (Maddison, 2007). Hence, a positive relationship between level of education and adaptation decisions is expected. Deressa et al. (2008) indicated that positive and significant effect of education on adopting the climate change adaptation methods is observed in Ethiopia. Similarly, Maddison (2006) noted experienced farmers are more likely to perceive climate change, but educated farmers are more likely to respond by making at least one adaptation. Hence, education was hypothesized to have a positive influence on the farmers’ decision to adopt one or more climate change adaptation options.
Increasing household income is reported to increase the probability of adopting climate change adaptations (Deressa et al., 2009; Lema and Mjule, 2009). This could be apparent that adaptation to climate change is capital intensive and hence increased income will encourage the investment capacity on adaptation options. Thus, this variable was hypothesized to have a positive influence on choice decision of the climate change adaptation options.
Taddesse (2011) and Tessema et al. (2013) showed that, farmers with large farm size have adopted one or a combination of climate change adaptation options as compared to the farmers with small land holdings. Moreover, Mulatu (2013) noted that households’ farm size is one of the most important factors that significantly affect farmers’ preferences for the adaptation strategies to climate change. Thus, farm size was hypothesized to have positive effect on adaptation to climate change.
Livestock is generally considered to be an asset that could be used either in the production process or be exchanged for cash or other productive assets. Deressa et al. (2009) and Taddesse (2011) also showed positive influence of livestock ownership on adoption of climate change adaptation options. Therefore, it was hypothesized that the livestock holdings of the household to affect climate change adaptation options positively.
Deressa et al. (2008) and Tesso et al. (2012) reported that access to credit has a positive and significant impact on the likelihood of using soil conservation, changing planting dates, and using irrigation. This result entails the important role of increased institutional support in promoting the use of adaptation options to reduce the negative impact of climate change. On the other hand, Legesse et al. (2013) and Tessema et al. (2013) noted insignificant effect of credit on the decision to adopt climate change adaptation options and even affecting negatively depending on the type of adaptation option. This study, however, hypothesized that there was a positive relationship between access to credit and climate change adaptation.
Extension services foster adaptation through enhancing farmers’ awareness of climate change and knowledge on adaptation measures (Falco et al., 2011; Nhemachena and Hassan, 2007). Deressa et al. (2008) also indicated that, access to extension showed positive and significant effect on adaptation of climate change. Similarly, Maddison (2006) reported that farmers who enjoy extension advice are likely to adapt climate change. Furthermore, he suggested that expansion of farmer training center and extension advice could hasten the effort to adapt climate change impacts. Hence, access to extension and climate information was hypothesized to have a positive relation with the household’s adoption decision on climate change adaptation options.
Farmers’ perception on temperature and precipitation trends, factors affecting farmers’ perception towards climate change, farmers’ perceived shocks and adaptation strategies, and determinants of climate change adaptation strategies are presented here.
Farmers’ perception about temperature and precipitation trends
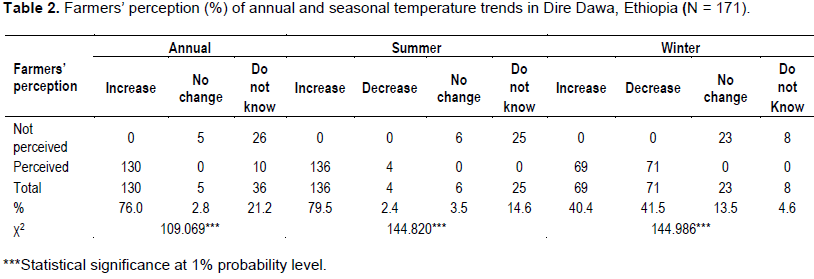
There are differences among sample farmers on how they perceive changes in temperature (Table 2).
The results revealed that, regardless of agro-ecology, most farmers perceived an increasing trend of mean annual (76.0%) and summer season (79.5%) temperatures. In line with this, Deressa et al. (2011), Mengistu (2011), Taddesse (2011) and Tessema et al. (2013) reported that most of the farmers in Ethiopia are aware of the fact that temperature is increasing. On the other hand, a chi-square test indicates that, there was a significant (p<0.01) difference between farmers in their perception of annual, summer, and winter season temperature (Table 2).
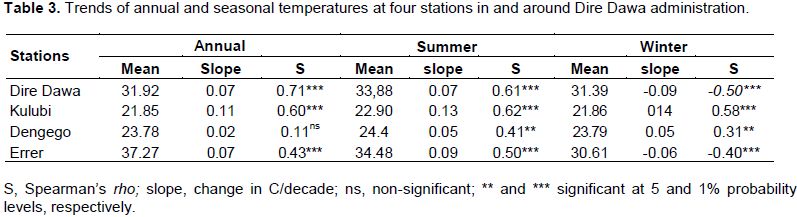
Analysis of historical temperature data (1980-2014) from the nearby observatory stations revealed that both annual and seasonal temperatures in the study areas show an increasing trend (Table 3). As a result, mean annual temperature has increased by 0.7, 1.1, 0.7 and 0.2°C per decade, respectively, at Dire Dawa, Kulubi and Errer stations significantly but non- significantly in Dengego station. In general, an increasing trend in temperature has been observed both during summer and winter seasons in all stations. Similarly, it was revealed that, over the past decade, average minimum and maximum temperatures of the country have increased by around 0.25 and 0.1°C respectively. Further, it is expected that in the year 2050, mean temperature will increase by 1.7 to 2.1°C (Tadege, 2007). Farmers’ perception on seasonal and mean annual temperature changes (Table 2) has been supported with observed meteorological data (Table 3). The perception of farmers’ on the increasing trend of annual and summer temperature was agreed with observed data at all stations. However, it is not consistent with the temperature records during the winter season at Kulubi and Dengego stations.
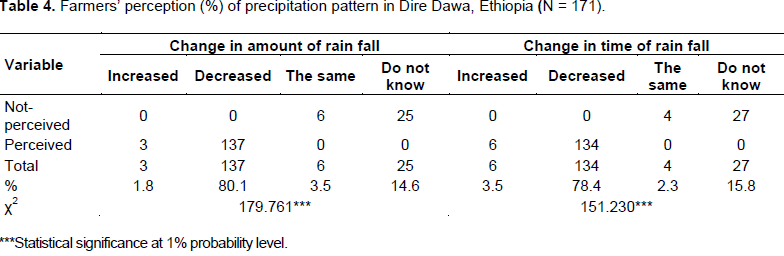
Similarly, there are differences among farmers in how they perceive changes in precipitation pattern (Table 4). The result indicates that, 80.1 and 78.4% of the farmers perceive a decrease in the amount and total days of precipitation respectively over the last 20 to 30 years; whereas 1.8 and 3.5% of the farmers replied an increase in the amount and total days of precipitation respectively. On the other hand, 14.6 and 15.8% of the farmers indicated that, they did not see an increase or decrease in the amount and total days of precipitation, rather its variable. In line with this result, Deressa et al. (2011) indicated that, high variability in precipitation was observed in the country over the last decade. A chi-square test result also indicated that there was a significant (p<0.01) difference between farmers in their perception on the patterns of precipitation.
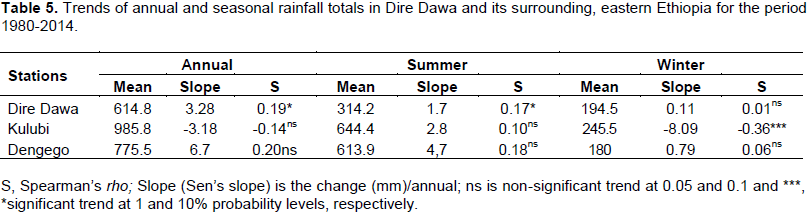
Here also, the analysis of historical precipitation data (1980-2014) from the nearby observatory stations revealed that both annual and seasonal precipitations in the study areas had no trend, except for Dire Dawa where only annual and summer (Main rain season) precipitations were found to have an increasing trend and Kulubi where a winter (Short rain season) precipitation was found to have a decreasing trend (Table 5). Farmers’ perception on seasonal and mean annual precipitation patterns (Table 4) has been supported with observed meteorological data (Table 5). The perception of farmers’ on the patterns of annual and summer precipitations was in line with the observed data at two stations (Kulubi and Dengego). However, it is not consistent with precipitation records of Dire Dawa station. This result is in line with the findings of Bewket and Conway (2007) and Ayalew et al. (2012) that reported the direction and magnitude of the trend in seasonal precipitation in Amhara regional state of Ethiopia varied from station to station.

The major driving factors that influence rainfall patterns in Ethiopia are the southern oscillation index and the sea surface temperature (SST) over the tropical eastern Pacific Ocean (Seleshi and Zanke, 2004). However, within the regions of Ethiopia, precipitation is governed with elevation (Conway, 2000).
Factors affecting farmers’ perception on climate change
Although there are differences among farmers in how they perceive change in temperature and precipitation (Tables 2 and 3), 140 (81.87%) of the interviewed households were found to perceive change in climate variables whereas 31 (18.13%) of the remaining households do not perceive change. On the other hand, the result presented in Table 6 shows that the average age of the household head that perceived change in climate was 41.70 years while those who did not perceive were 42.16 years. Age is considered as a proxy to the farming experience of the household, which is likely to have a significant influence on perception of climate change. The independent samples t-test showed non-significant difference in average age between households who perceived change in climate and those who did not.

The result also shows that the average household size was higher for the households who perceived climate change (6.13 individuals per household) than their counterpart (4.94 persons per household) (Table 6). The difference in mean family size between households who perceived change in climate and those who did not perceive change was statistically significant (p<0.01). This indicates that household size can influence adaptation because of its association with labor endowment. It is argued that a larger household size enables the adoption of technologies by availing the necessary labour force in one hand (Croppenstedt et al., 2003) and additional income from extra labor invested in off/non-farm activities (Yirga, 2007). Similarly, Deressa et al. (2009) and Tesso et al. (2012) reported that farmers with strong financial capacity had increased perception of climate change and respond to adapt its impact.
The result presented in Table 6 also indicates that households who perceive the existence of climate change have more number of economically active family members (3.685 persons per household), compared to the households who did not perceive climate change (3.024 persons per household) (Table 6). Moreover, the difference between the two groups was statistically significant (p<0.05). Increase in economically active family member might contribute to increased income of the family, resulted from non-farm engagements, which in turn improved financial capacity. Farmers with strong financial capacity had increased perception of climate change and respond to adapt its impact (Deressa et al., 2009; Tesso et al., 2012).
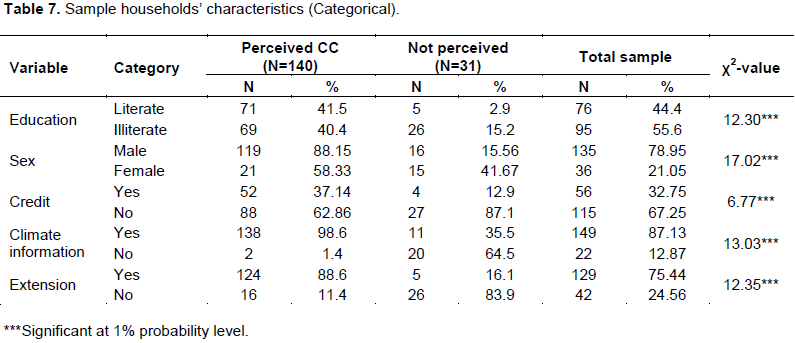
The result presented in Table 7 shows that, 55.6% of the interviewed households were illiterate and the rest (44.4%) were literate with a background ranging from reading and writing up to third cycle (grade 9-12). With regard to climate change perception, the chi-square test revealed that the difference between the illiterate and literate was statistically significant (p<0.01).
In this study, out of 171 respondents, 36 (21%) are female-headed while the rest 135 (79%) are male-headed households (Table 7). With regard to climate change perception, 88.15 and 58.33% of the respondents, respectively, in the male-headed and female-headed household had perceived the presence of climate change. The chi-square test also shows that the average difference between the two gender groups was statistically significant (p<0.01). This result supported the idea that male-headed households are often considered to be more likely to get information about climate change (Asfaw and Admassie, 2004).
Household wealth (land, livestock and income) highly influences adoption decisions of farmers (Deressa et al., 2009; Asfaw et al., 2011). Shortage of land is observed to be one of the major barriers in adaptation to climate change (Bryan et al., 2009; Maddison, 2007). The result in Table 6 revealed that, the mean farm size of those who perceived and did not perceived climate change was 1.067 and 0.625 ha, respectively. The independent
sample t-test also indicate that the average difference between the two group with respect to farm size was statistically significant (p<0.01)
The result in Table 6 also shows that, the mean livestock owned (TLU) by those who perceived and not perceived climate change were 6.52 and 4.13 TLU, respectively. The independent sample t-test also indicate that the average difference between the two group with respect to livestock owned was statistically significant (p<0.01).
The average farm income of the sample households for the year 2014 were 21497.86 and 12090.32 ETB, respectively, for those who perceived change in climate and those who did not perceive (Table 6). The result further revealed that the difference in mean income between the two groups was statistically significant (p<0.01). This implies that wealthier farmers are more likely to use their financial resources to acquire new technologies and are less risk-averse to experiment them. It is also argued that the more wealth a farmer has, the more likely he/she is to access information, credit and extension services (CIMMYT, 1998).
Similarly, the average non-farm income of the sample household for the year 2014 were 2055.00 and 4838.71 ETB, respectively, for those who perceived change in climate and those who did not perceive (Table 6). This result also revealed that the difference in mean income between the two groups was statistically significant (p<0.01). Farmers with higher non-farm income may be slow in taking more adaptation measures as non-farm activities by themselves act as adaptation measures.
On the other hand, availability of credit for resource poor farmers is quite important to finance agricultural technologies and management options that enable them to increase farm investment. Currently, the government and a private company known as Dire Micro Finance Institution are the major sources of credit in the study area.
Chi-square test was conducted to compare the percentage scores of households who perceived change in climate and who did not perceive with regard to the use of credit. The test statistics showed that, there was statistically significant (p<0.01) difference between the two groups (Table 7). Similarly, Tesso et al. (2012) noted that credit service was one of the most important factors affecting the perception of farmers to climate change.
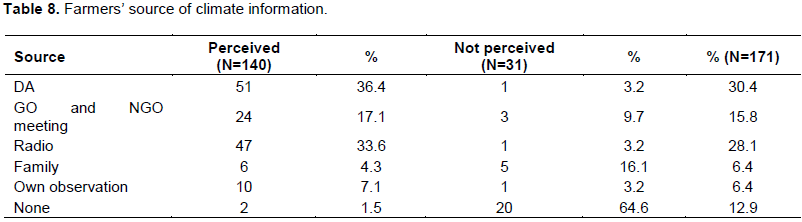
In this study, farmers were asked about their source of information on adaptation strategies, and the result showed that among farmers’ who perceived climate change, extension advice took the lion’s share (36.4%) followed by local radio program, which accounts for 33.6%, then comes government organization (Gn) and NGO meeting which account for 17.1% (Table 8). Furthermore, 7.1 and 4.3% of the sampled households used own observation and family experience and advice as a source of information for adaptation respectively. Results indicate the importance of extension services and local radio largely influencing farmers’ adaptation decisions. In addition, about 92.6% of the farmers who have access to climate information perceive change in climate while about 64.5% of the farmers who did not perceive change in climate had no access to climate information, while about 10% of the households who have no access to climate information perceived change in climate. Similarly, Conley and Udry (2001) reported that, farmers learn about new innovations from extension advice, from their own experimentation and from their neighbors' experimentation.

On the other hand, the percentage of sample households who perceived change in climate and those who did not perceive with respect to access to climate information showed significant difference (p<0.01) (Table 7).
The results in Table 7 also show that 129 (75.43%) of the sample households had access to agricultural extension services. Moreover, the result indicates that farmers’ perception was related to the use of agricultural extension service, as 124 (72.51%) of the households who perceived climate change has obtained extension service while those who did not perceive did not use agricultural extension service. The chi-square test also show that the difference in percentage scores between the households who perceive change in climate and those who did not perceive the change with respect to extension service was statistically significant (p<0.01). This result agrees with Falco et al. (2011) and Nhemachena and Hassan (2007) who reported that, extension services foster adaptation through enhancing farmers’ perception of climate change and knowledge on adaptation measures.
Farmers’ perceived shocks and adaptation strategies
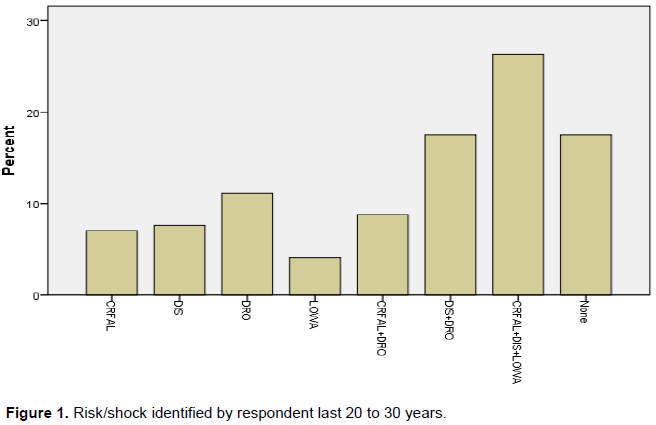
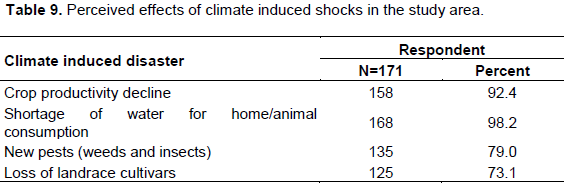
The surveyed households have encountered many types of environmental shocks such as crop failure, disease, drought, and lack of water for both human beings and animals solely and/or a combination of one or more of these shocks (Figure 1). The frequency distribution revealed that most of the interviewed households had recognized drought (11.1%) among the sole shocks and crop failure; disease and low water availability (26.3%) among combination. In line with this report, ILRI (2006) and ACCCA (2010) reported that, the country has suffered from at least five major national droughts since 1980, not mentioning numerous local droughts all over the country. In the years between 1999 and 2014 alone more than half of all households in the country faced at least one major drought. Most of the respondents (92.4%) perceived that these shocks have reduced crop production that resulted to food insecurity (Table 9). In line with this, Teka et al. (2012) reported that there was a general perception among rural households that crop and livestock production, and land productivity declined in the last 20 years.


Determinants of adaptation option
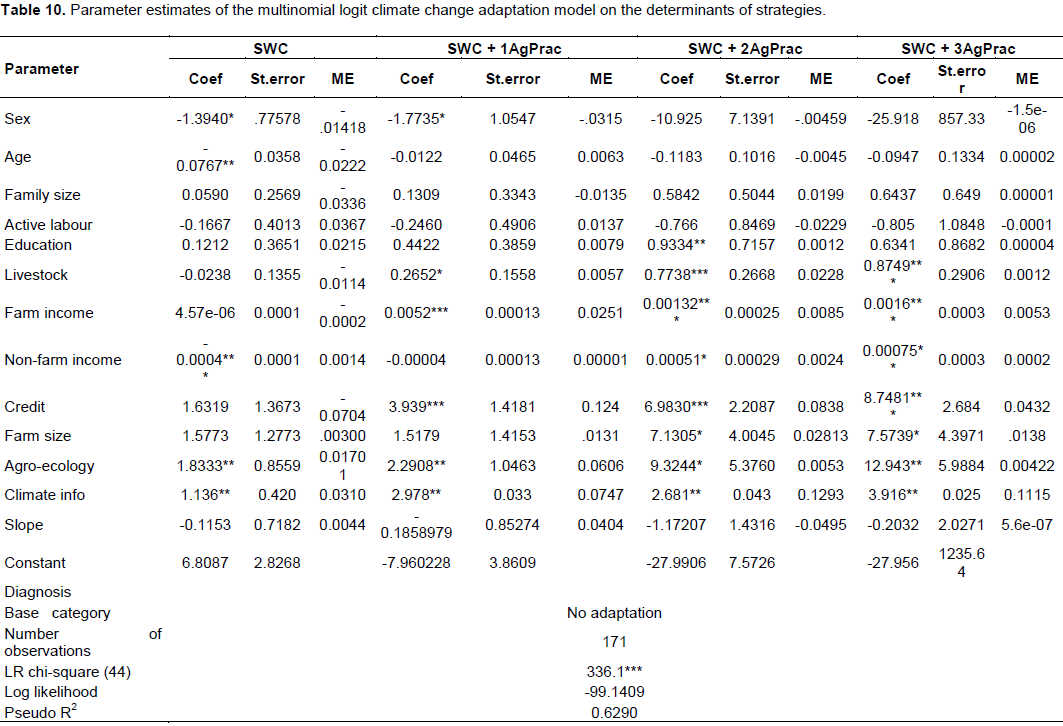
The multinomial Logit model was run and outcomes are compared with the models’ base category which is ‘no-adaptation’ (Table 10). An important assumption of the MNL is Independence of Irrelevant Alternatives (IIA) and the model was tested using the Hausman test to see if it fulfills this assumption. The Hausman test supported that IIA is not violated with χ2 ranging from -1.305 to 1.393 with probabilities almost equal to 1.0. To make sure that the explanatory variables do not cause a multicollinearity problem, auxiliary regression was fitted and VIF was calculated. All the VIF values are less than 10 (1.17- 3.48) indicating the absence of severe multicollinearity. Hence, all the hypothesized continuous and categorical explanatory variables were included in the model.

The parameter estimates of the MNL model provide only the direction of the effect of the independent variables on the dependent variables, but not the magnitude of change of its probability. Thus, marginal effects which measure the expected change in probability of a particular choice being made with respect to a unit change in an independent variable are calculated and presented in Table 10.
The MNL analysis result shows that, farm size, education of the household head, agro-ecology, livestock ownership, farm income, climate information and credit service positively and significantly influence using one or a combination of climate change adaptation strategies identified by farmers. On the other hand, sex and age of the household head and non-farm income were found to influence the adaption strategies noted by farmers negatively. The above mentioned variables that signifi-cantly influence climate change adaptation options are discussed here under.
Sex of the household head
As clearly indicated in Table 10, sex of the household head is one of the most important variable that significantly affect choice of climate change adaptation options. As can be seen from Table 10, being female headed household decreases the likelihood to use SWC solely, and SWC plus one agronomic practice as climate change adaptation strategies by 1.42 and 3.15%, respectively. This could be due to the fact that these strategies require labor and financial input than other strategies. This result goes with the argument that female-headed households in Ethiopia in general and in East Hararghe in particular are less likely to adapt due to their limited access to land, information, inputs and institutions as a result of traditional social barriers (Wilson and Getnet, 2011). Contrary to this result however, Nhemachena and Hassan (2007) found that female headed households are more likely to take up adaptation measures than male-headed households. On the other hand male headed households are reported to be more likely to get information about new technologies and involve in such business than female headed households (Asfaw and Admassie, 2004). Similarly, Deressa et al. (2009), Legesse et al. (2013) and Mulatu (2013) concluded that being male headed households increases significantly the ability and choice of households’ climate change coping strategies.
Age of the household head
Age of the household head, which is considered as a proxy indicator for farming experience, affects SWC adaptation strategy significantly and negatively. The result revealed that a unit increase in the age of the household head decreases the probability of adopting soil and water conservation practices by 3.2%. This might be related to the intensive labor requirement of soil and water conservation practices that might prohibit farmers’ from practicing it as they get older. In line with this result, Adesina and Baidu-Forson (1995) reported that more experienced or older farmers tend to be risk-averse and lag behind in adoption decisions. Whereas, Deressa et al. (2011) and Tesso et al. (2012) reported that age has a positive and significant influence on farmers’ adoption of less labour intensive adaptation strategies.
On the other hand, age of the household head was reported to have no effect on adopting climate change adaptation options by farmers in eastern Hararghe, Ethiopia (Legesse et al., 2013; Tessema et al., 2013). However, there is no final consensus on how age affects adoption decisions (Adesina and Baidu-Forson, 1995).
Education
Education of the household head was found to have increased the probability of adopting climate change adaption options. The result showed that, education of a household head positively and significantly influences adoption of climate change adaptation options, and further indicated that, an increase in the level of education was associated with an increase in the adoption of SWC plus two agronomic practices as a climate change adaptation option by 0.12%. This might be because of the fact that farmers’ with higher education are likely to have more information on climate change, which in turn might promote the probability of adopting this adaptation strategy. Furthermore, education is likely to enhance farmers’ ability to receive, interpret and comprehend information needed to make innovative decisions in their farms (Maddison, 2007; Ndambiri et al., 2013). This result is in line with that of Deressa et al. (2009) and Tesso et al. (2012) who reported positive and significant effect of education on adopting climate change adaptation measures in Ethiopia. In contrast, Mulatu (2013) reported negative relationship between education and choice of adaptation options.
Agro-ecology
The result obtained from the multinomial logit Model indicated that farming in kola significantly increased the probability of using SWC solely and SWC plus one, two and three agronomic practices as adaptation options to climate change by 1.7, 6.06, 0.53 and 0.42%, respectively. In line with this, Deressa et al. (2009), Tesso et al. (2012) and Legesse et al. (2013) also found that farmers living in different agro ecology have different choices of adaptation options to climate change impact. The report further indicated that farming in kola increases the probability of using soil and water conservation and water harvesting practices as adaptation options, compared to dega or weynadega. On the other hand, farming in kola has been reported to significantly reduce the probability of diversifying crop varieties, planting trees, and irrigation by 21, 13 and 2.3%, respectively, compared with farming in weynadega (Deressa et al., 2009). The report further indicated that, farmers in drier and hotter climate are more likely to respond to climate change than farmers in cooler and wetter areas.
Livestock holding
The total number of livestock owned by the household measured in TLU had a positive and significant influence on the adoption of diversified climate change adaptation options. The result indicated that the TLU possessed by a household significantly increased the probability of using SWC plus one, two, and three agronomic practices as adaptation options by .57, 2.28 and 0.12%,respectively.In line with this result, Deressa et al. (2009) and Asfaw et al. (2011) reported that livestock ownership facilitate adoption of improved technologies. Livestock is generally considered to be an asset that could be used either in production process or be exchanged for cash or other productive asset, hence have a significant role in adopting suitable adaptation measure to combat climate change (Yirga, 2007).
Farm income
This variable had positive and significant influence in adopting climate change adaptation options. The result revealed that increasing farm income increases the probability of using SWC plus one, two, and three agronomic practices as a climate change adaptation strategy by 2.51, 0.85 and 0.53%, respectively. The positive impact of farm income on climate change adaptation options could be associated to the fact that farmers with better financial capacity are more risk averse to crop production, have access to information and longer planning horizon (Deressa et al., 2008). Mulatu (2013) also showed that increase in farm income of the household increases the likelihood of adapting to climate change using soil conservation, irrigation and livestock production. This could be apparent that adaptation to climate change is capital intensive and hence increased income would encourage the investment capacity on adaptation.
Credit service
Access to credit service also plays a positive role for farmers to adopt climate change adaptation options. The result revealed that increased access to credit is likely to increase the probability of the household to implement SWC plus one, two, and three agronomic practices as climate change adaptation strategy by 12.4, 8.38 and 4.32% respectively. As is already known, implementing SWC and different agronomic practices are one of the most effective climate change adaptation strategies. However, it also requires capital investment, which most of ordinary households could not afford. Therefore, leveraging the cash shortage of households through credit might encourage farmers’ to engage in the above mentioned practices. Deressa et al. (2008, 2009) and Tesso et al. (2012) also noted that increase in credit access significantly enhanced the farmers’ choice of climate change adaptation strategies. In contrast, Tessema et al. (2013) reported that credit access has negative influence of the probability of using tree planting as climate change adaptation option.
Farm size
This variable had positive and significant influence in adopting climate change adaptation options. The result revealed that increasing farm size increased the probability of using SWC plus two and three agronomic practices as climate change adaptation strategy by 2.81 and 1.38% respectively. In line with this result, Taddesse (2011) and Tessema et al. (2013) also showed that farmers with large farm size have adopted one or a combination of climate change adaptation options as compared to the farmers with small land holdings. Moreover, Mulatu (2013) noted that households’ farm size is one of the most important factors that significantly affect farmers’ preferences for the adaptation strategies to climate change.
Non-farm income
This variable had negative and significant influence in adopting climate change adaptation options. The result revealed that increasing off/non-farm income decreased the probability of using SWC, SWC plus two and three agronomic practices as climate change adaptation strategy by 1.4, 0.24 and 0.02%, respectively. In line with this result, Tessema et al. (2013) showed that, off/non-farm income was found to have a negative relationship with adaptation by employing tree planting with other measures. The report further explained that, enterprise diversification or risk reduction effect of non-farm income which may reduce the importance of urgent adaptation measures. In other words, the existence of non-farm income serves as an adaptation measure by itself and may delay other responses.
Climate information
Access to climate information significantly increased the probability of using SWC, SWC plus one agronomic practice, SWC plus two agronomic practices, and SWC plus three agronomic practices, by 3.1, 7.5, 12.9 and 11.15%, respectively (Table 10). This result implies the important role of increased institutional support in promoting the use of climate change adaptation options to reduce the negative impact of climate change. This result is in line with the finding of Mulatu (2013) who showed that an increase in access to climate information increases farmers’ likelihood to prefer crop diversification and change in planting date as climate change adaptation options. Moreover, Deressa et al. (2009) noted that information on temperature and rainfall has a significant and positive impact on the probability of using different crop varieties by 17.6%.
CONCLUSION AND RECOMMENDATIONS
This study was carried out in Dire Dawa Administration, Eastern Ethiopia where 171 farm households were randomly selected for the study. Out of the interviewed households, 140 (81.87%) of the farm households observed at least one type of climate change over the last 20 years primarily based on their life experience. This study has tried to relate the trend of mean annual and seasonal temperature records with the perception of farmers’ at a local scale. The result showed that during the last half a century, annual and seasonal temperatures had significantly increased; with the varying magnitude and rate. The results revealed that, regardless of agro-ecological settings, most of the households had perceived an increasing trend of mean annual (77.2%) and summer season (81.2%) temperatures. Similarly, 82.5 and 80.1% of the households perceived a decrease in the amount and time of precipitation respectively over the last 20 to 30 years.
The result also indicated that most of the surveyed households in the Administration perceive drought as the major climatic hazard that threatens their livelihood. Moreover, due to climate change, they believed that water used for home or animal consumption has been constrained; crop productivity has been declining, loss of landrace cultivars as well as the appearance of new pests, were all challenging the food security. On the other hand, this households indicated that they undertake soil and water conservation solely, or in combination with crop diversification, change in crop type and change in planting date as adaptation options to counteract the negative impact of climate change.
As MNL model was fitted to proportion of household in different adaptation categories where the choices of adaptation to climate change is the dependent variable. Different socioeconomic, institutional and agro-ecological variables were hypothesized to influence adaptation decisions and were included in the model. The results from the MNL analysis indicate that sex and age of the household head, agro-ecology, farm size, education and climate information of the households head, farm and non-farm income, access to credit, and livestock ownership of the household were found to have significant impact on the choice of adaptation options that enable to combat climate change stresses. Based on the results of the study the following policy options are suggested.
1. Investing on education and technological packages that enhance farm income for the rural community can be sought as a policy options that will reduce the negative impact of climate change;
2. An effort that improves farmers’ awareness on better production techniques, climate change and access to credit, which enhance the capacity to adopt climate resilience adaptation options, is an important policy measure that should be considered,
3. Research and development has to be proactive and focus on developing/adapting crop/livestock varieties resistant to the expected climate variability and identify technology best fitted for each farm size,
4. Future policy options need to fine-tune sex, age and agro-ecological settings with climate change adaptation options/technologies.
The authors have not declared any conflict of interests.
REFERENCES
|
ACCCA (Advancing Capacity to Support Climate Change) (2010). Farm level climate change perception and adaptation in drought prone areas of Tigray, Northern Ethiopia. Improving decision making capacity of smallholder farmers in response to climate risk adaptation in three drought prone districts of Tigray, northern Ethiopia, Vol. 3.
|
|
|
|
Adesina AA, Baidu J (1995). Farmers' perceptions and adoption of new agricultural technology: evidence from analysis in Burkina Faso and Guinea, West Africa. Agric. Econ. 13:1-9.
Crossref
|
|
|
|
|
Asfaw A, Admassie A (2004). The role of education on the adoption of chemical fertilizer under different socioeconomic environments in Ethiopia. Agric. Econ. 30:21-22.
Crossref
|
|
|
|
|
Asfaw S, Shiferaw B, Simtowe F, Haile MG (2011). Agricultural technology adoption, seed access constraints and commercialization in Ethiopia. J. Dev. Agric. Econ. 3(9):436-447.
|
|
|
|
|
Ayalew D, Tesfaye K, Mamo G, Yitaferu B, Bayu W (2012). Variability of rainfall and its current trend in Amhara region, Ethiopia. Afr. J. Agric. Res. 7(10)1475-1486.
|
|
|
|
|
Bewket W, Conway D (2007). A note on the temporal and spatial variability of rainfall in the drought prone Amhara region of Ethiopia. Int. J. Climatol. 27:1467-1477.
Crossref
|
|
|
|
|
BOARD (Bureau of Agricultural and rural Development) (2009). Annual report. Dire Dawa.
|
|
|
|
|
Bryan E, Deressa TT, Gbetibouo GA, Ringler C (2009). Adaptation to climate change in Ethiopia and South Africa: options and constraints. Environ. Sci. Policy 12:413-426.
Crossref
|
|
|
|
|
CIMMYT (1998). The adoption of agricultural technology: A Guide for Survey Design. CIMMYT, Mexico, DF.
|
|
|
|
|
Conley T, Udry C (2001). Social learning through networks: The adoption of new agricultural technologies in Ghana. Am. J. Agric. Econ. 83:668-673.
Crossref
|
|
|
|
|
Conway D (2000). Some aspects of climate variability in the northeast Ethiopian highlands-Wollo and Tigray. SINET: Ethiop. J. Sci. 23(2):139-161.
|
|
|
|
|
Conway D, Schipper ELF (2011). Adaptation to climate change in Africa: challenges and opportunities identified from Ethiopia. Global Environ. Change 21:227-237.
Crossref
|
|
|
|
|
Croppenstedt A, Demeke M, Meschi MM (2003). Technology adoption in the presence of constraints: the case of fertilizer demand in Ethiopia. Dev. Econ. 7(1):58-70.
Crossref
|
|
|
|
|
CSA (Central Statistics Authority) (2007). The Federal Democratic Republic of Ethiopia Statistical abstract for 2003. CSA, Addis Ababa.
|
|
|
|
|
Deressa TT, Hassan RM, Ringler C (2008). Measuring Ethiopian farmers' vulnerability to climate change across Regional States. IFPRI discussion paper 00806, October 2008.
|
|
|
|
|
Deressa TT, Hassan RM, Ringler C (2011). Perception of and adaptation to climate change by farmers in the Nile basin of Ethiopia. J. Agric. Sci. 149(1):23-31.
Crossref
|
|
|
|
|
Deressa TT, Hassan RM, Ringler C, Alemu T, Yusuf M (2009).Determinants of farmers' choice of adaptation methods to climate change in the Nile Basin of Ethiopia. Global Environ. Change 19(2)248-255.
Crossref
|
|
|
|
|
Falco SD, Yesuf M, Kohlin G (2011). What adaptation to climate change? Evidence from the Nile Basin, Ethiopia. In: International conference on economics of adaptation to climate change in Low-Income countries. Ethiopian Development Research Institute and International Food Policy Research Institute, Washington, DC.
|
|
|
|
|
Fosu-Mensah BY, Vlek PL, MacCarthy DS (2012). Farmers' perception and adaptation to climate change: a case study of Sekyedumase district in Ghana. Environ. Dev. Sustain. 14(4):495-505.
Crossref
|
|
|
|
|
Gbetibouo GA (2009). Understanding farmers' perceptions and adaptations to climate change and variability: The Case of the Limpopo Basin, South Africa (Trans: Division EaPT). IFPRI–wide Discussion Paper. International Food Policy Research Institute, South Africa.
|
|
|
|
|
Gujarati DN (1995). Basic econometrics. 3rd ed. McGraw-Hall, Inc. 534p.
|
|
|
|
|
Hassan R, Nhemachena C (2008). Determinants of African farmers' strategies for adapting to climate change: Multinomial choice analysis. Afr. J. Agric. 2(1):84-104.
|
|
|
|
|
IDP (Integrated Development Plan) (2006). Annual report. Dire Dawa.
|
|
|
|
|
ILRI (International Livestock Research Institute) (2006). Mapping climate vulnerability and poverty in Africa. Int. Livest. Res. Institute, Nairobi, Kenya.
|
|
|
|
|
IPCC (Intergovernmental Panel on Climate Change) (2007). Climate change 2007: Synthesis report. Contribution of Working Groups I, II and III to the Fourth Assessment Report of the Intergovernmental Panel on Climate Change. Core Writing Team, Pachauri RK. Reisinger A (eds.). IPCC, Geneva, Switzerland. 104p.
|
|
|
|
|
Ishaya S, Abaje IB (2008). Indigenous people's perception on climate change and adaptation strategies in Jema'a local government area of Kaduna State, Nigeria. J. Geogr. Regional Plann. 1(8):138-143.
|
|
|
|
|
Komba C, Muchapondwa E (2012). Adaptation to climate change by smallholder farmers in Tanzania. Econ. Res. Southern Afr. (ERSA) working paper 299:5.
|
|
|
|
|
Lautze S, Aklilu Y, Raven-Roberts A, Young H, Kebede G, Leaning J (2003). Risk and vulnerability in Ethiopia: Learning from the past, responding to the present. Preparing for the future, Addis Ababa.
|
|
|
|
|
Legesse B, Ayele Y, Bewket W (2013). Smallholder farmers' perceptions and adaptation to climate variability and climate change in Doba district, west Hararghe, Ethiopia. Asian J. Empirical Res. 3(3)251-265.
|
|
|
|
|
Lema M, Majule AA (2009). Impacts of climate change, variability and adaptation strategies on agriculture in semi arid areas of Tanzania: The case of Manyoni district in Singida region, Tanzania. Afr. J. Environ. Sci. Technol. 3(8):206-218.
|
|
|
|
|
Long JS, Freese J (2001). Regression Models for Categorical Dependent Variables Using Stata. A Stata Press Publication, STATA Corporation, College Station, Texas
|
|
|
|
|
Maddison D (2006). The perception and adaptation to climate change in Africa. CEEPA Discussion Paper No. 10, Centre Environ. Econ. Policy Afr. University of Pretoria.
|
|
|
|
|
Maddison D (2007). The perception of an adaptation to climate change in Africa. Policy research working paper. The World Bank, Dev. Res. Group, Sustain. Rural Urban Dev. Team, Pretoria, South Africa.
Crossref
|
|
|
|
|
Mengistu DK (2011). Farmers' perception and knowledge of climate change and their coping strategies to the related hazards: Case study from Adiha, central Tigray, Ethiopia. Agric. Sci. 2(2):138-145.
Crossref
|
|
|
|
|
Mulatu ND (2013). Determinants of farmers' preference for adaptation strategies to climate change: evidence from north Shoa zone of Amhara region Ethiopia. MPRA (Munich Personal RePEc Archive) Paper No. (48753)
|
|
|
|
|
Mutekwa VT (2009). Climate change impacts and adaptation in the agricultural sector: the case of smallholder farmers in Zimbabwe. J. Sustain. Dev. Afr. 2(11):237-257.
|
|
|
|
|
Ndambiri HK, Ritho CN, Mbogoh SG (2013). An evaluation of farmers' perceptions and adaptation to the effects of climate change in Kenya. Int. J. Food Agric. Econ. 1(1):75-96.Nhemachena C, Hassan R (2007). Micro level analysis of farmers' adaptation to climate change in Southern Africa. IFPRI Discussion Paper 00714 August 2007.
|
|
|
|
|
Oxfam (2010). The rain doesn't come on time any more: poverty, vulnerability and climate variability in Ethiopia. Edossa R, Givey SC, Castillo GE. 45p.
|
|
|
|
|
Sahu NC, Mishra D (2013). Analysis of perception and adaptability strategies of the farmers to climate change in Odisha, India. Apcbee Procedia 5:123-127.
Crossref
|
|
|
|
|
Seleshi Y, Zanke U (2004). Recent changes in rainfall and rainy days in Ethiopia. Int. J. Climatol. 2(4):973-983.
Crossref
|
|
|
|
|
Smith B, Pilifosova O (2001). Adaptation to climate change in the context of sustainable development and equity. Contribution of the Working Group to the Third Assessment Report of the Intergovernmental Panel on Climate Change. Cambridge University Press, Cambridge, UK. pp. 879-912.
|
|
|
|
|
Strzepek K, Mccluskey A (2006). District level hydro-climatic time series and scenario analysis to assess the impacts of climate change on regional water resources and agriculture in Africa. CEEPA Discussion Paper No. 13, Pretoria, South Africa.
|
|
|
|
|
Taddesse T (2011). Farmers' perception and adaptation mechanisms to climate change and variability: the case of La'ilay Maichew woreda, central Tigray, Ethiopia. An MSc Thesis Presented to the School of Graduate Studies of Haramaya University.
|
|
|
|
|
Tadege A (2007). Climate Change National Adaptation Program of Action (NAPA) of Ethiopia. NMS (National Meteorological Agency), Addis Ababa Federal Democratic Republic of Ethiopia Addis Ababa.
|
|
|
|
|
Teka K, Van RA, Poesen J, Welday Y, Deckers J (2012). Impact of climate change on small holder farming: A case of eastern Tigray, northern Ethiopia. Afr. Crop Sci. J. 20(2):337-347.
|
|
|
|
|
Tessema YA, Aweke CS, Endris GS (2013). Understanding the process of adaptation to climate change by small-holder farmers: the case of east Hararghe Zone, Ethiopia. Agric. Food Econ. 1:13.
Crossref
|
|
|
|
|
Tesso G, Emana B, Ketema M (2012). Econometric analysis of local level perception, adaptation and coping strategies to climate change induced shocks in North Shewa, Ethiopia. Int. Res. J. Agric. Sci. Soil Sci. 2(8):347-363.
|
|
|
|
|
Wilson K, Getnet M (2011). Investigating how development interventions increase community level adaptive capacity in Ethiopia. In the New Voices, Different Perspectives: Proceedings of the Africa Adapt Climate Change Symposium 2011. Addis Ababa, Ethiopia.
|
|
|
|
|
Yirga CT (2007). The dynamics of soil degradation and incentives for optimal management in Central Highlands of Ethiopia. University of Pretoria, Pretoria, South Africa.
|
|