Ofam is a Ghanaian indigenous cakelike product produced mainly from senescent plantain, which is taken as a snack or as an accompaniment to a main meal. Senescent plantain puree or paste, flour and unrefined palm oil are homogenously mixed into a batter and subsequently baked to make ofam. Other optional ingredients such as onion, ginger, African pepper, calabash nutmeg and cayenne pepper may be added as flavour and taste enhancers. These flavour and taste enhancers improves consumers acceptability of the product (Adi et al., 2019). There are variations in the preparation of this indigenous cakelike product across different ethnic backgrounds and hence the different derivatives (Adi et al., 2018). The use of senescent plantain for these products contributes to value addition of the already deteriorating commodity (Flore et al., 2013; Severin et al., 2013).
Senescent plantain and flour form the most substantial ingredients in the ofam recipe, and they considerably influence the texture of the product. The most commonly used flours for ofam and other senescent plantain products have been cassava flour (kokonte), roasted corn flour and steeped corn flour (Adi et al., 2018). Flour provides the structural matrix around which all the other ingredients are mixed to form a dough or batter in baked foods. The texture, appearance and even shelf-life of flour products are influenced by the type of flour and the nature of starch present in the flour (Gallagher et al., 2003, 2004; Marston et al., 2016; Niba, 2005). These attributes are also influenced by the presence of fat. In addition to its flavour enhancing properties, fat provides tenderness to most baked goods. An adequate amount is essential to prevent product dryness or sogginess (Agrahar?Murugkar et al., 2016).
Baking is associated with heat transformation of dough or batter (which contains flour) into a unique food product with special sensory characteristics (Mondal and Datta, 2008). This complex process results in a series of physical, chemical and biochemical changes in food as the gelatinization of starch, denaturation of protein, liberation of carbon dioxide from leavening agents, volume expansion, evaporation of water, crust formation and browning which contribute to the quality of the finished product (Sumnu, 2001; Yolacaner et al., 2017). Browning reactions such as caramelization and Maillard reaction are a non-enzymatic chemical reactions resulting in coloured and flavour compounds formation during baking (Fennema, 1996; Purlis, 2010).
According to Nashat and Abdullah (2016), sensory quality attributes which influence consumer preference for baked goods are the external or crumb colour, texture and flavour. In a consumer study on senescent plantain products, sensory quality attributes such as taste, appearance, texture and aroma were identified as the indicators of product acceptability. These quality attributes are influenced by the constituents of the baked product. During ofam preparation, the variation in the type and quantity of flour used is expected to affect its colour, flavour, texture and ultimately its sensory acceptability. However, there is no study to elucidate these. Establishing these baseline data is required for product standardization and commercialisation.
Therefore, this study was aimed at evaluating the effect of different flour types and flour concentrations on the physicochemical characteristics of ofam batter and baked ofam and also to evaluates the sensory acceptability of the baked products.
Raw material preparation
Matured plantain at ripening stage 1 was harvested at JE Farms in Mankessim (Central Region, Ghana). The plantain was de-handed and kept on a bench in a room at ambient temperature (27 ± 2°C) and allowed to ripen to stage 7 (at the onset of senescence) for processing. At ripening stage 7, the plantains were washed, peeled packaged in Ziploc bags (in 1.0 kg portions) and kept frozen for further use. Frozen senescent plantain pulp was allowed to thaw in an ice chest overnight. The thawed senescent plantain was milled into a puree using a Philips Food Processor (hr7761/00, Brighouse, UK). The puree was used for the batter preparation and subsequent baking.
Ofam batter preparation and baking
A total of fifteen ofam batters were prepared for this study. The batter preparation and subsequent baking followed a 3 × 5 design, where three different flour types (kokonte (KF), steeped corn flour (SCF) and roasted corn flour (RCF)) were used as binders at five different concentration. The flour concentrations were generated by the Minitab software (version14) using a lower limit of 10% and an upper limit of 20% with two midpoints to obtain flour concentrations of 20, 17.5, 15 12.5, and 10% for all three different flour types. All other ingredients were kept constant for all fifteen samples (Table 1).
Ofam samples were prepared as described by Adi et al. (2018). Batter samples were prepared in 1.0 kg portions. A weighed amount of senescent plantain puree was mixed with a weighed amount of flour depending on the sample. Every 1.0 kg portion of batter was mixed with 50 g onion powder, 4.0 g African pepper, 0.5 g calabash nutmeg, 15 g cayenne pepper powder and 15 g ginger powder. Unrefined palm oil (100 mL) was added to the mixture and stirred with a wooden spatula to form a homogenous mixture. The batter was transferred into a greased aluminium loaf pan (305 × 105 × 70 mm), and baked in a preheated Ariston electric oven (C522E EX, Fabriano, Italy) at 170°C for 90 to 110 min (Figure 1).
Physicochemical analysis of ofam batter and baked ofam
Moisture content of ofam batter
The moisture content of ofam batter was determined by drying 2 g of samples at 105°C for 6 h (AOAC method 925.10).
pH of batter and total soluble solids
A measured amount (10 g) of the batter was mixed with 100 mL of distilled water and held for at least 30 min at room temperature and then filtered. The filtrate was used to determine the pH using pH meter (Corning 240, New York 14831, USA) and the °Brix of the samples using a hand-held refractometer (r2 mini, Reichert Inc., Japan) (Kirk and Sawyer, 1991).
Batter viscosity
Batter viscosity was measured using a Brookfield RVDV-2T Viscometer (Brookfield Engineering Laboratories, Middleboro, MA, USA), with the guard leg detached. Viscosity was measured using 220 ± 1 g of ofam batter in a 250 mL glass beaker at ambient temperature (27 ± 2°C). In determining the viscosity of the batter, a flow profile was obtained (at different spindle speeds of 40 rpm, 60 rpm and 80 rpm for a period of 30 min for each speed) as proposed by Dikeman and Fahey (2006), Reppas et al. (1999) and Schemann and Ehrlein (1986)for non-Newtonian fluids. The viscometer was set to measure viscosity every 5 min, and the average speed was calculated for each spindle speed. A 07-spindle size was used for the study and three measurements were taken for each batter sample.
Texture profile analysis of ofam
Texture profile analysis (TPA) of baked ofam samples were evaluated by the method described by Agrahar?Murugkar et al. (2016)with slight modifications, using the Stable Micro Systems texture analyser (TA-XT plus - 13051, Surrey, UK). A two-bite compression test was performed on samples of height 30 mm after a size 15 cork borer (22.5 mm outside diameter) was used to obtain cylindrical-shaped samples from the baked product. The analysis was done at a test speed of 5 mm/s, pre-test speed of 1 mm/s, post-test speed of 5 mm/s and a deformation of 75% using an aluminium cylindrical probe of 75 mm diameter. Data acquisition rate was at 200 pps. Using the exponent software, the measurements for hardness, fracturability, adhesiveness, springiness, cohesiveness, gumminess, chewiness and resilience were obtained.
Colour analysis of batter and ofam
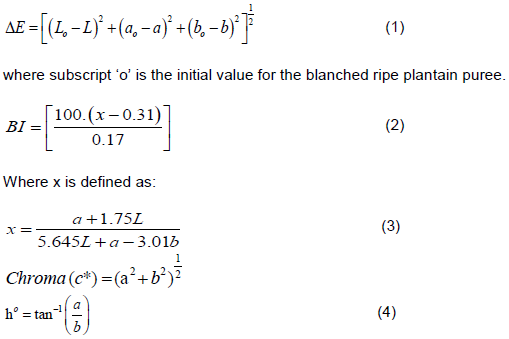
The colours of ofam batters and baked ofam samples were measured by a CR-300 Chromameter (Konica Minolta CR series, NJ 07446, USA). The CIE L, a, b colour system was used to measure the colour (MacDougall, 2010). Measurements were taken in triplicate and their mean values were used to represent the colour values of the samples. The total colour difference ( ) for each baked sample was calculated using the colour of their respective batters as a reference point. The values for the Browning index, Chroma and the Hue angle of the batter and ofam were then calculated using the following expression:
Consumer acceptance test
Fifty untrained panellists participated in this study. They were made up of students and staff at the Food Research Institute (FRI) of the Council for Scientific and Industrial Research (CSIR). The evaluation was carried out in CSIR-FRI designated sensory laboratory which conforms to ISO 8589 standard. The criteria for recruitment were as follows:
(a) The panellists were older than 18 years;
(b) They were non-smokers;
(c) They had no allergies to any of the ingredients used in the preparation of ofam (that is, plantain, onion, ginger cayenne pepper, calabash nutmeg, African pepper, kokonte, steeped corn flour and roasted corn flour);
(d) They were willing and available to participate in the study.
Panellists were presented with three-digit coded samples. The codes were generated using XLSTATS version 2014 following a randomised design matrix. They were also served with plain crackers (unsalted) for palette cleansing and water to rinse their mouths in between samples. Each panellist evaluated 5 samples per day for appearance, external or crust colour, internal crumb colour, aroma, oiliness, hardness, stickiness, smoothness, sweetness, spiciness, flavour and overall acceptability on a 9-point Hedonic scale (1 represents dislike extremely, 5 represents neither like nor dislike, 9 represents like extremely) (Stone and Sidel, 2004).
Data analysis
Data were subjected to analysis of variance (ANOVA) using Statgraphics (Centurion XVI). Significantly different means were separated using Duncan’s Multiple Range Test (DMRT) 5% significance level. Principal component analysis (PCA) was use to visualise the effect of flour types and concentrations on the sensory attributes of ofam. Graphical representation was by Microsoft Excel.
Moisture content of ofam batter
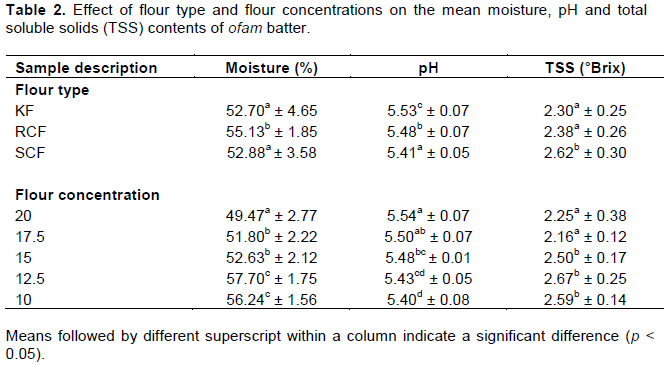
The mean moisture contents of the batters were 52.7, 52.9 and 55.1% for ofam mixture containing kokonte flour (KF), steeped corn flour (SCF) and roasted corn flour (RCF), respectively (Table 2). An insignificant variation in moisture contents for the different flour types was observed (p > 0.05). However, there were significant differences (p < 0.05) in moisture contents in the ofam as flour concentrations were varied. Generally, the batter moisture content decreased with increasing flour concentration. The mean moisture contents of the batter ranged from 56.2 to 49.5% for batter with flour inclusions at 10 and 20%, respectively. According to Zhou et al. (2014)moisture content of batters influences the quality, texture, volume, taste, aroma, flavour and mouthfeel of bakery products. These sensory attributes are influenced by moisture dependent reactions as gelatinization and Maillard reaction. The reduction of the batter moisture with increasing levels of flour inclusion may be attributed to the increasing concentration of hydrophilic sites such as starches and proteins which bind to the free water in the batter.
Ofam batter pH
The pH of the batter was influenced significantly by both the type of flour and its concentration (p < 0.05). Batter containing KF recorded the highest mean pH of 5.53 while the SCF containing batter recorded the lowest pH of 5.41. Also, mean batter pH ranging between 5.4 and 5.5 was recorded for batter samples with 10 and 20% flour concentrations, respectively (Table 2).
The taste of a cake is affected by its batter pH. Cakes with low pH levels would have an acidic sour flavour, whereas cakes with high pH will exhibit a soapy taste and a coarse texture. Generally, cakes have relatively high pH (6.5 - 7.5) owing to the presence of baking powder (sodium bicarbonate) acting as a leavening agent as observed by Masoodi et al. (2002).
Total soluble solids of batter (TSS)
The total soluble solids of a sample is indicative of the dissolved solids in the sample and its sweetness (Magwaza and Opara, 2015). The total soluble solids of the batter samples were influenced by both flour type and concentration. Batter containing SCF recorded the highest TSS of 2.62°Brix while KF batter recorded the lowest TSS value of 2.30°Brix. The SCF batter might be perceived to be sweeter than KF batter. This trend suggests that the flours contributed little in terms of TSS. As a result, the sweetness could be attributed largely to the ripe plantain used in the product. Generally, the batter TSS decreased with increasing flour concentration. Ofam batter samples containing 17.5% of flour had the least TSS value of 2.16°Brix. However, there was no statistical significance when compared with batter samples containing 20% flour (2.25°Brix). The highest mean TSS value of 2.59°rix was obtained for batter samples with 10% flour incorporation. The presence of soluble solids especially sugars in bakery products (cake) has been reported to increase gelatinization temperature, resulting in a tenderizing effect on the final product (Mariotti and Lucisano, 2014; Psimouli and Oreopoulou, 2012). The sugars may also influence the colour and aroma of the final product through Maillard reaction and Caramelization (Fennema, 1996; Purlis, 2010). The presence of the sugars also provides humectancy to the product and regulates the product’s uptake and loss of water.
Colour characteristics of batter and baked ofam
The data for colour are presented in Table 3. The L value for the batter samples varied significantly with variations in flour types and flour concentrations (p < 0.05). Batter containing roasted corn flour (RCF) was the darkest with L value of 30.39 and KF batter obtained the lightest colour (L value of 45.55). This was expected as the RCF was the darkest in colour among all the flour samples.
The RCF batter also had the highest intensity of redness (a = 6.24) and yellowness (b = 12.85). This could have been as a result of the combination of the light brown colour and the reddish colour of the unrefined palm oil used in the formulations. The variations in the redness (a) and the yellowness (b) of both the batter and the baked products were statistically significant (p < 0.05).
There was a general increase in L value with increasing four concentrations. Batter with 10% flour recorded the lowest mean L value of 37.81 while the batter with 20% flour recorded the highest mean L value of 40.43. Batter samples with 17.5 and 20% flours recorded the highest a (5) and b (12.29) values, respectively. It is noteworthy that the differences in the colour parameters of the batter at different flour concentrations were insignificant (p > 0.05). This implies that the variations in flour concentrations between 10 and 20% did not affect the colour of the batter.
The Hue angle and the Chroma of the batter ranged from (RCF = 64.16 to KF = 73.6) and (SCF = 11.41 to RCF = 14.32), respectively. The KF batter had a more yellowish tone than the rest of the samples. The variations in both the Hue angle and the Chroma for the different flour concentrations were insignificant (p > 0.05). The Hue angle ranged between 68.60 and 70.94 for the batter for 17.5 and 20% flours, respectively. Batter containing 10% flour recorded the lowest Chroma of 11.42, while the highest Chroma reading was observed for batter containing 20% flour concentration.
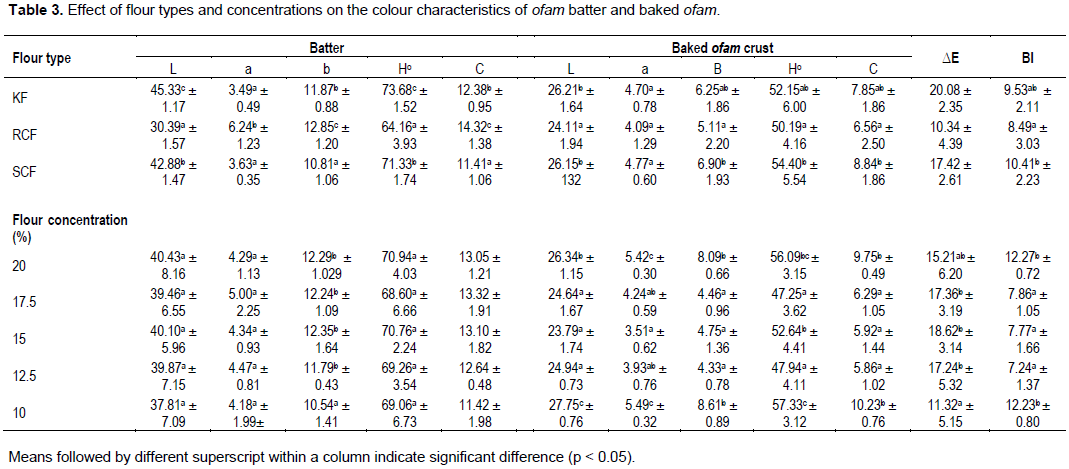
Comparatively, there was an increase in brownness when all the batters were baked. The L values of the products decreased significantly after baking. Results indicate that the variations in the L values for the ofam were statistically significant (p < 0.05). This implies that the differences in the flour samples used and the variations in the flour concentration influenced the L values of the baked ofam samples. The baked samples containing RCF recorded the least L value of 24.11, showing the darkest colouration, while KF recorded the highest L value among the three flour types. However, the differences in the L values for ofam containing KF and SCF were insignificant (p > 0.05). The darkening of cakes during baking has been attributed to non-enzymatic browning phenomenon.
The yellowness (b) and redness (a) of the baked ofam samples were statistically significant (p < 0.05). The baked ofam samples decreased in the yellowness (b) compared to their respective batters. Ofam containing RCF was the least in terms of the yellow colour intensity (b = 5.11) while SCF ofam samples were the highest (b = 6.90). However, the yellow colour of ofam with KF was not statistically different from RCF and SCF.
There was no specific trend observed for the redness (a-value) of baked products. For the different flour samples, KF and RCF recorded an increase in redness after baking from 3.5 to 4.7 and 3.6 to 4.8, respectively. Ofam samples with 20 and 10% flour concentrations also experienced an increase in redness relative to that of their respective batter as their final values for redness (a-value) were 5.42 and 5.49, respectively. The final redness (a-value for ofam containing RCF, however, decreased from 6.24 (being the a-value for its batter) to 4.09 (a-value for the baked product). A decreasing redness was also observed for ofam samples containing 17.5, 15.0 and 12.5% of flours compared to their respective batter samples. These differences in the redness of the samples could be attributed to the differences in flour types and flour interactions with other ingredients in the products during baking.
There was also a general decrease in the Hue angle (H°) and Chroma (C) of the baked products compared to their respective batters. Hue angle values recorded were 50.2, 52.2 and 54.4 for ofam samples containing RCF, KF and SCF, respectively. The reduced H-values for the baked products indicate a shift of the colour of the samples from a yellow dominance to an increase in redness.
The total colour difference (?E) accounts for the differences in the colour of the baked products compared to their respective batters. The ?E of the products were significantly influenced by both the type of flour used and the variations in the flour concentrations (p < 0.05). The RCF ofam samples had the least ?E of 10, while KF recorded the highest (20.1).
The samples with 15% flour had the highest ?E of 18.6 while samples with 10% flour recorded the lowest value of 10.2. According to Rodríguez? García et al. (2012), colour differences of ?E > 3 are obvious to the human eye. It is consistent with this current study as all the colour changes in the baked samples compared to their respective batter were obvious. The similarities existing in the ?E of the ofam samples containing 20% flour and the samples with other flour concentration could be as a result of their net change in their ?E values being less than 3.
The Browning index (BI) measures the degree of browning in the product. The browning which occurred as a result of the thermal treatment is attributed to the Maillard reaction between amino acids and reducing sugars and caramelization of sugars (Fennema, 1996; Gómez et al., 2008; Peressini and Sensidoni, 2009; Purlis, 2010; Toyosaki and Koketsu, 2007). Similar to ?E, the BI was also significantly (p < 0.05) influenced by both the flour type and concentrations. Ofam containing RCF recorded the lowest BI of 8.5 while SCF recorded the highest BI of 10.4. The average BI for ofam containing 12.5% flour, with 7.2 being the lowest. Ofam containing 20% flour obtained the highest BI of 12.3. Browning index of the ofam samples was largely influenced by the type of flour used. The BI obtained for the ofam samples in this study were lower than values usually obtained for cakes. These variations in the BI reported in the various studies could be attributed to differences in the product formulations.
Viscosity of ofam batter
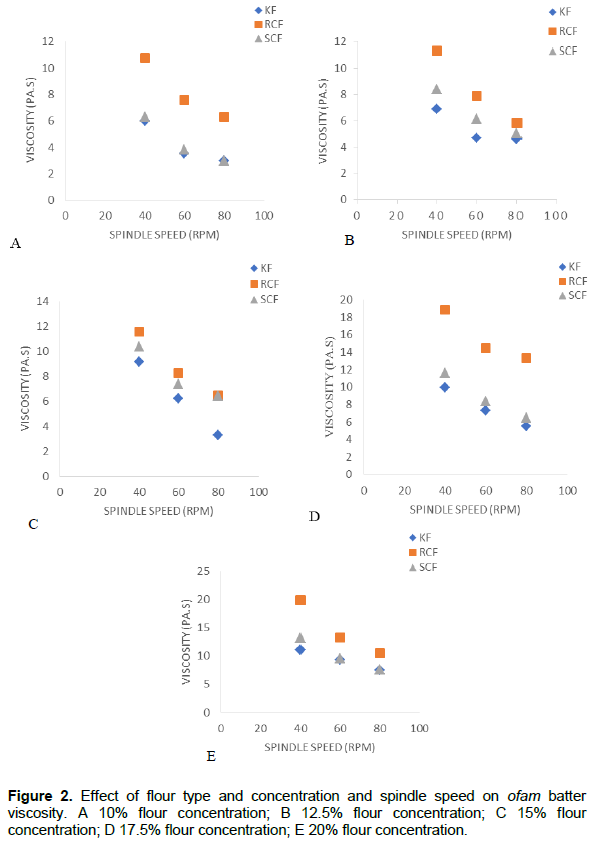
The viscosity of the ofam batter was influenced by both flour type and variation in flour concentration. In general, for spindle speeds of 40, 60 and 80 rpm, RCF batter recorded the highest average viscosity ranging from 8.3 to 14.6 Pa.s for 10 and 20% flour concentrations, respectively (Figure 2). This was followed by SCF batter 4.38 Pa.s (10% flour concentration) to 10.09 Pa.s (20% flour concentration), while the KF batter had the least viscosity values of 4.19 Pa.s (10% flour concentration) to 9.28 Pa.s (20% flour concentration). The starch properties in the flours would influence the water absorption hence affecting the viscosity food of the matrixes.
Results also indicated that the batter viscosities increased with increasing flour concentration (Figure 2). However, the most remarkable changes occurred at higher flour inclusion levels (that is, 17.5 and 20%). According to Bourne (2002), there is a direct non-linear relationship between the concentration of a solute and viscosity at a constant temperature. The increase in the concentration of the flour increases the solid matter in the batter which impedes the rotational movement of the spindle during the viscosity measurement. However, the increase in the impedance of the spindle results in high viscosity values. The viscosity of the batter would have a direct relationship with the batter density as the changes in the batter viscosity were a result of increasing solids. The batter exhibited a pseudoplastic behaviour; the average batter viscosities decreased with increasing spindle speed (from 40 to 80 rpm). This behaviour is typical of cake batters, fruit juice concentrates, apple sauce, and banana puree.
There was an observed decrease in the viscosity of the batter at the various spindle speeds with time. This behaviour may require further investigation to determine whether the batter would exhibit a thixotropic behaviour or shear thinning, which are both typical of starch paste.
Textural characteristics of baked ofam products
Results of the texture profile analysis (TPA) of baked ofam samples are presented in Table 4. The hardness of the ofam crumbs was affected by both the flour type and varying flour concentration. The variations in the hardness of the ofam crumbs as influenced by the flour type and flour concentrations were statistically significant (p < 0.05). The average hardness of the crumb was 966.8, 1378.6 and 1542.5 g Force for ofam containing KF, SCF, and RCF, respectively. There was a direct linear relationship between the viscosity of the batters and their corresponding baked product. Products that had a relatively high viscosity had high values for hardness. The high solids present in the high viscosity batter could limit the amount of free water available in the ofam, contributing to the increased hardness with increasing viscosity. This observation is not consistent with the finding ofLebesi and Tzia (2011)who observed a decrease in the firmness of cupcakes with increasing batter viscosity. The high batter viscosity helps in incorporating and retaining air bubbles, providing a stable voluminous cake, which is less dense. However, ofam lacks of ingredients with foaming properties, hence the increase in batter viscosity does not contribute to a less dense product. It is noteworthy that the properties and consumer expectation of cakes, in general, are different from ofam. The hardness of the ofam also increased with increasing flour concentration. Ofam with 20% flour recorded the highest mean value for hardness (1783.52 g Force) whereas the ofam samples containing 10% flour recorded the lowest mean value of hardness (784.0 g Force). Aziah et al. (2011)also reported an increasing trend of sponge cake hardness when the amount of mango pulp flour and mango peel flour is increased.
Fracturability is a measure of the force required to fracture the sample. It is normally experienced in products with a high degree of hardness and low cohesiveness (Al-Haq and Sugiyama, 2004; Szczesniak, 2002). The fracturability of the ofam samples was dependent on the type of flour used and also the concentration of flour added to the batter (p < 0.05). Whereas ofam containing KF had no fractures, ofam containing RCF had the highest fracturability (1665.25 g). The fracturability of the samples also decreases with decreasing flour inclusion, with mean values ranging from 678.54 to 1449.72 g for 10 and 20% flour inclusion, respectively. The sensory perception related to fracturability is crunchiness according to Barrett et al. (1994). This implies that the ofam samples containing RCF and SCF would be crunchier than the ofam samples containing KF. Likewise, the crunchiness of samples will increase with increasing flour inclusion.
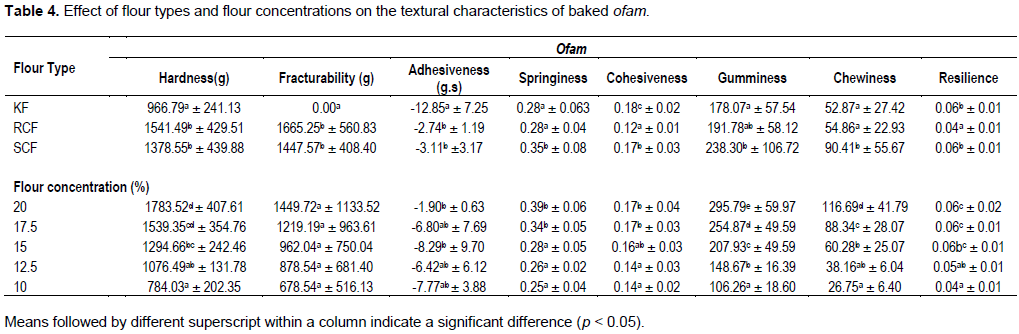
Adhesiveness is measured as the ability of a sample to hold onto the probe after the first compression (Szczesniak, 2002). It is the measure of the force required to remove materials adhering to the palate during the normal eating process. The adhesiveness of RCF ofam samples and SCF ofam samples were significantly (p < 0.05) lower than ofam made from KF. There was no clear relationship observed in the effect of the flour concentration on the adhesiveness of the ofam samples. However, samples with the highest flour concentration (20%) recorded the lowest adhesiveness (-1.90 g/s) while ofam samples containing 15% flour was relatively highly adhesive (-8.29 g/s). The variations in the adhesiveness of the ofam samples containing 17.5, 15, 12.5 and 10% flour concentrations were not statistically significant (p > 0.05).
Springiness is the extent of recovery between the first and second compressions. It is a measure of elasticity of a sample (Lu et al., 2010; Szczesniak, 2002). The TPA results indicated that the flour type influenced the springiness of the ofam samples significantly (p < 0.05). The KF and RCF ofam samples recorded the same values for springiness (0.28). The springiness of SCF ofam samples was the highest (0.35). There was an increasing trend in springiness with increasing flour concentration. The values of springiness ranged from 0.25 to 0.39 for ofam containing 10 and 20% flour, respectively.
The TPA results also showed an increase in cohesiveness, gumminess and chewiness to increasing flour concentration. However, these increments became significant only when the flour proportion was beyond 17.5%. Cohesiveness relates to the amount of force required to chew food. It gives an idea about the extent of the internal bonds present and the hardness of the samples (Friedman et al., 1963; Szczesniak, 2002).
Sensory characteristics of ofam
The mean sensory scores of ofam samples obtained for all the sensory attributes assessed; appearance, external/crust colour, internal/crumb colour, aroma, oiliness, hardness, stickiness, smoothness, sweetness, spiciness flavour and overall acceptability were above 5 on the nine-point Hedonic scale (Table 5). There were significant differences in all the fifteen formulations of ofam (p < 0.05) (Table 7). This indicates that even though the products exhibited some similarities in some attributes, on the whole, every product had its unique properties. The different formulations resulted in products with unique sensory properties.
Effect of flour types on sensory attributes of ofam
Results on the effect of flour type on the sensory acceptability of ofam are presented in Table 6. Generally, ofam samples containing KF were most preferred for appearance, smoothness and sweetness. However, the differences in the panellist preferences for ofam containing SCF and RCF compared to the KF ofam were statistically insignificant (p > 0.05).
The SCF samples also had the highest scores for attributes such as the external/crust colour, internal/crumb colour, aroma, oiliness, hardness, stickiness and flavour. The average responses for flavour for all three flour samples were statistically insignificant (p > 0.05). RCF samples were most preferred for spiciness. Expectedly, the differences in the spiciness of all the ofam types were also statistically insignificant (p > 0.05) as the quantities of the spices used for all the formulations were the same. The results indicate that consumers generally liked the spiciness of the products.

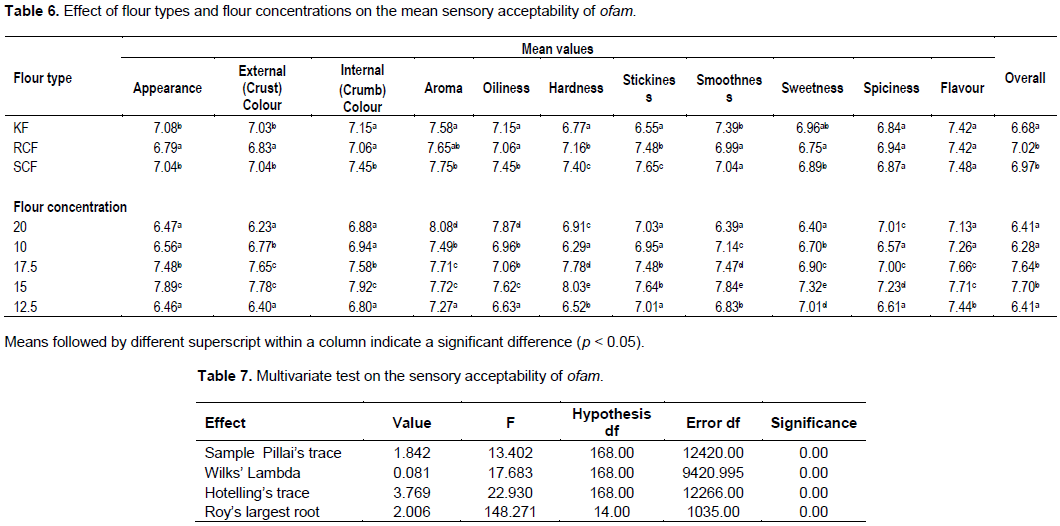
Ofam samples containing RCF were the most preferred (7.0) and the KF samples were the least preferred (6.68). The differences in the preferences RCF ofam and SCF ofam were statistically insignificant (p > 0.05). An earlier study indicated that consumers have different flour preferences for senescent plantain products (Adi et al., 2019). The preference of RCF ofam was in contrast with the finding by Adi et al. (2019), where majority of senescent plantain consumers preferred senescent plantain product with kokonte. The preference of kokonte could be due to the familiarity of the flour in such senescent plantain products. It means that it is possible for consumer preferences to change upon tasting alternatives.
Effect of flour concentrations on sensory acceptability of ofam
The mean consumer acceptance scores, which depict respondents’ liking of ofam based on the flour concentration used are presented in Table 6. Results indicate that the most preferred ofam samples were the ones containing 15% flour. The liking for ofam containing 17.5% flour was comparable to the most preferred ofam sample, and the difference was statistically insignificant (p > 0.05). Samples containing 15% flour had the highest preference of all the attributes except oiliness. Ofam samples containing 20%, were the most preferred for oiliness. These samples seem to be less oily than the rest of the samples. The inclusion of more flour in the formulation could have increased the interface for oil absorption. The differences in the preferences of attributes such as aroma, stickiness, flavour and overall acceptability for ofam samples with 15 and 17.5% flour were statistically insignificant (p > 0.05). Implying that respondents preferred samples made from RCF and SCF, with average hardness. Dzomeku et al. (2007)reported on the sensory evaluation of four FHIA tetraploid hybrid for kaakle (a steam senescent plantain product) similar to ofam. The overall acceptability of the kaakle prepared with the inclusion of 20% flour was good. However, Edwige et al. (2014)reported between 10 and 15%, to be the acceptable levels for rice and maize flours in the formulation of both optimised steamed and baked dockounou (an Ivorian derivative of ofam).
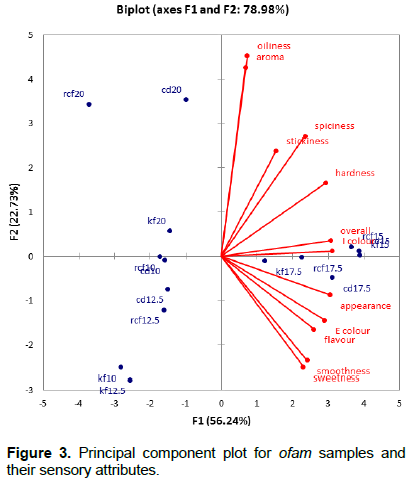
Principal component analysis
The bi-plot (product-attribute) space using principal component (PC) 1 and 2 is presented in Figure 3. The similarity map of the attributes was defined by two principal components PC1 and PC2, accounting for 56.24 and 22.73%, respectively. From the PCA score plot, panellists’ overall acceptance of the ofam samples was positively influenced by the internal colour, hardness, spiciness, stickiness, oiliness and aroma, and negatively influenced by appearance, external colour, flavour, smoothness and sweetness. Consumers seemed to prefer products containing 15 and 17.5% flour irrespective of the flour type. This seem to confirm the consumer preference of 15% maize flour inclusion for optimised dockounou, lower than the 10% inclusion of rice flour for optimised product reported by Edwige et al. (2014). The appearance, external/crust colour, internal colour, hardness, aroma and sweetness, contributed significantly to the overall differences among the products. These factors have also serve as very important consumer buying indicator.