ABSTRACT
The study was done in Ethiopia three cities. The success of any business is highly dependent on getting and maintaining customers. Many firms try to sphere their operations aiming customers through measuring customers’ satisfaction. Recent research findings indicated that satisfaction alone did not guaranty the long term survival. Loyalty is a better indicator in this aspect since it incorporates satisfaction as an antecedent factor. This study was conducted to investigate influential factors of brand loyalty, and different loyalty level of beer consumers in Ethiopian context that would shed light on other developing countries too. The research approach was quantitative wherein the two best known brand loyalty measurement models have been used. Data was collected via questionnaires from 400 respondents consuming two dominant brands in the selected three cities. The software used for analysis was statistical package for social sciences (SPSS) statistics version 20. Principal components analysis was used to analyze the data determine, and the main components that are statistically and practically significant. The findings indicated that among 13 brand loyalty influences identified in the model, brand trust, breweries marketing activity, culture, repeat purchase and the combination of brand relevance and brand performance had the highest influences on consumer loyalty. The study concluded that the level of brand loyalty of beer consumers were not in one loyalty stage and almost 1/3 consumers were not totally loyal for their respective beer choice. The result of the research clearly indicated that breweries must focus on the ten most significant brand loyalty factors, and adjust their overall marketing strategy according to the beer consumers’ loyalty level. Due to brand proliferation of beers in Ethiopian context, the level of brand loyalty has to be taken as segmenting criteria to develop marketing strategies and decisions. The research is done in two brands, and the geographic coverage consists of three major cities, thus this research could be done at large scale by taking into account geographic and demographic difference of beer consumers
Key words: Beverage, brand, customer, loyalty, model, satisfaction.
Beer is the world widely consumed alcoholic beverage. The brewing industry is a global business, consisting of several dominant multinational companies, and many thousands of smaller producers. More than 133 billion liters are sold every year.
There is great advantage for beer market due to the demographic structure in Africa. The continent has the largest young working age group in the world. Sub-Saharan African countries are showing the highest economic growth, and population growth in the world (Doo, 2015).
South Africa has the second largest brewery company in the world that is SABMiller. It has operation in large number of African countries including Ethiopia (Lobo, 2016). Diageo and Heineken are the other multinationals operating in Ethiopia beer market.
The beer production in the country grows from one million hectoliter to around four hector letter from 2003 to 2011, annual growth rate is around 20%, and which is very high as compared to many countries of the continent. In the past, many breweries in Ethiopia were government owned; now the government has privatized the sector. Due to the deregulation of the sector, many domestic and foreign investors joined the industry. The annual production per year this time in 2016 is above 10 hectoliters. The traditional way of competition for the domestic players will not be feasible for the global beer industry in Ethiopia.
Marketers identified many benefit of loyal customer which includes, willingness to pay higher prices, costs less to serve and can refer new customers to the enterprise (Reichheld and Sasser, 1990), less price sensitive have been found to be attracted by sales promotion than non-loyal customers (Bowen and Shoemaker, 1998).
Thus, this research is developed to address the practical problems of brand loyalty situation and recommending empirical recommendations that would address the problem based on scientifically investigated models in the academic arena.
The ultimate goal of customer satisfaction is building long term relationship with customers, and makes them brand loyal. Studies have established the existences of a direct relationship between satisfaction and loyalty (Heskett et al., 2008). Van Vuuren et al. (2012) concluded that, majority of consumers who defect to a competitor were satisfied or very satisfied on the survey just prior to their defection.
Majority of researches focused on measuring customer satisfaction as a basic predictor of success, and their overall business status (Shanka, 2012). The researchers did not find exhaustive study that link the level of satisfaction, and their determinant factors. Most studies associate the satisfaction as the only variable affecting customer loyalty. Customer loyalty is shown through various behavioral activities like recommending a brand to other customers, and repeatedly patronizing the provider (Fornell, 1992).
Loyal customers are in a position to engage in positive word of mouth, and referring their acquaintances’ and close relative to buy from their loyal brands than the competitive (Sheth and Parvatiyar, 1995). Loyal customers improve the effectiveness of marketing activities, and negate the marketing activities of the competitive once (Blattberg and Deighton, 1996) .
This research is unique due to the fact that the study is done in beer industry in developing country perspective. A model has been adopted, and improved from the previous studies that have been developed to explain the loyalty determinant of a developed country perspective (Howaniec, 2012; Moolla and Bisschoff, 2012), and the status of loyalty (Gleneicki, 2012).
In Ethiopia beer industry context, there is no research yet conducted that measured factors affecting customers brand loyalty and level of brand loyalty at the same time. Thus, this research has practical and empirical importance to the practitioners as well as the academics.
Research objectives
The general objective is investigating level and factors affecting brand loyalty of the two brands, and specifically:
(1) To identify the different loyalty statuses of beer customers
(2) To differentiate loyalty statuses of consumers across two brands
(3) To identify major factors of beer consumers brand loyalty
(4) To assess the contributions of the breweries marketing activities for different loyalty status of their customers
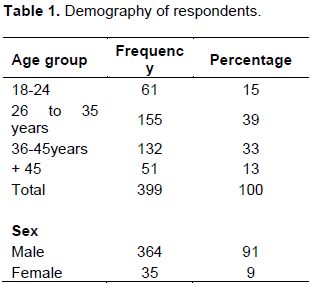
The research approach was quantitative. The study population is all beer consumers of the St. George and Dashen beer in Ethiopia three cities. The cities have been selected purposively. Hawasa city host St. George, and Gondar city host Dashen beer as their brewing place, and Addis Ababa city is the major market for all breweries.
Simple random sampling has been used to select individual respondents in the bars and restaurants. The researchers used questionnaires from 400 respondents of two brand consumers in the three cities of the country. The 5-item Likert scale type of questioner was used to gather the data (Cooper et al., 2006).
The data analysis instrument has been checked for reliability and validity (Zikmund et al., 2012). The data has been analyzed using factor through Principal components analysis (Thompson, 2004). The level of brand loyalty has been checked using Apostle Model which have been very useful, and easily visualize the result (Gleneicki, 2012). Statistical package for social sciences (SPSS) version 20 was the software used to analyze, and enter the data. Appendix 1 to 10 shows a clear explanation of what was done to reach the interpretation and recommendations in details.
The numbers of two breweries respondents were equivalent to 200 for St. George and 199 for Dashen brewery. Most care had been taken to get representative sample interims of consumers’ demographic profile of age and sex. The research was not used to draw conclusion based on demographic variables as the researchers were not interested in that aspect (Table 1).
Level of brand loyalty of beer consumers
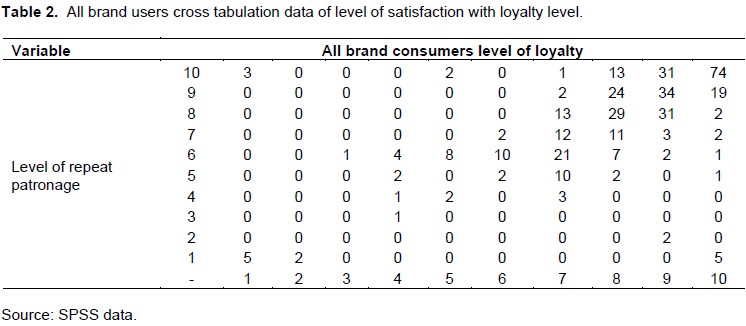
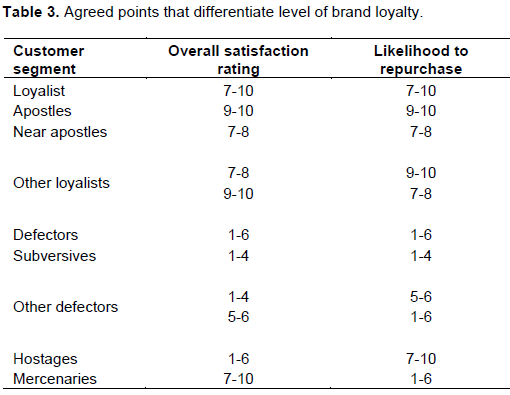
A ten point scale model called apostle was implemented to differentiate beer consumers’ level of loyalty. Apostle model was applied in this study (Gleneicki, 2012). The model was used to differentiate different loyalty level of consumers by comparing consumers’ satisfaction rate with their repeat purchase intention.
Table 2 showed the row data of consumers brand loyalty and their intention of continuing to use the brand in the future. The results in the following tables and discussions were processed for easy classification of
consumers’ loyalty level.
According to Gleneicki (2012), the classification mechanism of the collected data is based on the standardized method presented in Table 3. Table 3 showed that there were nine level of brand loyalty. The table shows the level of brand loyalty according to the consumers overall satisfaction, and their commitment to purchase their preferred brand in their next purchase time (Table 4).
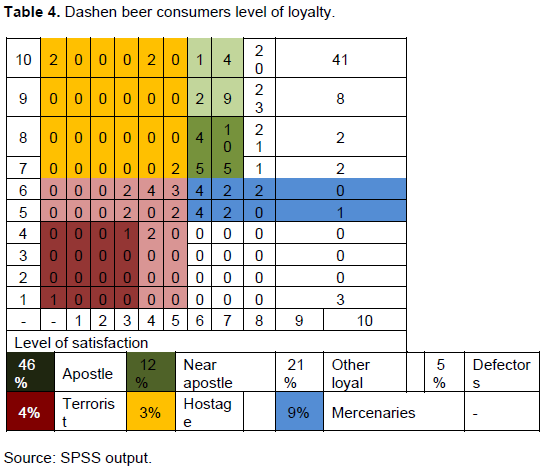
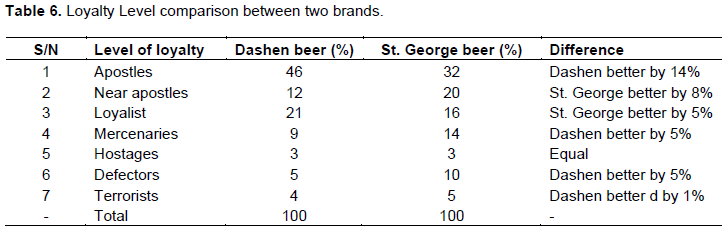
As shown in Table 4, 46% of Dashen beer consumers were Apostles. According to the model, these consumers are extremely satisfied and extremely loyal customers who have an emotional connection to the brand. Yet again 12% and 21% customers in that order were near apostle, and other loyal customers respectively. Thus, sum data clearly indicates that 79% of Dashen beer consumers were loyal to their brand. From the remaining 21%, Mercenaries took a share of 9%. Mercenaries were consumers who were characterized by high satisfaction but had low level loyalty and would switch whenever the opportunity arose. 3% of Dashen beer consumers were hostages who drink the brand but their level of satisfaction was low. Hostages might continue with the brand till switching barriers (like availability, price) removed. 9% of Dashen beer consumers drunk the brand with low satisfaction, and low intention to repurchase the product the next time.
Thus, the aforementioned apostle loyalty model finding evidently indicates that the level of Dashen loyal consumers were in a good position while 21% of them were not considered as a loyal consumers, and in a position to easily shift to other brand if opportunities are created (Table 5).
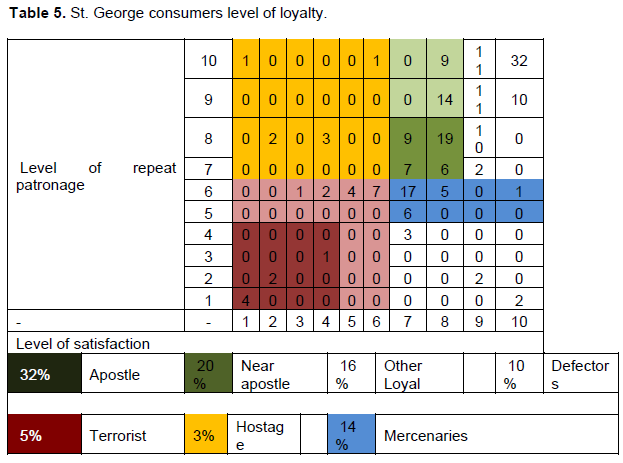
From Table 5 one can easily identified that 68% of St. George beer consumers were loyal to their beer preference with different loyalty stage. According to the data, 32% were Apostle loyal to St. George followed by near apostles’ and other loyal consumers with equal 20 and 16%, correspondingly. Whereas it’s somehow strange that almost 1/3 St. George beer consumers were not totally loyal to their beer preference even if with different stage of loyalty those defectors were 15% followed by mercenaries with 14%, terrorists with 5% and hostages with 3%. The sum up data indicated that the brewery was in the position that might lose almost half of its beer consumers, if they do not change their strategy to suit consumers’ preference.
Table 6 comparison results of the brand loyalty showed that Apostle Category Dashen was better by 14%, St. George was better in near apostle by 8%, in Loyalist by 5%. Both brands were equal in Hostages category. In defectors and terrorist, Dashen was better by 5 and 1%, respectively. The sum of brand loyalty level indicates that both brands were not able to keep their entire respective consumers brand loyal, and more than 30% of consumers were in the peak level to shift to other brands, and some of them were even terrorists for the brand they consumed.
Factor analysis result of brand loyalty
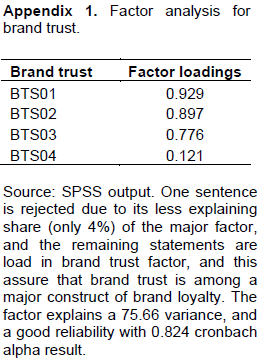
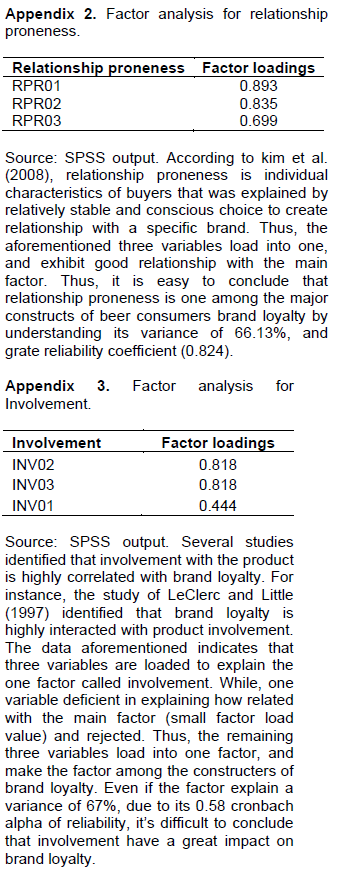
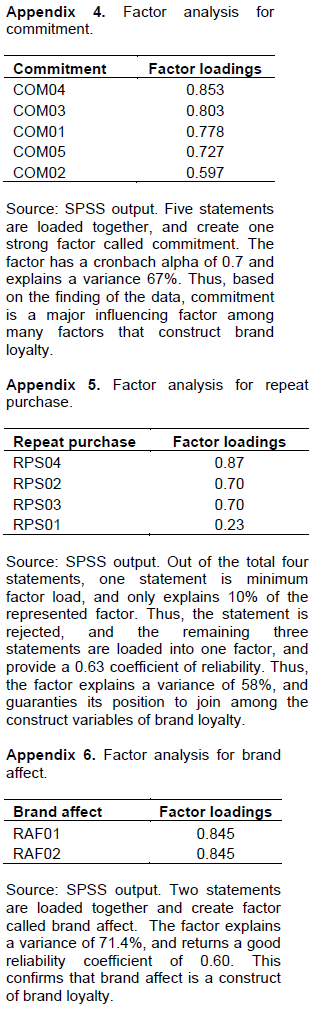
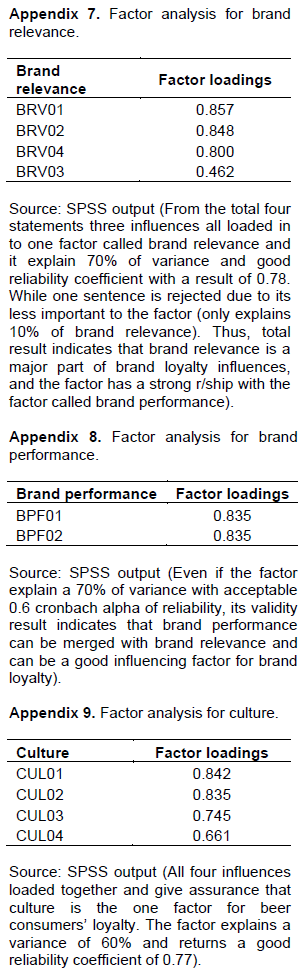
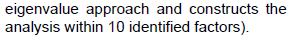
The researchers implement the combined Fast-moving Consumer Goods (FMCG) loyalty measuring model developed by Molla and Bisschoffa (2012) and Howaniec (2012). The ten identified influencing factors were brand trust (with 0.824 Cronbach alpha and a share of 13% influence), breweries marketing activities (with 0.849 Cronbach alpha and a share of 11% influence), culture (with 0.772 Cronbach alpha), repeat purchase (with 0.63 Cronbach alpha), brand performance and relevance, (with 0.758 Cronbach alpha), relationship (with 0.740 Cronbach alpha), commitment (with 0.702 Cronbach alpha), satisfaction (with 0.761 Cronbach alpha), brand affect (with 0.60 Cronbach alpha) and involvement (with 0.58 Cronbach alpha).
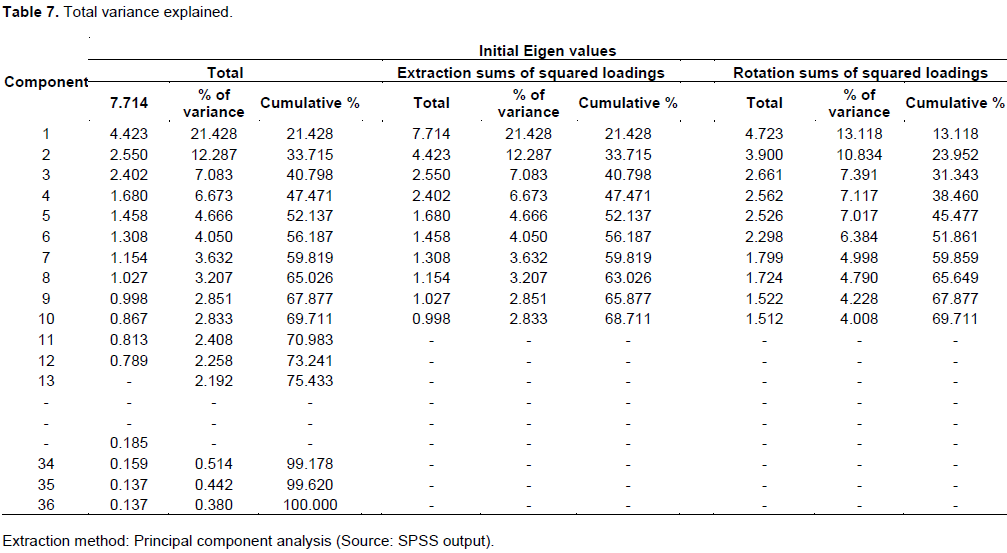
Thus, the finding indicated that among 10 majorly identified factors, brand trust, breweries marketing activity, cultures, repeat purchase and brand performance and relevance were the top five factors taken a sum share of more than 2/3 share of the ten identified factors. The researchers used Eigen value as criteria of selecting valid components that would be included in the analysis for explaining the loyalty of brands. Based on that, 10 factors have been identified (Table 7). The validity and reliability of factors has been checked using Eigen value and Cronbach alpha test. It has been found to be acceptable. According to Table 7 analysis result brand trust, breweries marketing activities, culture, repeat purchase, brand performance and relevance, relationship, commitment, satisfaction, brand affect and involvement are the major factors of beer consumers brand loyalty, and the level of influence was 13.118, 10.834, 7.391, 7.117, 7.017, 6.384, 4.998, 4.79, 4.228, and 4.008% respectively. The ten factors explained 69.7% of the variance in brand loyalty. It is almost similar to other researchers output that has been taken as starting point for this research (Howaniec, 2012; Jacoby et al., 1971). Figure 1 showed the accepted model that explains brand loyalty in beer brand in Ethiopian context. The three variables have been rejected due to lack of validity and reliability; the ten variables are predicting the brand loyalty in beer context. The variables that explain the brand loyalty which result from the factor analysis, and the previous studies has been depicted in Figure 1. The ten variables need to get major emphasis when developing marketing strategy that would win the hearts and minds of consumers for each brands of beers.
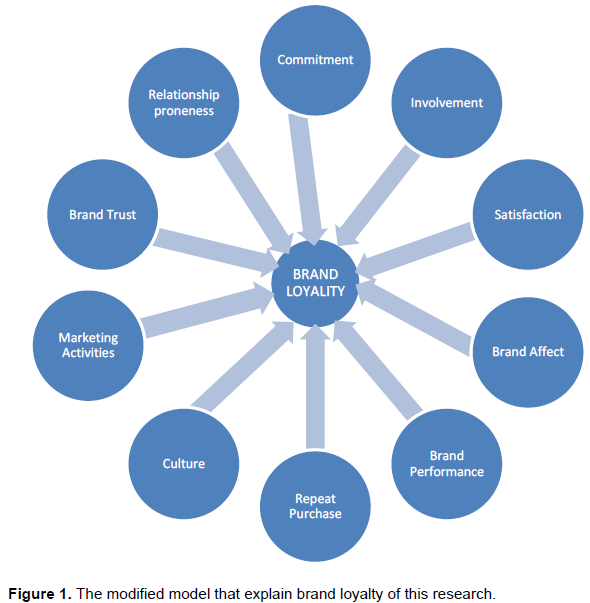
Assessing profitability of business by lump sum profit or market share is good to assess the past performances while all are filled to tell us about the future. Brand satisfaction and level of loyalty is a better criteria to tell the future potential performance of brands The apostle model provided a robust way to segment and understands customers, and it can help companies to take appropriate action. Sixty-four percent of beer consumers are loyal, and the remaining36% of total beer consumers are not true loyal consumers for their first brand choice. The brand loyalty level of two studied brand consumers indicates that there is no huge difference between two brand consumers. The factor analysis result indicates that among 13 brand loyalty influencing factors, 10 factors are identified as a majors, and have about 70% explaining power. The ten identified influencing factors are brand trust, breweries marketing activities, culture, repeat purchase, brand performance and relevance, relationship commitment, satisfaction, brand affect, and involvement.
Thus, the finding indicates that among 10 majorly identified factors, brand trust, breweries marketing activity, cultures, repeat purchase and brand performance and relevance are the top five factors taken as a sum share of more than 2/3 share of the ten identified factors.
The current business environment is very volatile, and our current success may not be tomorrow’s, today consumers may not be tomorrow’s. As a result, breweries must measure and differentiate consumers brand loyalty level, and develop appropriate strategy for each type of customers.
Implementing one standardized strategy for different loyalty stage consumers is not reliable, and may return to wastage (of time, resource). Breweries must set priority and unique strategy to address on different beer consumers in different loyalty level.
The apostle model recommends that company’s priority number one must be addressing the defectors, especially terrorists by designing a strategy to "fire them" or to design a win-back by comparing the return on investment. The second priority must be given to Apostles and their needs, third priority for pushing Near Apostles up to Apostles, fourth priority for mercenaries.
Companies have little control over mercenaries, and only focus on the price competitiveness of the company’s products or service. Finally, the last but not least priority goes to hostages who are exhibiting a false loyalty, and this should also be addressed because someday they may be scooped away by competition. Understanding their needs, their reasons for dissatisfaction, and work through it with them is crucial.
Most companies in Ethiopia are not in a position to check out the marketing audit, and if some of them try it, they do in the wrong way like measuring customer satisfaction, measuring market share etc. Thus, most of them are not able to differentiate their customers’ loyalty level, and factors that affect brand loyalty of beer consumers.
Breweries must not merely focus on satisfaction, and see other factors beyond satisfaction. It’s logical to recommend that breweries must give great attention for identified brand loyalty factors, and adjust their marketing strategy accordingly.
The authors have not declared any conflict of interests.
REFERENCES
|
Blattberg RC, Deighton J (1996). Manage marketing by the customer equity test. Harvard Bus. Rev. 74(4):136-138.
|
|
|
|
Bowen JT, Shoemaker S (1998). Loyalty: A strategic commitment. Cornell hotel and restaurant administration quarterly, 39(1):12-25.
Crossref
|
|
|
|
|
Cooper DR, Schindler PS, Sun J (2006). Business research methods (Vol. 9): McGraw-hill New York.
|
|
|
|
|
Doo S (2015). Tapping Africa's Beer Market. from
View
|
|
|
|
|
Fornell C (1992). A national customer satisfaction barometer: The Swedish experience. The J. Market. pp. 6-21.
Crossref
|
|
|
|
|
Gleneicki AF (2012). The Apostle Model. Available at:
View
|
|
|
|
|
Heskett JL, Jones TO, Loveman GW, Sasser WE, Schlesinger LA (2008). Putting the service-profit chain to work. Harvard business review.
|
|
|
|
|
Howaniec H (2012). The modeling of Brand Loyalty in the Brewing Market in Poland. World Acad. Sci. Eng. Technol. 68:330-335.
|
|
|
|
|
Howaniec H (2012). The modeling of Brand Loyalty in the Brewing Market in Poland. World Acad. Sci. Eng. Technol. Intern. J. Soc. Behav. Educ. Econ. Bus. Ind. Eng. 6(8):2041-2046.
|
|
|
|
|
Jacoby J, Olson JC, Haddock R (1971). Price, brand name, and product composition characteristics as determinants of perceived quality. J. Appl. Psychol. 55(6):570-579.
Crossref
|
|
|
|
|
Lobo R (2016). Africa's untapped beer market. Available at:
View
|
|
|
|
|
Moolla AI, Bisschoff CA (2012). Validating a Model to Measure the Brand Loyalty of Fast Moving Consumer Goods. J. Soc. Sci. 31:101-115.
|
|
|
|
|
Reichheld FF, Sasser WE (1990). Zero Defeoï¬ons: Quoliiy Comes To Services.
|
|
|
|
|
Shanka MS (2012). Bank service quality, customer satisfaction and loyalty in Ethiopian banking sector. J. Bus. Admin. Manage. Sci. Res. 1(1):001-009.
|
|
|
|
|
Sheth JN, Parvatiyar A (1995). The evolution of relationship marketing. Int. Bus. Rev. 4(4):397-418.
Crossref
|
|
|
|
|
Thompson B (2004). Exploratory and confirmatory factor analysis: Understanding concepts and applications: American Psychological Association.
Crossref
|
|
|
|
|
Van Vuuren T, Roberts-Lombard M, Van Tonder E (2012). The relationship between selected variables and customer loyalty within an optometric practice environment. Acta Commercii, 12(1):94-106.
Crossref
|
|
|
|
|
Zikmund W, Babin B, Carr J, Griffin M (2012). Business research methods: Cengage Learning.
|
|