Full Length Research Paper
ABSTRACT
The research was conducted to determine if the study program of the career of industrial processes Technological University of Chihuahua, 1 year after that it was certified by CACEI, continues achieving the established indicators and ISO 9001: 2008, implementing quality tools, monitoring of essential indicators are determined, flow charts are developed and introduced to strengthen the quality management system, the website was designed to systematize finally implemented for each requirement primary control indicator and their respective metric to measure performance and determined that 17 indicators are being met extensively, five indicators were moderately satisfied and 3 indicators are not met, it has a 12% failure of the primary indicators measured during the study period 2014-2015.
Key words: Accreditation Board of Engineering Education (CACEI), ISO 9001: 2008, tracking.
INTRODUCTION
There are three models of evaluation in higher education, according to four basic variables: The purpose of the evaluation, the reference and basis for assessing the extent of the evaluation and the main models or procedures in the system. It also describes three basic models of quality assessment: The American model, the continental European model and the British model.
The American model basically attempts to improve the institutional program and provide assurance to the public. The assessment scope leans towards the achievement of corporate goals, evaluating entire institutions as scheduled in education, research and administration are included. The peer evaluation rarely focuses on degree and qualification standards.
Around the European continental model, improvement and quality are defined not only to the public assurance but the government. The reference for assessment is basically the expectations of the association; the evaluation is primarily the academic program, rather than administrative services and structures. The main method used is the external peer review team. The British model emphasizes the maintenance of standards of qualifications and the establishment of quality criteria. The basic procedures are those of the peer evaluation and use of performance indicators.
These models mentioned above are related to the models that are used here in Mexico because the importance of quality is therefore essential to evaluate and determine the logistics of that measurement (Royero, n.d.).
One way of evaluating the quality of education is based on the implementation of indicators by which you can determine the efficiency of performance of any activity within the educational process. That is why this research aims to develop indicators and their respective metric in order to make the educational process as well as all support processes that are involved in college education more efficient. This coupled with the efficient increases if indicators are evaluated; a certification is estimated in ISO 9001: 2008 and a certification of CACEI by this indicator is more efficient. Basic quality tools implementation is seek with this research in order to follow up and to create a culture of quality to continuous improvement in the educational process.
In Mexico in 1994 is founded Consejo de Acreditacion de la Enseñanza de la Ingenieria (CACEI), by the National Association of Colleges and Schools of Engineering agreement. At first it was a civil association formed in plural form; it is involved with professional practice and forming of engineers.
In almost 17 years of its foundation CACEI takes an intense and fruitful activity establishing the methodology for accreditation processes and implementing various programs in almost four branches of engineering. To CACEI the essential indicators (25) are those that determine the essence of an object or process. Compliance must ensure compliance of the same for the existence of a good quality of a program. (CACEI, 2011)
ISO (International Organization for Standardization) is a worldwide federation of national standards bodies (ISO member bodies). The adoption of a quality management system should be a strategic decision of the organization. This standard promotes the adoption of a process-based approach when developing, implementing and improving the effectiveness of a quality management system, to enhance customer satisfaction by meeting their requirements.
For the ISO 9001: 2008, a quality management system is a set of interrelated and coordinated activity used to direct, control and improve an organization’s quality (IMNC, 2008).
Tools of Quality Management provide a means to implement processes of quality control, monitor these processes and solve any problems arising from them (Paul, 2000). Ishikawa diagram is a graphical method that relates a problem or effect to the factors or causes that may generate it. The importance of this diagram is that it is obliged to find the different causes that affect the problem under analysis and this way, avoids the mistake of looking for solutions directly without questioning what the real control causes. Control charts are diagrams showing the upper and lower limits of the process to be controlled. A control chart is a schematic presentation of the data over time. These diagrams are constructed so that new data can be readily compared with those obtained from past performance (Barry, 2006).
Statement of the problem
There is a lack of numerical indicators and use of statistical control tools in monitoring and evaluating the systematization of CACEI-ISO indicators in the industrial process studies program at Universidad Tecnologica de Chihuahua.
Purpose of research
The work aims to establish the minimum criteria of CACEI using basic tools of quality and time series graphics as a control measure in the systematization of CACEI-ISO indicators in order to facilitate monitoring of the study program of industrial processes.
Research question
Are there internal indicators that measure and control the primary indicators established for CACEI-ISO accreditation?
MATERIALS AND METHODS
This research aimed to create and implement the necessary controls of the key indicators established by CACEI besides determining their efficiency. The sample consists of the principal of industrial process career, a career coordinator, director of finance administration, director of press, broadcasting and cultural activities, general counsel, head of school services, 13 full-time teachers in the morning shift, 19 part-time teachers tutoring in the afternoon shift and 31 teachers.
The methodology followed is as follows
1. Systematization of the minimum primordial indicators with ISO 9001: 2008 by creating website, industrial processes webpage.
2. Unify ISO 9001: 2008 with the guidelines established by CACEI in SGC.
3. Determining the indicators and the Metric Control of the main indicators established by CACEI.
4. Method of Measurement of primordial indicators was stipulated.
5. The measurement results of the primordial indicators are obtained.
Content
Opportunities were analyzed within the operational processes of the career; to systematize these processes a website was designed. With this, improvement of procedures improve was realized based on the guidelines of CACEI and basically taking the indispensable minimum indicators. Figure 1 shows the industrial processes website.

The application of ISO 9001:2008 was unified with CACEI to optimize standardization of activities taking place in the process, meet the guidelines performing activities in the process and these activities serve to implement the guidelines established by CACEI; also it serves to avoid duplication of activities to comply with both guidelines.
Primary indicators and their respective metric used
1. Development plan indicator (annual) = development career plan document presented by career management. Metric: submission in the first two months of the year.
2. Academic staff income indicator which is composed of academic structure indicator = Deliver academic structure according to the procedure of SGC. The metric is: academic structure authorized no later than the second week of the third month of the quarter, and hiring index = new academic staff recruitment procedure. The procedure starts the first week of the fourth month of each quarter and ends the third week of the fourth month of each quarter. Their respective metric is hiring new teachers later than the second week of the fourth month of each quarter. It is said that this indicator is met if 90% of new teachers are hired under this scheme.
3. Activity teachers indicator which consists of the implementation of POCT Index = (RPTC activities / total activities RPTC). * 100%. The metric is: (80% of full professors meet RPTC 80% of activities didactic sequences index rating = didactic sequence 90 points minimum value for each teacher with the authorization ensured. Metric: 80% of teachers have the authorization of the didactic sequence and the failure rate = students failed by quarter / semester students enrolled by quarter. Corresponding metric is: 5% or less failure rate each quarter.
4. Teachers’ evaluation indicator will be measured by the evaluation index applied to teacher and tutor = Survey SGC. Surveys are done by the students of each subject per quarter. It is metric: 80% of teachers who teach in the career of industrial processes have an acceptable minimum average 3.5 in any subject taught, as well as the tutor.
5. Integration of academic staff indicator which is composed of teachers’ index with knowledge related to the career= Number of teachers with related engineering to the career / total of teachers in the career. Metric: At least 70% of the teachers must meet. The Index teachers humanists degree or specialty areas = the number of teachers with bachelor's degree or specialty in humanistic / total area teachers who are in the career. Metric: At least 30% of the teachers must meet. And the index of teachers who are at least 2 years industry experience = number of teachers who are at least 2 years experience in the industry / total teachers who are in the career. Metric: At least 30% of teachers must meet. Metrics are: 70% of teachers must meet the requirements of having a related engineering to industrial processes career, 30% of teachers should be a bachelor's or master's degree in humanistic areas and 30% of teachers should have at least two years of professional experience.
6. Regulations indicator. Students index regulations students= the group receives information about the academic regulations in the second week of classes of the semester. Metric: 90% of tutors provide information to their students about regulations.
7. Objectives and structure of the study program indicator. Index = AST Procedure (every 4 years) first month of year make the AST. Academy meetings index = 2 at least per quarter. Metric: Modify curricula 1 time every 4 years.
8. Graduate profile indicator. When the students make their stay in the productive sector at the end of their studies, control indicator will be the final evaluation of the technical advisor of the company. It is the employer who is in charge of the student when he makes its stay. It is measured when the students are in the industrial sector and the metric is that students have a minimum qualification in stay of 85% in each of the areas evaluated. Graduate profile Index = Number of students who are in excellent or well conditions in the survey of corporate counsel in the SGC / total number of students tested in the SGC profile. Metric: The student must have 90% overall average on what is evaluated.
9. Extension study program indicator is integrated total hours Index devoted to basic science = total hours devoted to basic science / total hours of curricula. Metric: 30% of hours should be devoted to basic sciences. Index of total hours devoted to engineering sciences = total hours devoted to engineering sciences / total hours of the curricula. Metric: 35% of hours devoted to engineering sciences. Index of total hours spent on the application engineering = total hours devoted to engineering sciences / total hours of the curricula. Metric: 15% of hours devoted to engineering sciences.
Index of total hours spent on social sciences and humanities Total = hours devoted to social sciences and humanities / total hours of the curricula. Metric: 12% of hours devoted to engineering sciences. Index of total hours spent on other courses = total hours spent on other courses / total hours of the curricula. Metric: 8% of hours devoted to engineering sciences. Which must meet the requirements established by CACEI which are: 800 h in basic sciences, 900 h in engineering sciences, applied engineering 400 h, 300 h of social sciences and humanities and 200 h in other courses. Responsible for following up this indicator is the career director.
10. Study program content indicator. The table of contents of the curriculum = number of programs was established: the aim, learning activities, literature, props, activities / total number of programs that have established the career. Metric: 100% of programs.
11. Study program review indicator. The study program revised index = study program is reviewed every 4 years by the CGUT career and directors. Metric: At least there is a review of the study program every four years.
12. Degree indicator. Degree index = (graduate students in that period / enrolled students that period) * 100 Metric = 80% of graduates during the period.
13. Indicator of alternative methodologies in the teaching process: this indicator is reached with sequences teaching index = Teaching sequence 90 points minimum value for each teacher with authorization. Metric ensures that 80% of teachers have the authorization of the teaching sequence.
14. Computational tools indicator. The index used is the laboratory use = (current hours used during the quarter / Total hours scheduled during the quarter) * 100. Metric: 80% use the computer lab.
15. Classrooms indicator. The number of classrooms indicator = Number of students reentry + number of students per semester admission of industrial process career / Constant of 35 students per classroom. Metric: have 100% of classrooms for the number of students per semester.
16. Laboratories minimum index of using heavy laboratories = (current hours used during the quarter / Total hours scheduled during the quarter) * 100. Metric: Use 80% of the integral center of the process.
17. Features laboratories indicator. The metric is the existence of a document certifying what should or should not be any changes to the laboratories in the development plan. Index on characteristics of laboratories = Compliance process for making the curriculum of the career of industrial processes. Metric: 100% compliance.
18. Bibliographic index = (related books to industrial process career / total books in library) * 100. Metric: Get 20% of all library books related to the career of industrial processes.
19. Research features and / or technological development indicator. Research index and / or technological development = (research and / or technological development completed during the year / total research agreements and / or technological development) * 100. Metric: Comply with 50%.
20. Computer equipment indicator. The control indicator consists on measuring how many computer equipment corresponding to the assigned students in industrial processes. Index of number of students per machine = number of students enrolled each quarter / number of computers that are available to students in the career of industrial processes. Metric: Maximum 10 students per computer.
21. Vinculation indicator. Visits and / or conferences index = number of visits and / or conferences during the quarter / number of planned groups during the semester attending visits and / or conference. Metric: 80% of groups who planned visit attend at least one visit and / or conference per quarter.
22. Financial planning indicator. Purchases efficiency index = (orders served on time / orders requested during the quarter) * 100. Metric: Comply with 80% on purchases during the quarter.
23. Terminal efficiency indicator. Terminal efficiency index = (graduated students during the quarter / students registered during the semester) * 100. Metric: Reach 70% terminal efficiency.
24. Degree efficiency. Titling efficiency index = (degree during the quarter / income students during the quarter) * 100. Metric: Get 80% of graduated students.
25. Graduates monitoring indicator. monitoring index = number of graduated students who are being monitoring six months after graduating / total number of students by year. Metric must be monitored 80% of students each year.
Then the measurement in the period 2014-2015 was performed for each of the key indicators in the educational program in which the following results were obtained.
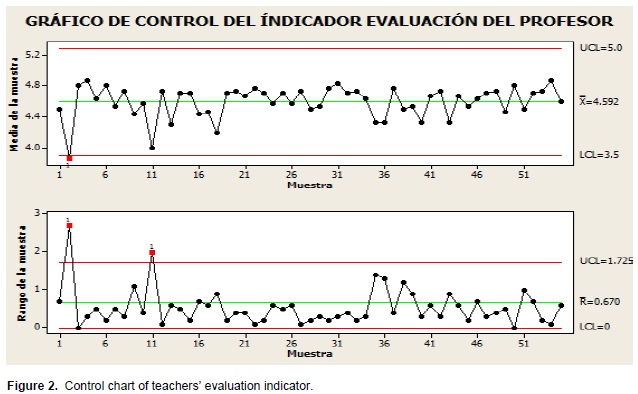
For example in the 4th indicator on evaluation of teachers, Figure 2 shows the control chart of students’ performance in the industrial processes in 2014; teachers had less than 3.5 points, so that 98.18% of the teachers were evaluated above 3.5 on average per field. With respect to the teachers’ evaluation, index it is satisfied.
Another example is graduated profile indicator where students at the end of their studies go to the industrial sector to realize their stay, for four months. The performance in several areas was analyzed in this indicator as shown in Table 1. This shows that this indicator in 2015 is also reached.

RESULTS
40% of the primary indicators index and their respective metric are determined; besides the statistical methodology was established to provide control and monitoring of all primary indicators that operate in the career of industrial processes. Added to this effect is given to the general objective of the research by implementing indicators and metrics on the career of industrial processes such that it is determined that 17 primary indicators established CACEI are being met under the metric previously established. Similarly, 8 of the primary indicators are not widely met; for that reason you have a 68% compliance with the primary criteria in the form of widely and 5 indicators of 8 that are not met are widely displayed corresponding to 20%; the remaining primary indicators corresponding to 3 did not correspond to 12% time.
It is important to point out that the 3 primary indicators are not met: study program extension, contents and review.
These three indicators are fundamental to the educational program because they are the basis of the study of the program; the causes of failure were analyzed resulting in the following: The educational model of the UTs was designed to train college coaches. As time change, this approach and have had much acceptance in society; so it is not fulfilled these three indicators because in 2014 the change of plans and programs of study was not made.
There was a one-year delay since the whole model of UT was analyzed in depth. They changed all programs of study for the contents thereof are designed for engineering, as such existing programs suffer a substantial change in all its programs.
DISCUSSION
The verification of compliance with each of the key indicators was carried out through internal audits that establish Technological University in its program yearly. Quantifying each of the key indicators is evidence of compliance.
It is very important to create a culture of using the basic tools of quality control in order to analyze opportunities for improvement, monitoring trends and be able to prevent possible system failures.
CONFLICT OF INTERESTS
The authors have not declared any conflicts of interest.
REFERENCES
|
Barry RM, Stair MR, Hanna ME (2006). Mátodos cuantitativos para los negocios.méxico: pearson prentice hall. ISBN: 970-26-0738-8 |
|
CACEI (2011). Manual NMS. México. |
|
IMNC NM (2008). Sistema de gestión de la calidad requisitos. |
|
ISO (9001:2008). Diagnostic tool implementing quality management systems. |
|
Royero J (n.d.). Contexto mundial sobre la evaluación en las instituciones de educación superior. Revista iberoamericana de educación. |
Copyright © 2024 Author(s) retain the copyright of this article.
This article is published under the terms of the Creative Commons Attribution License 4.0


