Full Length Research Paper
ABSTRACT
Among multimedia researches, contribution of cartoons to teaching process and academic achievement has often been examined. However, these technologies may have a slower and less effect since acceptance of them by users is affected by many factors. Therefore, it is extremely important to understand and reveal the factors which encourage teachers who are to choose the most appropriate tool and material for students during teaching period to use cartoons for teaching or restrict their use. To this end, teachers’ perceptions, attitudes, intentions and behaviors concerning the use of cartoons for teaching were examined and modeled according to Technology Acceptance Model (TAM). As a result of the analyses, data were obtained from 271 teachers who work in several provinces to test its relationship between the variables of perceived benefit, perceived ease of use, attitude towards use, intention of use and actual behavior stated in TAM. The data obtained were analyzed with Structural Equation Modeling (SEM). The results show that the model gives different results from the ones foreseen in TAM. Moreover, it was seen according to the paired comparisons on the model that the only significant difference between females and males is attitude predicting strength of the perceived benefit
Key words: Technology acceptance model, structural equation modeling, educational cartoons.
INTRODUCTION
According to Chiangtong (1975), cartoon comes from Latin language “charta” which means paper because in that era cartoon meant painting onto large textile curtains or drawing patterns or pictures onto mirrors and making mosaics. Cartoons have 7 types. These are political cartoon, illustrated cartoon, gag, comic book or serial cartoon, commercial cartoon, feature length animated cartoons, and television cartoon. In this research, animated cartoons’ effects are investigated. Animated cartoon refers to a cartoon which is created by sequential photographs from drawn patterns and shows continuous movement (Dhangsubhuti, 2006).
In the last decade, cartoons have been an effective learning and teaching tool in parallel with the development of multimedia technology. Especially the improvements in video quality of cartoons, easy access to cartoons thanks to video sharing sites such as YouTube or Teachers tube, wide use of mobile devices and improving speeds of internet connection have accelerated the production and sharing of cartoons. As a result, studies concerning the contribution of cartoons to teaching process and academic achievement among multimedia researches have also intensified. It was observed in those researches that sound, graphics, texts and animations within such multimedia or cartoons generally attracted children's attention, effectively contributing to the learning process (Sinor, 2011). And it was stressed out that they are an important tool to improve children's mental, physical and psychological developments and discover their yet unrevealed skills (Cho, 2012). However, it is seen that researches which are looking into the effects on the acceptance and intentions to use of cartoons in teachers' in-class teaching approaches receive less importance or such researches are missing.
Some researchers have drawn attention to the limitations of cartoons as well as their educational benefits. Irkin (2012) emphasized that cartoons with content of violence and sexuality make students develop negative behaviors. Mayer et al. (2001) stated that cartoons have a potential of misconception since they are a simplified version of a phenomenon in most cases and may prevent students from learning through imagination while forming their mental models. Ningsih and Sari (2012) suggested that use of slang and foreign words may affect children's linguistic development negatively, that watching cartoons excessively may hinder children's relationship with the social circle and cause them to lose their critical thinking skills. Yorulmaz (2013) stated that some cartoons have problematic contents with respect to the education of religion and values. In this study, it was examined within the framework of TAM how all these perceived benefit and limitations as well as the attitudes and intentions concerning use of cartoons reflect on the behaviors of use.
Cartoons should be integrated into course programs and teaching media, so that they can contribute to the teaching processes as other teaching technologies (Bulbul and Cuhadar, 2011). Teachers who have difficulty in accepting the innovative teaching media supported with digital technologies nevertheless take this integration hard too and go back to their old teaching habits (Elmas and Geban, 2012). That is why teachers who are to choose the most appropriate tool and material for students in use of technology at schools should have information about the educational effect of these resources. They therefore contribute much more to students' achievement by choosing course activities suitable for their technological levels (Conole and Alevizou, 2010). Gunes and Baki (2011) argue that teachers' thought, belief and attitudes are ineffective since their beliefs about learning and teaching have not changed; therefore teachers cannot manage the innovation and have gone back to their old teaching habits. According to Andris (1996), teachers show resistance to educational change because of their machine skills and concerns about taking a risk. In addition, it is known that teachers' negative perspective of these technologies affects their level of use of these technologies although sufficient technological opportunities have been provided (Rosen and Weil, 1995). Therefore, new technologies may have a slower and less productive since acceptance of them by users is affected by many factors. It is also seen in the literature that many researches have been performed to determine the factors affecting teachers' use of technology. Ertmer (1999) divided the factors affecting the use of technology in these researchers into two groups: external and internal factors. Ertmer summarized the external factors as insufficient educational software, lack of access to a computer, lack of management assistance, time and technical assistance; the internal factors as teachers' beliefs and attitudes, teaching approaches, the class structure and their resistance to change. And she stated that it is more difficult than the other factors to eliminate the internal factors which affect the use of these technologies because teachers' thoughts, beliefs and intentions to use strongly prevent them from using these technologies.
The main objective of this research is to understand teachers' level of use of cartoons for teaching at elementary classes. For this purpose, teachers' perceptions, attitudes, intentions and behaviors were researched according to the TAM suggested by Davis (1989). TAM is a model that reveals why individuals accept or refuse information technologies. In other words, it explains the factors effective in potential users' adoption of new technologies. Although the performance of this model in explaining the intention to use had been different in various studies, TAM was chosen as the main model to form the research model in this study because Technology Acceptance Model has been widely used for predicting the acceptance, adoption, and use of information technologies (Chen, li and li, 2011; Yi et al., 2006). Also, the effect of gender as a moderating variable was studied.
Technology Acceptance Model (TAM)
TAM was developed by Davis (1989) and it aims to explain how users perceive and use technology. Theoretically, TAM is based on Fishbein and Ajzen’s Theory of Reasoned Action (1975) and emphasizes users’ beliefs, attitudes and intentions in adopting technology (Sánchez and Hueros, 2010). TAM has been widely used in a variety of studies using a range of variables and it has consistently been found to be strong predictors of acceptance behavior (Shipps and Phillips, 2013; Bagozzi 2007). Although TAM is a very useful, theoretical model for explaining and understanding the user behavior in using information technologies, it is considered to be limited and it is proposed that it should be expanded by adding new variables including human and social factors (Venkatesh et al., 2003; Burton and Hubona, 2006). Individual difference is regarded as a dominant factor in the adoption behavior of information systems. Especially, there are lots of studies that have been conducted to evaluate the differences between men and women. However, when these studies are evaluated particularly in terms of information technology use, there are some inconsistencies between the study findings. For example, in a research study women were found to be more able than men in terms of computer and internet use (Torkzadeh and Van Dyke, 2002). However, in another study it was reported that this perception is a clitche and that it does not reflect the real situation (Bunz et al., 2007). As a rationale for this, it was determined that there was a tendency towards the loss of differences among the groups when the influence of prior experience was eliminated (UrsavaÅŸ and Teo, 2010). Besides, Venkatesh and Morris (2000) found out in their study that the decision making processes of men and women were different from each other. Gefen and Straub (1997) reported gender differences that might relate to beliefs and to the use of computer-based media.
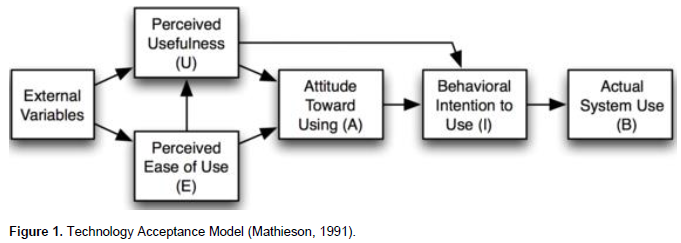
Figure 1 shows the relationships of the variables that form TAM with each other. According to this, the first-level determinant of a system's Actual Behavior is the Intention to Use (I). (I) explains a user's intention whether they will actually use the system. The determinant of (I) is Attitude towards Use (A) which explains individual's positive or negative assessments about using the system. There are two beliefs effective on the attitude in the model: Perceived Usefulness (U) and Perceived Ease of Use (E). (U) is the belief that using a system will increase the performance; € is the belief that using the system is not much an effort. If the individual can use this system easily without much effort, the effect on (U) will increase (Venkatesh, 2000).
Use of cartoons in education
Today, the number of cartoons which are especially made to help children's characteristic development, add them values (responsibility, fairness, trust, sharing, etc.), facilitate the learning of music and gymnastic moves and contribute to teaching of concept and the development of other cognitive skills has quickly increased. According to Micheal and Wyk (2011), cartoons are methods that can be used to support teaching in class or outside of class. They stated that cartoons might support teaching in constructive learning, contextual learning, social skills, collaborative learning, critical thinking and small group learning.
However, it is seen that the benefit perceived from the cartoons differ when related resources and researchers are examined. Türkmen (2012) stated that cartoons are a door which opens to imaginary world from the real world and explained that children can fictionalize themselves in this realm freely and meanwhile, they transfer what they learn or see in this world they entered the real life, and it is possible to shape the children and, in a sense, their way of life through the world of cartoons. Doring (2002) supported the use of cartoons in class and stated that they prevent students' destructive behaviors, ease boredom and the increasing amount of interest and connection, therefore helping build a positive learning environment. However, Doring also stated that using other types of humor and cartoons in classroom has its risks as well as the benefits and warned teachers about not using excessively. Doring added that using cartoons is very useful for eliminating the contradiction between perception and reality because phenomena and events are generally exaggerated to succeed in the explaining action. Macgillivray (2011) stated that cartoons may help students determine and analyze prejudiced behaviors, phenomena and events. Keoght et al. (1998) came to the conclusion in their study on physics students that using cartoons is attractive for teaching the content of physics and motivates the students for the course. Dougherty (2002) explained that using political cartoons in class encourages students to think seriously, attracts attention to current political issues and decreases monotonousness of the courses. Dougherty warned teachers about choosing cartoons suitable for the age group and the subject. Ince (1991) stated that the subject can be given in a realistic approach as well as in a way that develops the imagination in cartoons; the teaching period can be made likeable, and therefore, the will to learn can be increased. It also increases the memorability and provides an effective learning through colors and sounds. In a study carried out by Singer and Singer with preschoolers of different cultures and races in 1998, it was seen that educational programs such as Barney and Friends, Sesames Street and Mister Roger's Neighborhood had a positive effect on the cognitive, social and linguistic development of children of this age group. They listed these effects as increase in counting and speaking skills as well as feeling positive emotions and exhibiting positive attitudes about respect, love, sharing, friendship, etc. Barak et al. (2011) researched the effect of the animation movie "BrainPop" which is in accordance with the national science education curriculum of Israel on learning and motivation. In the study, they found that the movie developed their thinking skills, information understanding, applying and judging skills, their level of contacting with daily life and apprehending its importance for future. According to the social learning theory by Bandura (1971) children learn by taking the individuals around them as models, and the fact that the characters or individuals taken as models are at similar ages and a fictional character increases the modeling and the learning by imitating. In this respect, children can learn through observation or through imitation by taking cartoon characters as models while watching cartoons. Again, many researchers encourage educators to benefit from cartoons and animations (Cho, 2012; Hawkins and Davidson, 2007).
METHODS
In this research, a scale was developed based on TAM to explain teachers' perceptions, attitudes, intentions and behaviors concerning the use of cartoons for teaching. Within this scope, data were obtained from 271 teachers who work in 46 provinces in Turkey to test its relationship between the variables of perceived benefit, perceived ease of use, attitude towards use, intention of use and actual behavior stated in TAM. This study used the Statistical Package for the Social Science (SPSS) and Analysis of Moment Structure (AMOS) software. SPSS was used to analyze the demographic data of the participants using descriptive statistical frequency test and to obtain the results of correlation between variables. AMOS software was used for Structural Equation Modeling method (SEM). SEM was used in order to explain the structure of the linear equation being represented.
The model should have a positive degree of freedom in the Structural Equation Modeling. The sample size is effective in determining its conformity and predicting their parameter values within this context. Sufficient sample size is determined according to total sample size or number of variables. In the literature the sample size should be at least 100 or 10 times bigger than the number of variables in the normal distribution, 5 times bigger in other distributions (Muthén and Muthén, 2002). Therefore, it can be said that data obtained from 271 people are sufficient. 82% of these teachers work at state schools, the rest work at private schools. 48% of the research group is male, 52% is female. Distribution of teachers based on their branches is as follows: 59% is class teacher, 14% is science and technology teacher, 7.7% is mathematics teacher, 7.3% is social sciences teacher and the rest is of 13 different branches. It can be said according to these results that the sample is mainly composed of teachers who work at state schools and as class teachers.
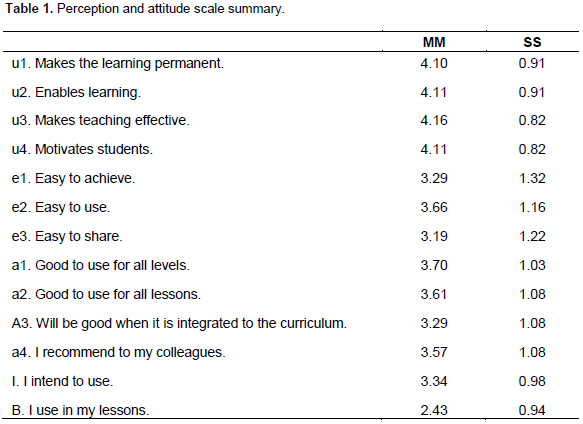
A scale was developed to collect data based on the studies concerning the technology acceptance and use models and theories in the literature (Venkatesh, 2000; Agarwal and Karahanna, 2000; Saade and Bahli, 2005, Cheng et al., 2006; Lai and Li 2005). The scale consists of four items under Usefulness, three items under Ease and four items under Attitude titles. Items were graded in 5-point Likert type (1: Strongly Disagree, 2: Disagree, 3: Neutral, 4: Agree, 5: Strongly Agree). And one item each was added in 5-point Likert type for the intention to use and the behavior of use (1: Never, 2: Seldom, 3: Sometimes, 4: Usually, 5: Always). As a result of the principal component analysis performed on the items, an item under the ease title was removed from the scale due to low level of value.
RESULTS
Cronbach’s alpha (a) was used to measure internal consistency by software SPSS22.0 in this study. The Cronbach’s a can have value ranging from 0 to 1 and the internal reliability of the items in the scale is said to be the maximum when it is closer to 1. An (a) value of 0.70 and above is considered to be the criterion for demonstrating internal consistency of the scale (Nunnally, 1978). In this study, the Cronbach’s alpha coefficient calculated for the total test was 0.845 and reliability and intra class correlations ranged from 0.81 to 0.89 within and between teachers in patients with moderate to gender. According to the results, the measure has demonstrated adequate reliability. Also, Skewness and kurtosis were computed to assess the variables for normality. Skewness and kurtosis values of zero are indicative of a normal distribution and skewness values between −2 and +2 signify no problematic deviations from normality (George and Mallery, 2010). For the current data, all measures of kurtosis and Skewwness were acceptable (-1,878, 1,988).
Looking at the means of the scale items (Table 1), it is seen that teachers are hesitant about the ease of use although they find using cartoons at elementary schools useful. It can be also said that their attitudes are positive. It is also seen that teachers are more homogenous about their perception of usefulness when looked at the standard deviations. And when looked at the intention to use, their current status of use is very little while they sometimes tend to use. The results indicate the existence of other variables which affect the intention to use and actual behavior and was not foreseen in the model (Collis and Moonen, 2008; Venkatesh et al., 2003; Burton and Hubona, 2006). One of these variables may be the gender and its effect on the model was examined within the scope of the research.
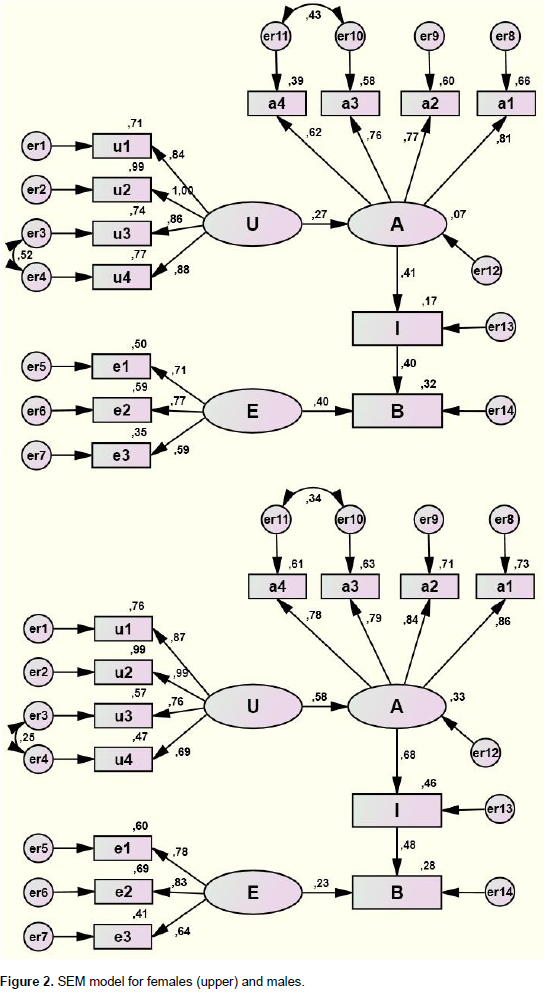
Technology Acceptance Model concerning teachers' use of cartoons in class was generated with AMOS software, and corrections were made after the assessment of the analysis results. As a result, the harmony seems to be good when looking at the harmony measurements of the model (Figure 1 and Figure 2) obtained (CMIN/df=1.173; RMSEA=0.032, CFI=0.991, NFI=0.940, RFI=0.922, IFI=0.991, TLI=0.998). When looking at the model, E was not found to be a predictor of A differently from that foreseen in TAM. According to the model, U as well as E is the direct predictor of A. It seems again that U does not directly predict I differently from that foreseen in TAM. Also, when looked at the paired comparisons of the model, it is seen that the only significant difference between females and males is U's strength to predict A (χ2=2.23).
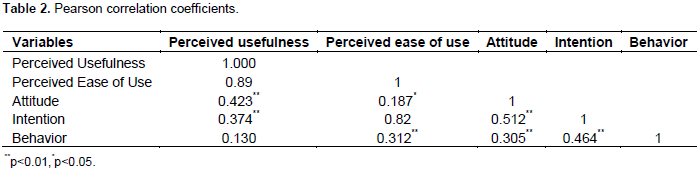
The correlation result about the variables in TAM model is given in Table 2. When the correlation coefficients between the variables are examined, it can be seen that there are positive and significant relation-ships among the variables themselves and between the actual behavior and variables (p <0.01).
DISCUSSION AND CONCLUSION
Results show that the model explains teachers' status of using cartoons in class at a rate of 32% for females, 28% for males. This result also shows that other variables not included in the model have an important effect. Prior research has presented various perspectives on individual differences, which mostly focused on demographic variables, such as age, gender, education and individual experience (Lin et al., 2013). Therefore, future research should investigate the impact of such variables on the model. Also, it revealed that TAM worked with the data obtained from the current sample differently from the original. And the gender variable was significant for the perceived benefits strength to predict the attitude. These results reveal that TAM may work differently in samples and groups with different properties and how important is to include the moderator variables such as gender in the model. In our study, it was found that teachers' perception of ease of use for using cartoons directly cause them to form an attitude. However, it was determined that male teachers' attitude towards use explains it from the aspect of perceived usefulness variable in a higher level compared to female teachers. According to this result, it can be said that males' perception of usefulness for using technology has a stronger effect than females, and male teachers are more aware of the benefits of using educational cartoons. From the aspect of the perceived ease of use variable, female teachers' perception of ease of use is a stronger predictor of the actual behavior compared to male teachers when gender differences are examined. There are other studies in the literature that support the findings of this study. For example, Venkatesh and Davis (2000) researched the effect of gender and social effect on the acceptance and use of technology. In their research, they found that males' perception of usefulness for using technology have a stronger effect compared to females, and ease of use and individuals norms have a stronger effect when it comes to use of technology for females. Gefen and Straub (1997) added the gender to the Technology Acceptance Model as an external factor and revealed that it affects the ease of use and the perceived benefit. They could not find a direct connection between the perceived ease of use and the use. Baker et al. (2007) found the effect of subjective norms on the intention to use important for the users on the levels of different gender, age and education. The fact that a personal norm is effective in determining the intentions and in the possibility of behaving in a certain way has often been discussed by the researchers. However, it was seen that the personal norm gave inconsistent results for using IT. While this variable was found to be positively and significantly effective on the intention to use, this effect could not be achieved with others (Ma et al., 2005; Koszalka, 2000). When effects of perceived ease of use and usefulness on behavioral intention are examined, it is seen that neither of them has a direct effect. In their study, in which they researched the adoption of wireless technologies by small business based on TAM (Technology Acceptance Model), Anderson and Schwager (2005) found that ease of use has no direct and significant effect on intention. However, all studies have reached the same results about the effects of perceived ease of use over use of information system/information technology. Davis (1989) suggests that perceived ease of use has a stronger effect on the attitude compared to perceived benefit. According to Cheng et al. (2006) perceived ease of use has an important effect on the attitude and affects individual’s behavioral intention (Venkatesh, 1999). In their study, in which they researched intern teachers’ intention to use a computer, Ma, Anderson and Streith (2005) revealed that perception of usefulness directly, ease of use indirectly predict the intention. There have been studies which examine the cause of this difference. For example, Davis (1989) found that direct effect of perceived ease of use on intention is stronger in the first periods of learning and behavior. It was seen that this effect becomes indirect through perceived benefit over time and with increasing amount of experiences. This thesis was asserted in later studies (Gefen and Straub, 1997; Igbaria et al., 1997). Teo et al. (1999) stated that the effect of perceived ease of use on behavioral intention is in direct proportion to technological complexity level. According to the results of this research it can be said that low level of perceived complexity with respect to use of cartoons and experience of teachers about using these resources eliminate the direct effect of perception of ease of use on behavioral intention.
As a result, it is seen that teachers have hesitations about the ease of use although their perception of usefulness for using cartoons in SEM formed according to TAM. This can be attributed to the insufficiency of technological infrastructure of the classrooms and the fact that they cannot access cartoons suitable for the curriculum easily. And it is seen that the perception of ease of use is a direct predictor of the actual use, and the perception of usefulness is a direct predictor of the attitude. It can therefore be said that the high level of perception of usefulness for using cartoons affect the attitudes positively. Teachers seem to be hesitant when looking at their intention to use cartoons. According to the model obtained, it is seen that the intention is predicted by the attitude. The fact that the intention to use is low, although the attitude is positive, shows that there are other variables affecting the intention. The gender is one of them, and it was found that there is a significant difference of the predicting strength of perception of usefulness between genders. Similarly, there seems to be a difference in the attitude strength to predict the intention between genders. Other variables should be added to the model: teachers' perception, attitude, intention and behavior concerning the use of cartoons for teaching.
CONFLICT OF INTERESTS
The authors have not declared any conflict of interests.
REFERENCES
|
Agarwal R, Karahanna E (2000). Time flies when you're having fun: Cognitive absorption and beliefs about information technology usage. MIS Quart. pp. 665-694. |
|
|
Anderson EJ, Schwager PH (2005). SME adoption of wireless lan technology: applying the UTAUT model. Proceeding of the 7th Conference of the Southern Association for Information Systems. |
|
|
Baker EW, Al-Gahtani SS, Hubona GS (2007). The effects of gender and age new technology implementation in a developing country: Testing the theory of planned behavior (TPB), Infor. Technol. People 20(4):352-375. |
|
|
Bandura A (1971). Social learning theory. Stanford University Press. |
|
|
Barak M, Ashkar T, Dori YJ (2011). Learning science via animated movies: Its effect on students' thinking and motivation. Computers Educ. 56(3):839-846. |
|
|
Bagozzi RP (2007). The Legacy of the Technology Acceptance Model and a Proposal for a Paradigm Shift. J. Association Inform. Syst. 8(4):3. |
|
|
Bunz U, Curry C, Voon W (2007). Perceived versus actual computer-email-web fluency. Computers Hum. Behavior 23(5):2321-2344. |
|
|
Bulbul T, Cuhadar C (2011). Evaluation of policies related with technology use Turkish Educational System. VI. Balkan Education and Science Conference. 29 September-1 October 2011. Skopje, Macedonia. pp. 423-428. |
|
|
Burton-Jones A, Hubona GS (2006). The mediation of external variables in the technology acceptance model. Infor. Manage. 43(6):706-717. |
|
|
Chen S, Li S, Li C (2011). Recent related research in technology acceptance model: A literature review Austr. J. Bus. Manage. Res. 1(9):124-127. |
|
|
Cheng JMS, Sheen GJ, Lou GC (2006), Consumer acceptance of the internet as a channel of distribution in Taiwan - A Channel Function Perspective, Technovation, 26(7):856-864. |
|
|
Chiangtong P (2518). Literary for Children. Bangkok; Gim-nguan Printing. pp. 45-46. |
|
|
Cho H (2012). The use of cartoons as teaching a tool in Middle School Mathematics, PhD Thesis. Columbia University, Graduate School of Arts and Sciences. |
|
|
Collis B, Moonen J (2008). Web 2.0 tools and processes in higher education: Quality perspectives. Educational Media International 45(2):93-106. |
|
|
Conole G, Alevizou P (2010). A literature review of the use of Web 2.0 tools in higher education. A report commissioned by the Higher Education Academy. |
|
|
Davis FD (1989). Perceived usefulness, perceived ease of use, and user acceptance of information technology. MIS Quarterly, 38:319-340. |
|
|
Dhangsubhuti R (2006). The animated cartoon viewing habits and behavior of children in saeng arun dhonburi school. Independent study, Doctoral dissertation, Kasetsart University. |
|
|
Doring A (2002). The use of cartoons as a teaching and learning strategy with adult learners. New Zealand J. Adult Learn. 30(1):56-62. |
|
|
Dougherty AJ (2002). Deciphering the origin and evolution of a paraglacial barrier, Castle Neck, Massachusetts, Unpublished Master Thesis, Department of Earth Sciences, Boston University, Boston, MA. |
|
|
Elmas R, Geban O (2012). Web 2.0 tools for 21st century teachers. Int. Online J. Educ. Sci. 4(1):243-254. |
|
|
Ertmer P (1999). Addressing first and second-order barriers to change. Strategies for technology implementation. Educ. Technol. Res. Dev. 47(4):47-61. |
|
|
Fishbein M, Ajzen I (1975). Belief, attitude, intention and behavior: an introduction to theory and research. reading, MA: Addison-Wesley. |
|
|
Gefen D, Straub DW (1997). Gender differences in the perception and use of E-Mail: An extension to the technology acceptance model. MIS Q. 21(4):389-400. |
|
|
George D, Mallery M (2010). Using SPSS for Windows step by step: a simple guide and reference. Boston, MA: Allyn & Bacon. |
|
|
Gunes G, Baki A (2011). Reflections from application of the fourth grade mathematics course curriculum. HU, J. Educ. 41(41). |
|
|
Hawkins L, Davidson M (2007). Engaging English, literacy, media and art curriculum, outcomes. Educ. Technol. Guide 15:60-63. |
|
|
Igbaria M, Zinatelli N, Cragg PB, Cavaye ALM (1997). Personal computing acceptance factors in small firms: a structural equation model, MIS Q. 21(3):279-305. |
|
|
Ince M (1991). Cartoons' role and importance of the 6-18 age group individuals in their life. Unpublished master's thesis. Gazi University, Ankara, Turkey. |
|
|
Irkin (2012). Television and its effects on the process of the development of children, Master Theses, The Radio and Television Supreme Council, Ankara, Turkey. |
|
|
Andris J (1996). The relationship of indices of students navigational patterns in a hypermedia geology lab simulation to two measures of learning style. J. Educ. Multimedia Hypermedia, 15:303-315. |
|
|
Keoght N, Naylor S, Eilson C (1998). Concept cartoons: A new perspective on physics education, Phys. Educ. 33(4):220-224. |
|
|
Koszalka TA (2000). Effect of computer mediated communications on teachers' attitudes toward using Web resources in the classroom. J. Instructional Psychol. 28(2):95-103. |
|
|
Lai VS, Li H (2005). Technology accaptance model for internet banking: an invariance analysis, Infor. Manage. 42:373-386. |
|
|
Lin PC, Lu HK, Liu SC (2013). Towards an education behavioral intention model for elearning systems: An extension of UTAUT. J. Theoretical Appl. Infor. Technol. 47(3):1200-1207. |
|
|
Ma WW, Anderson R, Streith KO (2005). Examining user acceptance of computer technology: an empirical study of student teachers, J. Comput. Assisted Learn. 21:387-395. |
|
|
Macgillivray LK (2011). Using cartoons to teach students about stereotypes and discrimination: one teacher's lessons from south park, J. Curriculum and Pedagogy 2(1):133-147. |
|
|
Mayer RE, Heiser J, Lonn S (2001). Cognitive constraints on multimedia learning: When presenting more material results in less understanding. J. Educ. Psychol. 93(1):187-198. |
|
|
Muthén LK, Muthén BO (2002). How to use a monte carlo study to decide on sample size and determine power. Structural Equation Modeling, 9:599-620. |
|
|
Ningsih ZW, Sari MP (2012). Teaching writing paragraph through please strategy at junior high school. e-J. Mahasiswa Prodi Pend Bahasa Inggris 1(4). |
|
|
Nunnally JC (1978). Psychometric theory (2nd ed.). New York: McGraw-Hill |
|
|
Rosen LD, Weil MM (1995). Computer availability, computer experience and technophobe among public school teachers. Computers Hum. Behav. 11(11):9-31. |
|
|
Saade R, Bahli B (2005). The impact of cognitive absorption on perceived usefulness and perceived ease of use in on-line learning: An extension of the technology acceptance model, Inform. Manage. 42(2):317-327. |
|
|
Sánchez RA, Hueros AD (2010). Motivational factors that influence the acceptance of Moodle using TAM. Computers Hum. Behav. 26(6):1632-1640. |
|
|
Shipps B, Phillips B (2013). Social networks, interactivity and satisfaction: assessing socio-technical behavioral factors as an extension to technology acceptance. J. Theoret. Appl. Electronic Commerce Res. 8(1):35-52. |
|
|
Singer DG, Singer JL (1980). Television viewing and aggressive behavior in preschool children: a field study. Annals of the New York Acad. Sci. 347(1):289-303. |
|
|
Sinor MZ (2011). Comparison between conventional health promotion and use of cartoon animation in delivering oral health education. Int. J. Humanit. Soc. Sci. 1(3):169-174. |
|
|
Teo TSH, Lim VKG, Lai RYC (1999). Intrinsic and Extrinsic Motivation in Internet Usage, Omega 27(1):25-37. |
|
|
Teo T, UrsavaÅŸ ÖF (2012) Technology Acceptance of Pre-Service Teachers in Turkey: Cross-Cultural Model Validation Study. Int. J. Instructional Media 39(3):193-201. |
|
|
Torkzadeh G, Van Dyke TP (2002). Effects of training on Internet self-efficacy and computer user attitudes. Computers Hum. Behav, 18(5):479-494. |
|
|
Türkmen N (2012). Carton film's cultural role in the transmission and Pepee. Cumhuriyet University, J. Soc. Sci. 36(2). |
|
|
Wyk V, Micheal M (2011). The use of cartoons as a teaching tool to enhance student learning in economics education. J. Soc. Sci. 26(2):117-130. |
|
|
Venkatesh V (1999). Creation of favorable user perceptions: Exploring the role of intrinsic motivation, MIS Q. 23(2):239-260. |
|
|
Venkatesh V, Davis FD (2000). A theoretical extension of the technology acceptance model: four longitudinal field studies, Manage. Sci. 46(2):186-208. |
|
|
Venkatesh V (2000). Determinants of perceived ease of use: integrating perceived behavioral control, computer anxiety and enjoyment into the technology acceptance model. Infor. Syst. Res. 11:342-365. |
|
|
Venkatesh V, Morris M, Davis G, Davis FD (2003). User Acceptance of Information Technology: Toward a Unified View. MIS Q. 27(3):425-478. |
|
|
Yi MY, Jackson JD, Park JS, Probst JC (2006). Understanding information technology acceptance by individual professionals: toward an integrative view. Inform. Manage. 43(3):350-363. |
|
|
Yorulmaz (2013). Research on the animated movie "Pepee" according to religious and values education, J. Int. Soc. Res. 6(24). |
|
Copyright © 2024 Author(s) retain the copyright of this article.
This article is published under the terms of the Creative Commons Attribution License 4.0


